
Ethereum saw a massive retracement during the early hours of Monday. As a result, the 4-hour chart revealed that it retraced from $4,726 to a low of $4,550, losing almost 3% in the process.
Subsequent trading action shows that the bulls attempted a buyback and saw limited success as the asset surged to a high of $4,684. However, the bears retook control at 16:00 hours, causing prices to plummet to a low of $4,414.
The 4-hour chart shows that the apex altcoin retraced even lower a few minutes ago. It dropped to a low of $4,335, the lowest in the last three days. On the 1-day scale, Ethereum is down by almost 8%.
Data from Coinglass shows that traders lost over $900 million in the last 24 hours. The bulls accounted for almost 90% of the total losses, losing $813 million. The most liquidation happened in Ethereum as rekt capital exceeded $321 million, and longs accounted for $284 million.
Nonetheless, a bulk of the liquidations happened in the last 4 hours as the market plummeted even more. Rekt funds during this period exceeded $480 million, with $157 million lost on ETH. It is worth noting that of the total liquidations during this period, the bulls accounted for $147 million.
Massive Profit Taken Triggered By All-time High
A recent report from Glassnode shows that Ethereum holders were in profit as the altcoin surged to a new all-time high. The MVRV climbed to 2.15, which means that, on average, investors hold 2.15x unrealized gains.
The platform noted that this level of MVRV ratio was seen in March 2024 and November 2020, and both preceded a period of high volatility and profit-taking. The current price suggests that history is repeating itself as the altcoin dropped by over 8% in the last 48 hours.
Data from Lookonchain shows that some whales are already selling. One such dumped 5500 ETH. Another decided to close his long positions worth over $612 million as panic grips the market.
However, current price action shows some investors are buying the dip already as the altcoin trades at $4,373.
Is Ethereum Downtrend Over?
The 1-day chart shows that Ethereum retested the Bollinger’s upper band on Sunday. However, it failed to break above it, as it saw notable rejections before $5k. The hike to this level is significant as the last time the altcoin broke above this metric, it retraced by 14% before the rebound.
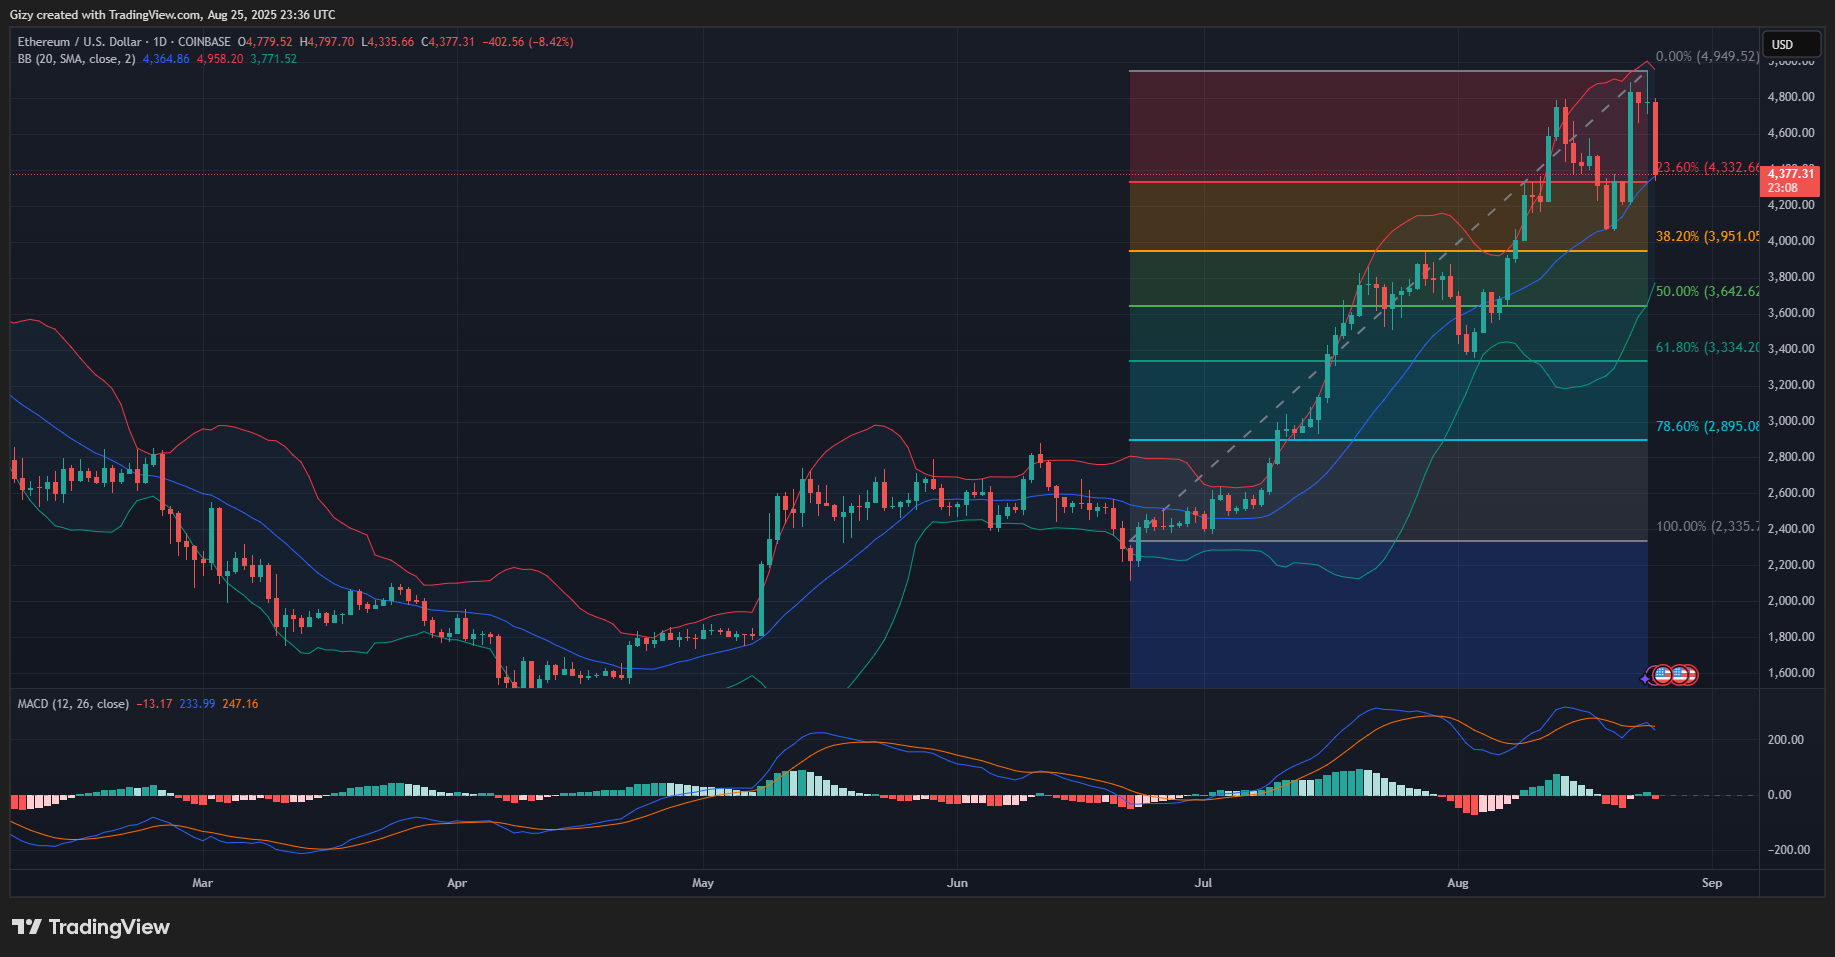
Nonetheless, the rebound happened following its retracement to the Bollinger’s middle band. If this price movement repeats, it will signify the end of the downtrend as ETH is already trading at the metric.
However, if the sell-offs continue, Ethereum might slip below the middle band and approach the lower band. This would mean that the coin will drop below $4k before rebounding.
The Fibonacci retracement level also identifies the importance of holding prices at $4340. It shows that there’s notable demand concentration at this level, and a further slip would send the coin to the 38% mark at $3950. The decline may continue to the 50% Fib level at $3640.
Aligning with the readings from the Fibonacci retracement level, previous price movement suggests that if Ethereum loses the $4340 mark, there’s a high likelihood it drops to its previous low of $3400. Nonetheless, there’s notable demand concentration at $4080.


