
Ethereum is seeing a slight increase in the early hours of Thursday, displaying behaviour different from that seen over the last two days.
The coin attempted another run at $2,000 but failed, as it faced notable selling pressure at $1,981. It is currently declining, trading slightly lower.
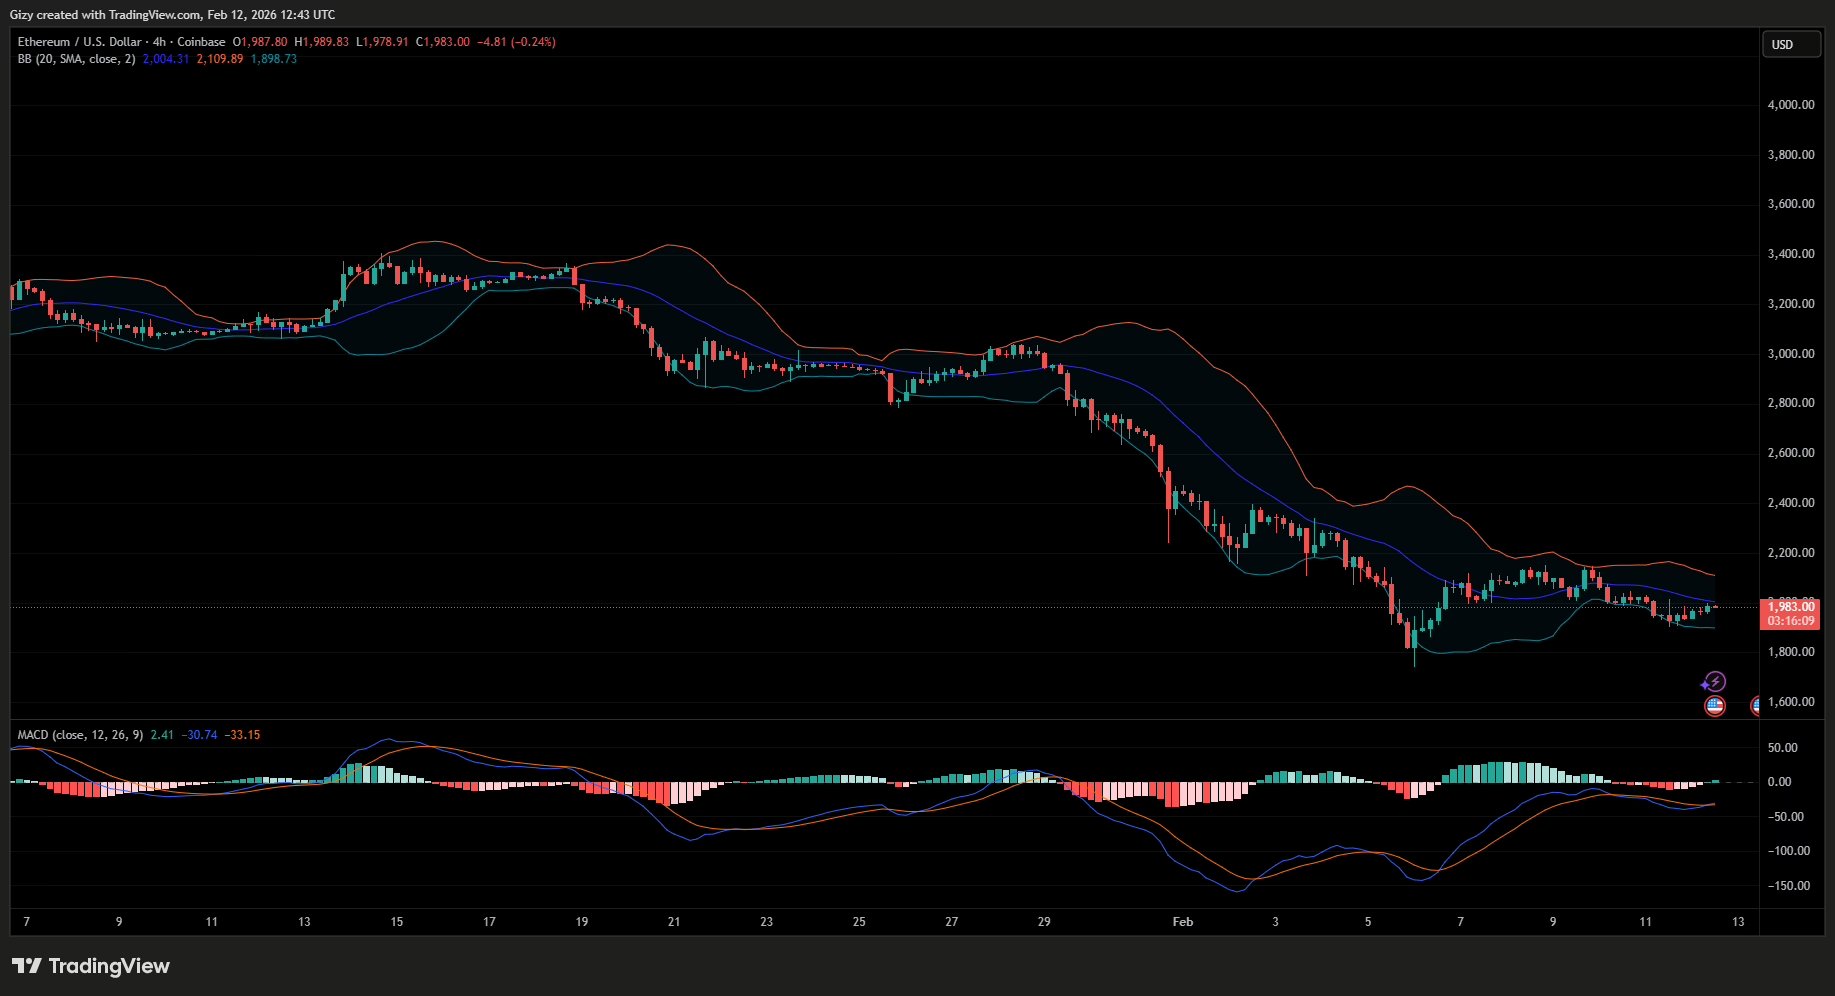
However, the 4-hour chart shows that the latest start is different from what was seen in the last two days. The asset opened with a red candle and continued to decline. Those losses over the two days were among the largest, with ETH losing almost 4% on Tuesday and slightly more the next day.
The change, although considered insignificant, may indicate a further uptrend in the coming hours. Interestingly, indicators on the chart support predictions of further increases. One such is the moving average convergence divergence, which displays an almost complete positive crossover.
Aside from MACD, the asset dropped below the bollinger bands on the 4-hour chart, suggesting an increased likelihood of a surge. If these bullish indicators play out, the altcoin will break $2k in the coming days.
Away from the charts, data from CryptoQuant show that investors have resumed buying, as indicated by a decline in exchange reserves. In the derivative market, the taker buy-sell ratio is also above 1, suggesting bullish actions in the sector.
Additionally, the US BLS will release the initial jobless claims report in the coming hours. Current forecasts are positive, with many expecting the figures to be lower than last week’s. If this happens, the likelihood of a further uptick increases.
Wednesday Casts Doubt
While several available metrics suggest that a surge on Thursday is inevitable, it is worth noting that these indicators were also present on Wednesday. For example, MACD and the bollinger bands indicated rebounds. Additionally, key data came in better than expected.
The concerned authority released the US employment report for January, which came in at 130k, higher than the previous month. However, after a slight uptick in response to the news, the upward momentum waned. As a result, the asset lost over 4%.
Questions about why prices reacted this way remain a heated debate. Nonetheless, the fear-and-greed index is at 9, one of its lowest readings. It means the news failed to dispel investors’ fear.
The same trend may playout on Thursday. While forecasts for initial jobless claims are positive, they may not be enough to cause a significant shift in traders’ psychology. Investors may shrug it off as they did the previous report.
Aside from fears that the impending release may not guarantee massive increases, the Thursday trend is another obstacle to further increases in the coming hours.
A closer look at the chart shows that Ethereum almost always retraces on the fourth day of the week. The last time it broke this trend was on Oct 23, when it saw a slight uptick. Nonetheless, this does not mean the asset becomes instantly bearish on Thursday. In some cases, it sees slight increases, as it is experiencing at the time of writing, but sheds them later.
In summary, there’s a higher chance prices retrace further in the coming hours. While indicators are positive, they do not guarantee massive hikes.
Why Must Ethereum Surge This Thursday?
With growing uncertainty, it remains to be seen how prices will play out on Thursday. However, the bulls have added incentive to cause a massive rally in the coming hours.
One such is the scheduled option expiry on Friday. Contracts worth almost $400 million will be terminated on Deribit. The bulls currently have the highest open interest, accounting for 104,654 of the total 200,723.
While the total open interest shows calls are higher, some investors are currently flipping bearish. Over the last 24 hours, the number and notional value of put buyers have increased significantly. It remains to be seen how this shift will affect the overall contract.
Away from open interest, the max pain point is $2,200. Ethereum is trading near $2,200, which means most put buyers (bears) are currently in profit. The importance of such on Thursday becomes clearer on the Greek tables.
At $1,975, the delta is max positive, which means that market makers will flip max bearish, shorting the coin. However, the shorts will gradually be throttled back as prices continue to rise. The metric will become almost zero at $2,200 (the max pain). This means that if the bulls stage a rally in the coming hours, they could push prices above these bearish levels.
Most call buyers will be in profit above $2.2k, and MMs are more willing to let prices play out without interference. If ETH ends Thursday at $2.1k, $2.3k is more likely on Friday. However, if the current upward momentum wanes, the coin will certainly slip below $1,900, effectively eliminating chances of a surge above the pain price.
Ethereum Stares Down $1,700
Aside from call buyers ending in profit, a surge on Thursday may trigger further uptrend that may extend into the coming week. If the bulls fail to stage a rally in the coming hours, they bring ETH closer to $1,700.
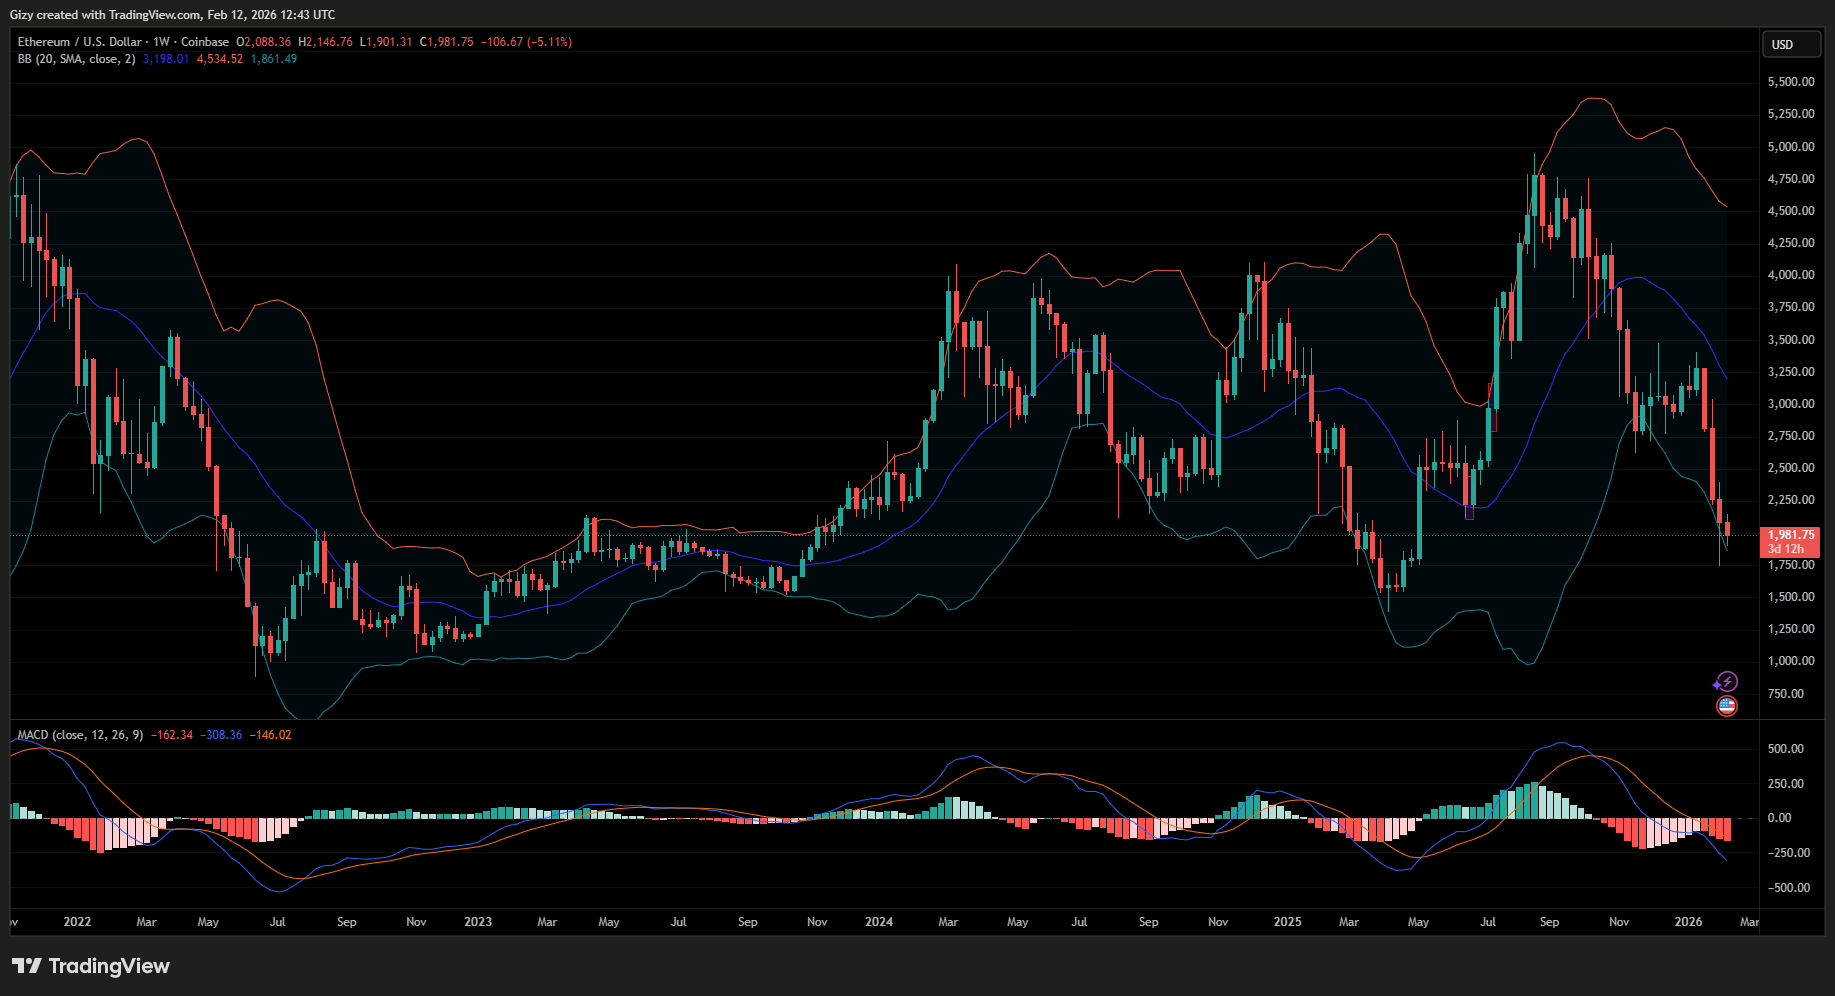
In hindsight, last week was one that many investors would love to forget. However, a key event from the session will inevitably affect price action in the coming days. Recall that the asset retraced to a low of $1,742 before sharply recovering.
It ended the week at $2,080, leaving a massive fair value gap. As seen in previous FVG occurrences on this scale, prices will inevitably come down to fill it in the coming weeks. On average, it takes two weeks to fill such gaps.
There’s a high likelihood that the altcoin will fill the gap this week if ETH loses momentum in the coming hours. To put this into perspective, it may be gearing up for another 10% decline in the coming days if recovery fails on Thursday.
Get Trending Crypto News as It Happens. Follow CoinTab News on X (Twitter) Now


