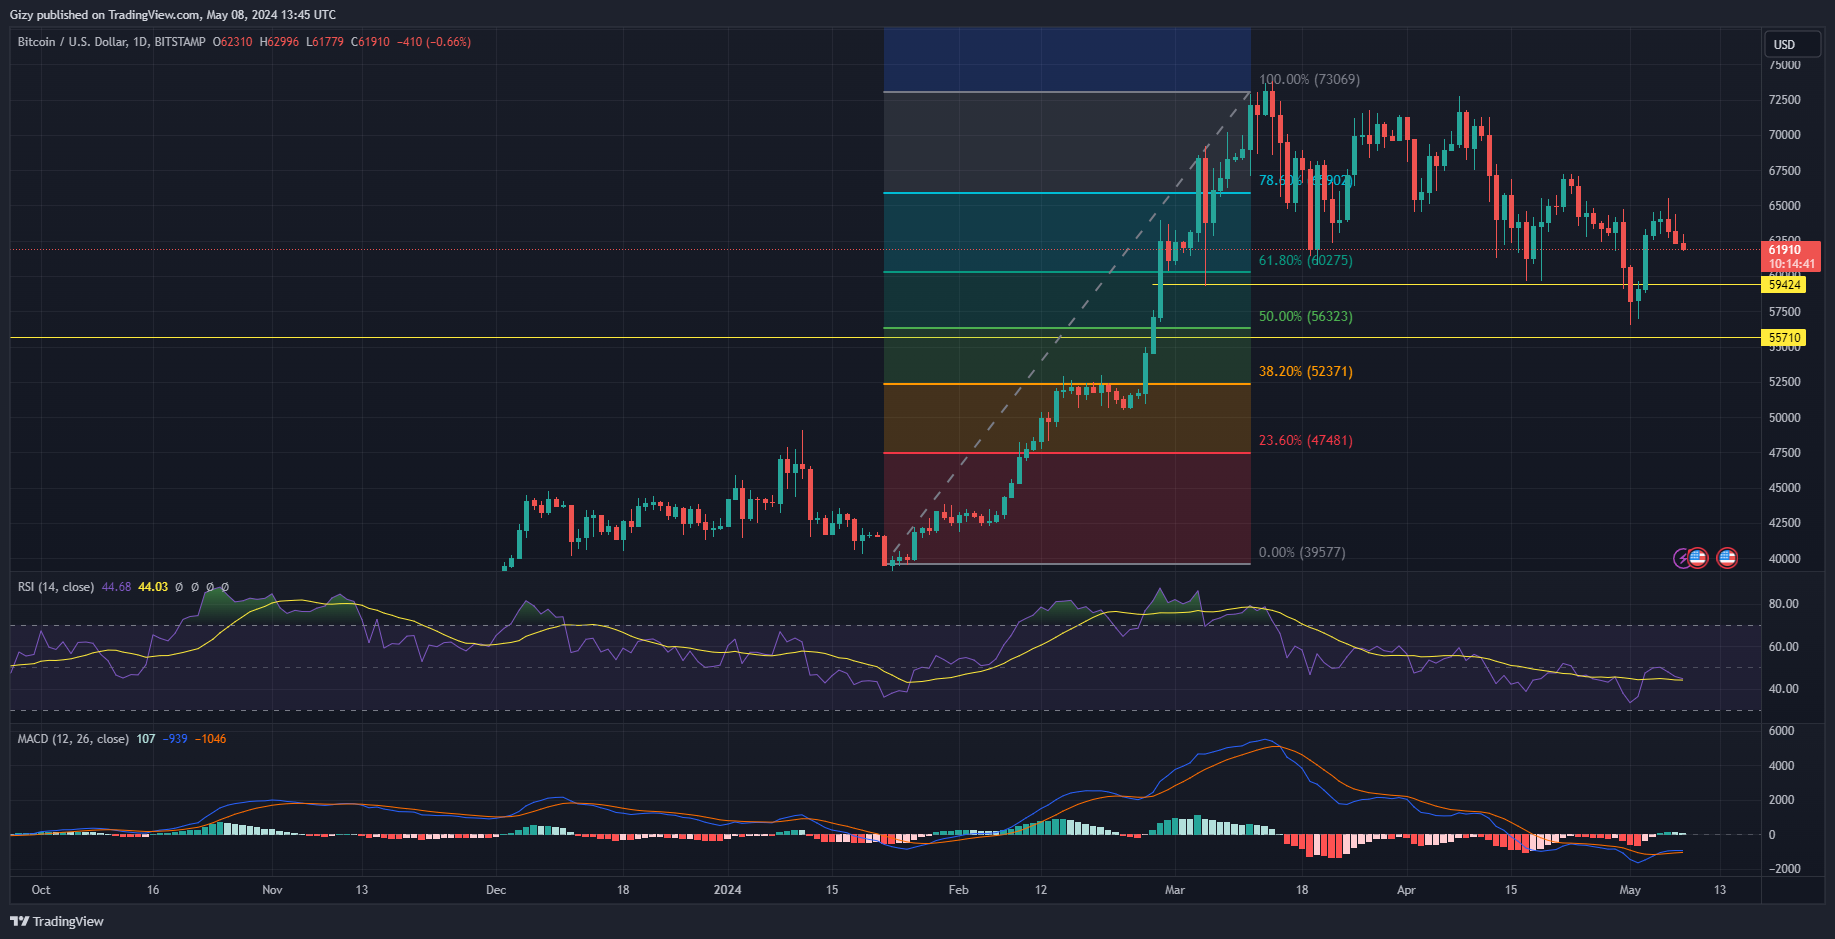
Bitcoin is currently trading below $62k. This comes as it retraced to a low of $61,779. Nonetheless, since losing the mark, the apex coin continued to hover around it.
The current intraday session marks the continuation of the downtrend, from which the apex coin has yet to recover. Since the week started, the asset lost over 3%. Since failing to flip the $65k resistance decisively, it struggles to hold the price above critical levels.
Several factors contribute to the current trend the asset is seeing.
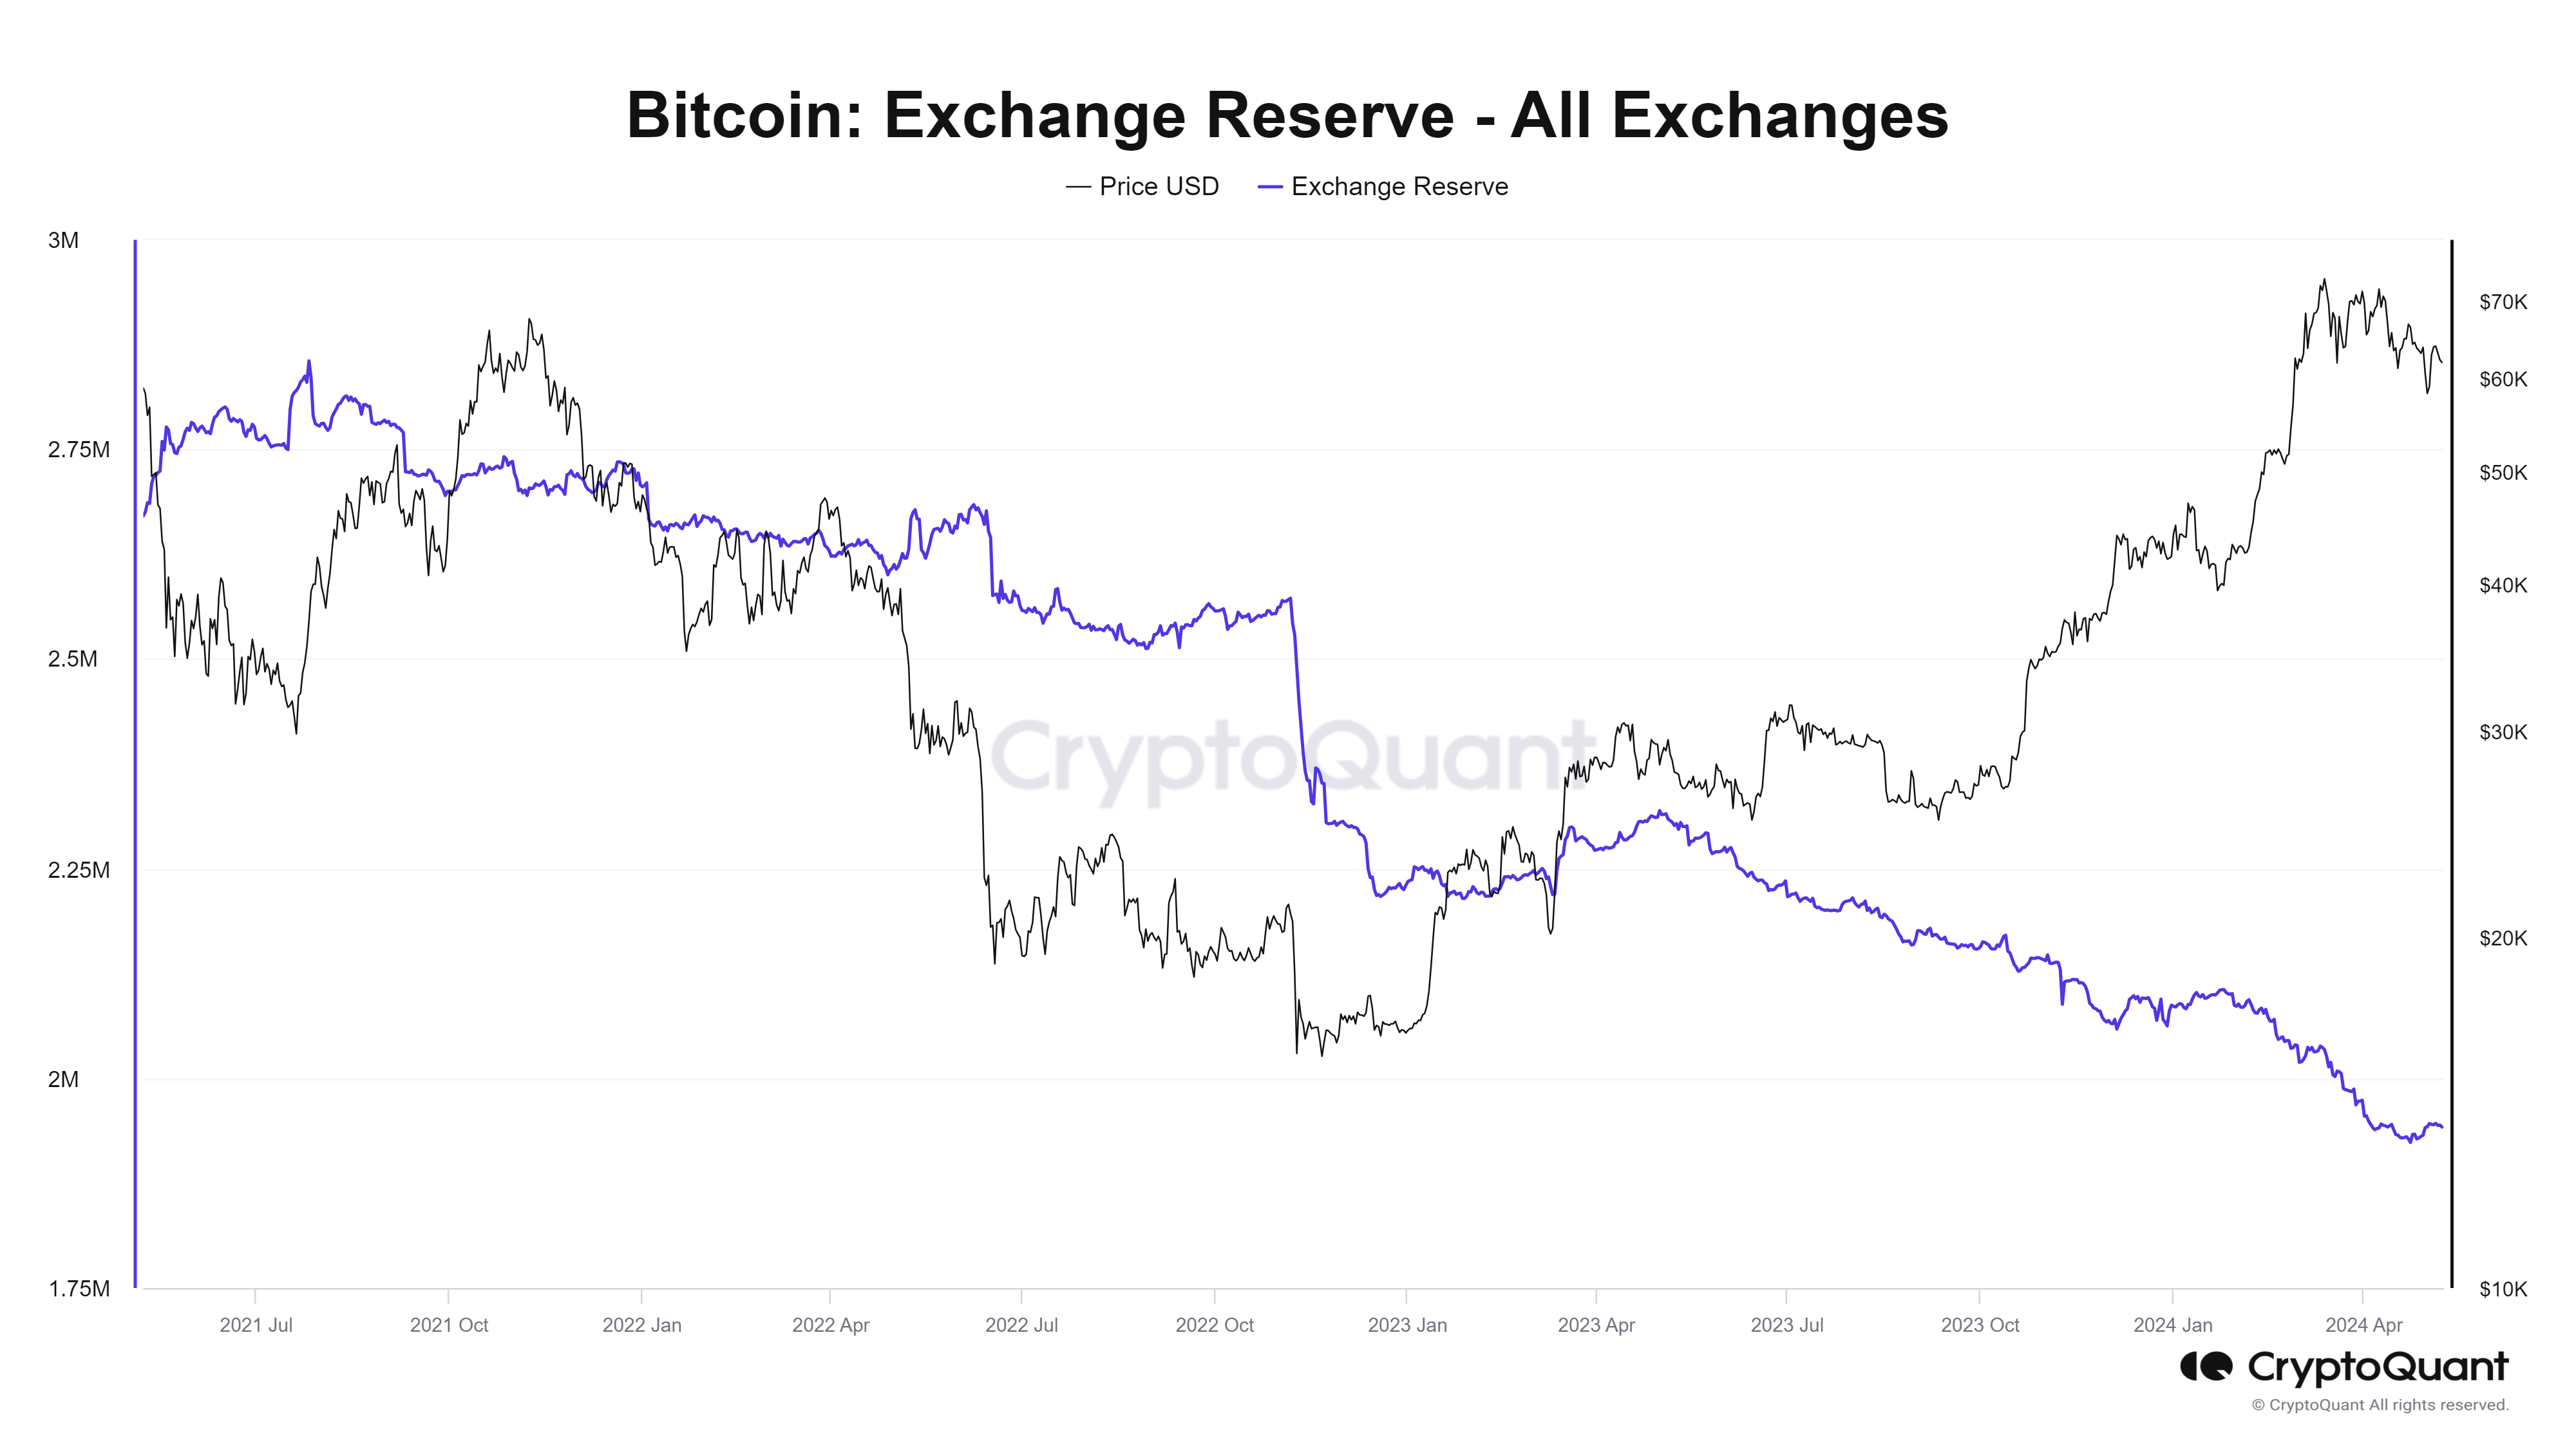
Exchange Reserve Drops
Bitcoin Exchange Reserve remains on the rise over the last seven days. Although not significant, the slight increase in trading platforms’ holding of the asset suggests mild selling pressure. Nonetheless, the coin has seen a slight decrease in such bags in the last 24 hours. This represents the bull’s attempt at buyback as the downtrend nears its third day.

The exchange netflow is gradually decreasing, which suggests that the bulls are edging, which may translate to an upheaval in price.
However, in opposition to the bullish attempts, the derivatives show huge signs of the bears’ attempt at further price declines. According to on-chain data, the market is seeing a significant increase in funding rates. However, a bulk of them are from short positions. In options, this indicates that these traders are anticipating further declines and are ready to buy at a lower price.
Aside from the trading volume, BTC is seeing a very low inflow from its largest market, the US. This could be an effect of the SEC chairperson’s statement on crypto on May 7. The global cryptocurrency market is also grappling with it as it is on a downtrend. Additionally, the apex coin is seeing massive buying pressure from Koreans.
All readings from on-chain data show a mix of both bullish and bearish action. This tussle translates to the low volatility the asset is seeing.
Bitcoin ETFs
Bitcoin ETFs are yet to halt their massive outflows. On May 7, US bitcoin ETFs resumed outflows after two days of consistent inflow. Although insignificant, data confirms that Grayscale saw an exit of 28.6 BTC, which wiped off all the inflow from the other traded funds.
Farside, a UK-based investment firm, also saw an outflow of 15.7 million.
Amidst the growing net liquidations of ETFs, Susquehanna disclosed it had an EFT portfolio. The investment firm announced it had $1.3 billion in ETFs.
Ongoing Bearish Convergence
As bitcoin continues to hover around $62k, there are vital signs of a breakout. The moving average convergence divergence suggests that the asset may see more corrections. The 12-day EMA has halted its ascent since the start of the week in response to the consistent price decline. However, the trend remained essentially flat through the previous intraday session, and it’s the same today.

The parallel is a result of the asset’s reduced volatility. The relative strength index also shares the same trend. It retraced from 50 to 45 during the previous session. Since the day started, it has held on to the said level.
Nonetheless, the apex coin is trading below the 50-day EMA, which gives the bears an advantage. This comes after it failed to flip it decisively. The current day’s low suggests that the coin is heading for the 100-day EMA.
Once the bears decisively flip $62k, this will mean a retest of the $60k psychological barrier. It will also attempt the 61% Fibonacci retracement level. Previous price movements suggest significant demand concentrations at the mark.
While the bills will try to defend the highlighted mark, there is a chance BTC will briefly lose it. If that happens, the apex coin will become range-bound between $6ok and $59k.
