
BNB retraced to its lowest since the week started, but rebounded and prints a green candle at the time of writing. Closing at the current price would end its two-day decline.
The 1-day chart shows that the asset has been rangebound since Thursday and has not broken the trend amid slight selling pressure. The slight increase on Wednesday revived hopes of a breakout in the coming days.
Several indicators on different timeframes suggest the hike may start in the next 24 hours. On the 4-hour chart, the asset prints tiny green candles as it slowly climbs. The upward momentum appears strong, indicating that the buyers are sustaining the ongoing uptick.
The chart reveals that the earlier may be the start of an uptrend that may last the next three days. BNB tested bollinger’s lower band and pulledback shortly after. The asset adhered to the indicator’s principle and may surge higher, testing the upper band.
However, the bollinger bands on the short-term timeframe suggest that the altcoin may experience intense selling pressure at $870, hinting at a repeat of Monday’s price action. Nonetheless, the 1-day chart suggests a higher price target.
$920 in View for BNB
Readings on the 4-hour align with those on the 1-day chart, as BNB also edged closer to bollinger’s lower band on the longer timeframe. The rebound may signal further recovery ahead, which will see the asset break its current rangebound movement.
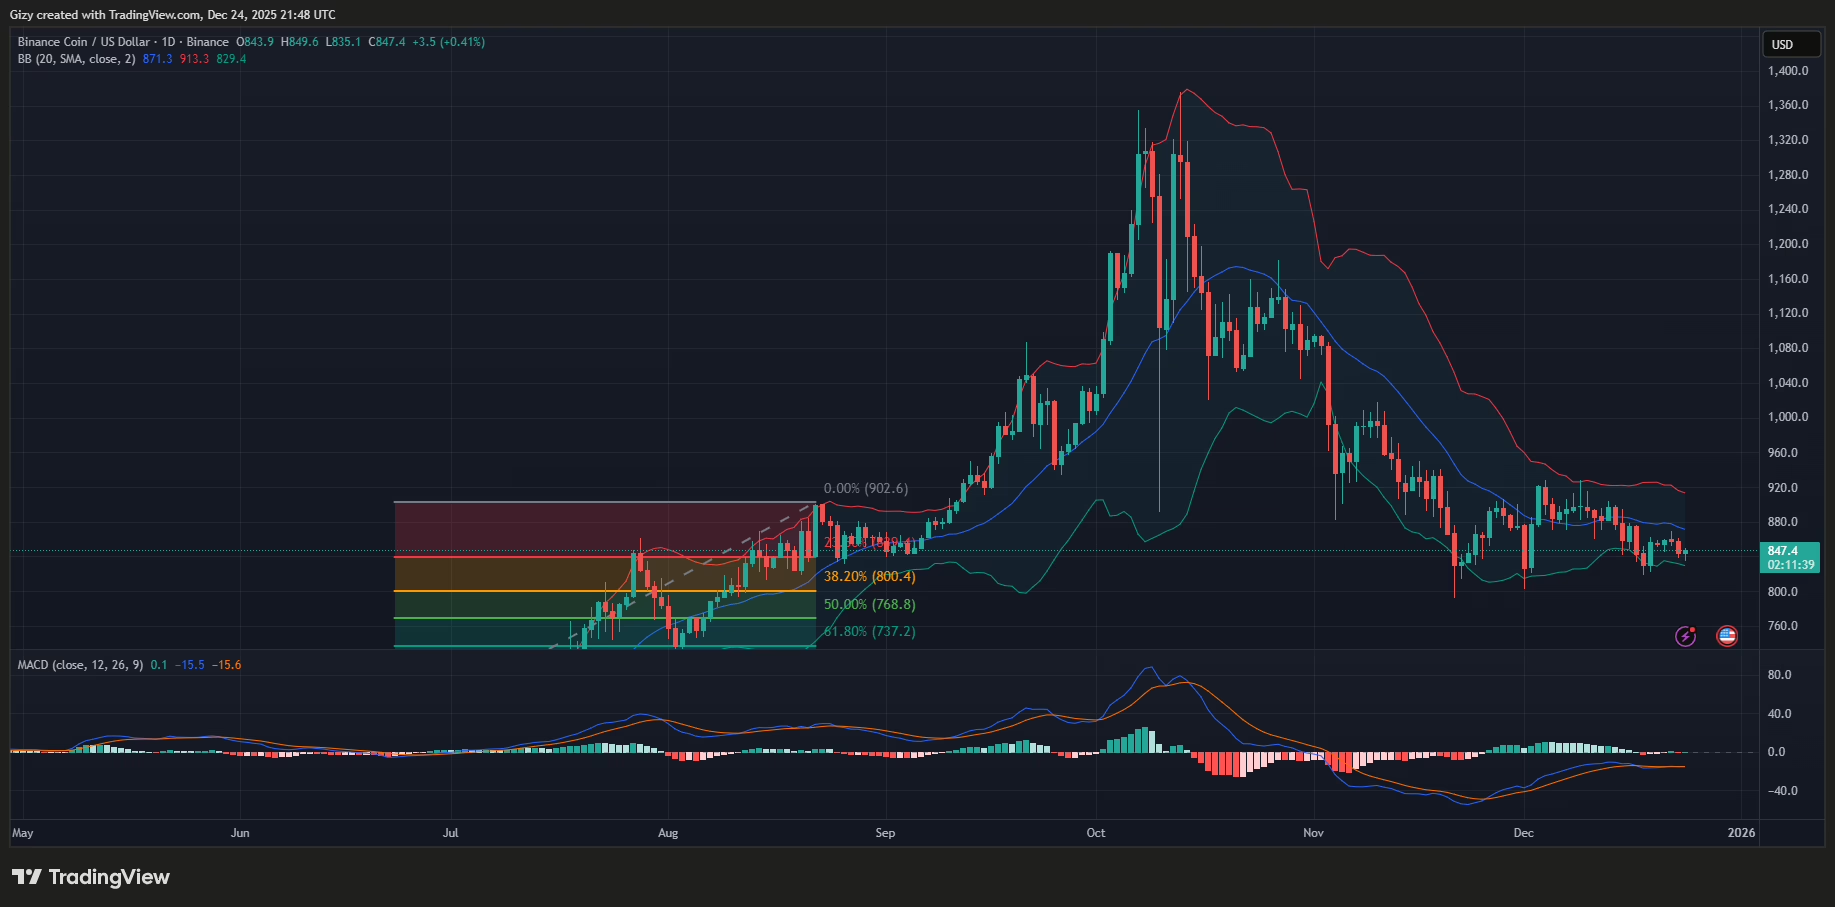
Based on the BB, the altcoin will flip the $870 mark and continue its upward trajectory. As it stands, BNB’s next price target will be the upper band at $913. However, previous price action suggests a high likelihood of breaking out of the band and attempting $920.
While the bollinger band prints green signals, the moving average convergence divergence is currently neutral. A closer look at the metric reveals that the 12 and 26 EMAs have trended in close proximity, and there has been no clear signal about price action.
Adding to the conviction of a further uptrend, options expiration is coming. Most of the cryptocurrencies offered in this derivative market are trading below their market price. Price often edges closer to the pain point before the options termination. The crypto market, including BNB, will also surge in response.
As the altcoin experiences an uptick, volume may also trickle into its ecosystem, and PancakeSwap will capture most of the volume, pushing its price up.
CAKE Set for Breakout
The 1-day chart shows that CAKE has been rangebound since last Thursday. It maintained trading above $1.78, but has since strugged to break above the $1.89 barrier.
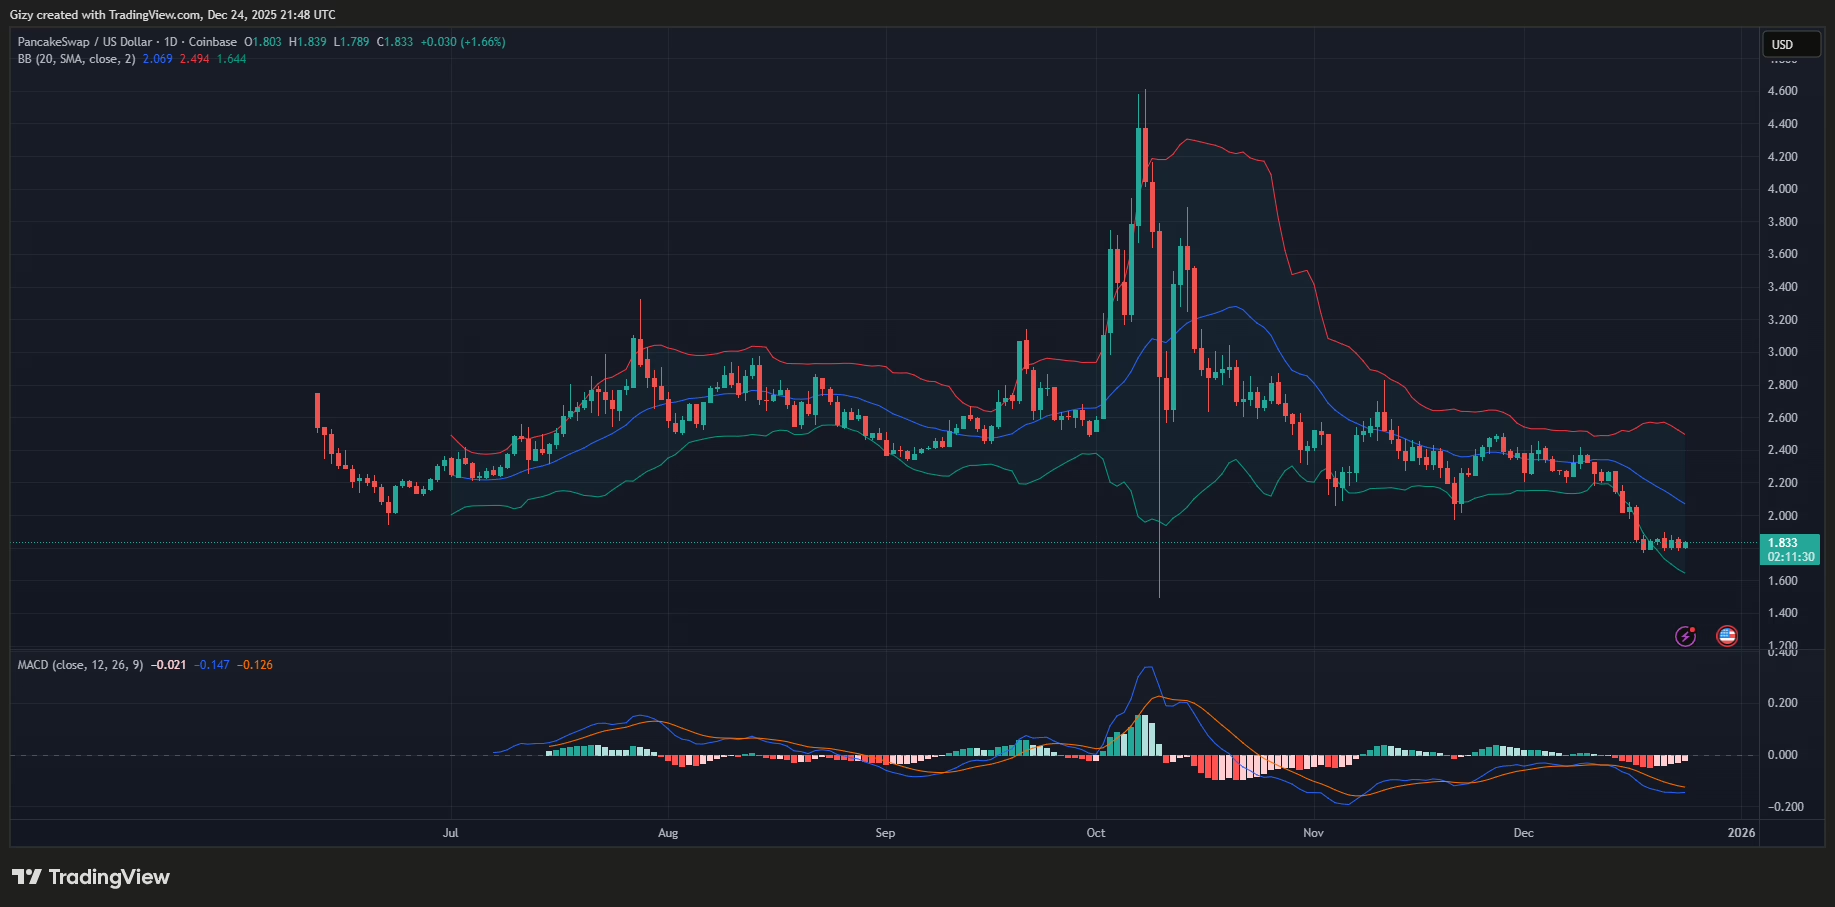
The trend over the last seven days indicates that a breakout is imminent. Based on current data, it may take place within the next 48 hours. In the event of such taking place, the asset will break above $2 . Flipping the mark will see it break and reclaim the critical support, setting up a push at $2.20.
The moving average convergence divergence shows an increased chance of a breakout. It is experiencing a bullish convergence amid the range-bound movement. A crossover on this indicator could seal further recovery, indicating that the bulls are back in control.