
Bitcoin is picking up momentum and returning to levels it lost last month. At the time of writing, it is experiencing notable upside.
The uptick is due to a momentum build-up it had a few days ago. However, fundamentals played a huge role in the most recent trend.
The most significant of the news that made the rounds at the time was Republican Presidential candidate Donald Trump surviving an assassination attempt. Due to his stance on crypto, the space celebrated with several assets printing green candles.
The event also increased the rating and probability of the candidate winning the upcoming November elections. Since the event took place, the crypto market has seen significant positive changes in trajectory, and the apex coin is on the frontline.
It is also worth noting that a notable fuel to the downtrend ran out of gas. Germany ran out of BTC last week, halting the massive dump the market saw.
Bitcoin On-chain Data is Mixed
In response, on-chain data are also positive. For example, exchange reserves are gradually decreasing, which is good for the cryptocurrency. This phenomenon indicates a notable decrease in selling pressure. However, the NetFlow, which is the difference between the assets coming into exchanges and the outflow is negative.
While the netflow may not look threatening, it may indicate an impending downtrend. The metric’s negative value means more traders are moving their assets from cold storage to exchanges and gearing up to sell. Nonetheless, reserves reduced by over 2% in the last seven days.
The net unrealized profit and loss is also printing bearish signals at the time of writing. Almost 70% of Bitcoin holders are in profit at this time. Coupled with the exchange netflows, it may indicate an impending retracement.
Amidst the readings from both metrics, the data from Coinbase premium indicates a possible continuation of the uptrend. It has significantly improved over the last 24 hours, so US traders are getting more bullish and accumulating.
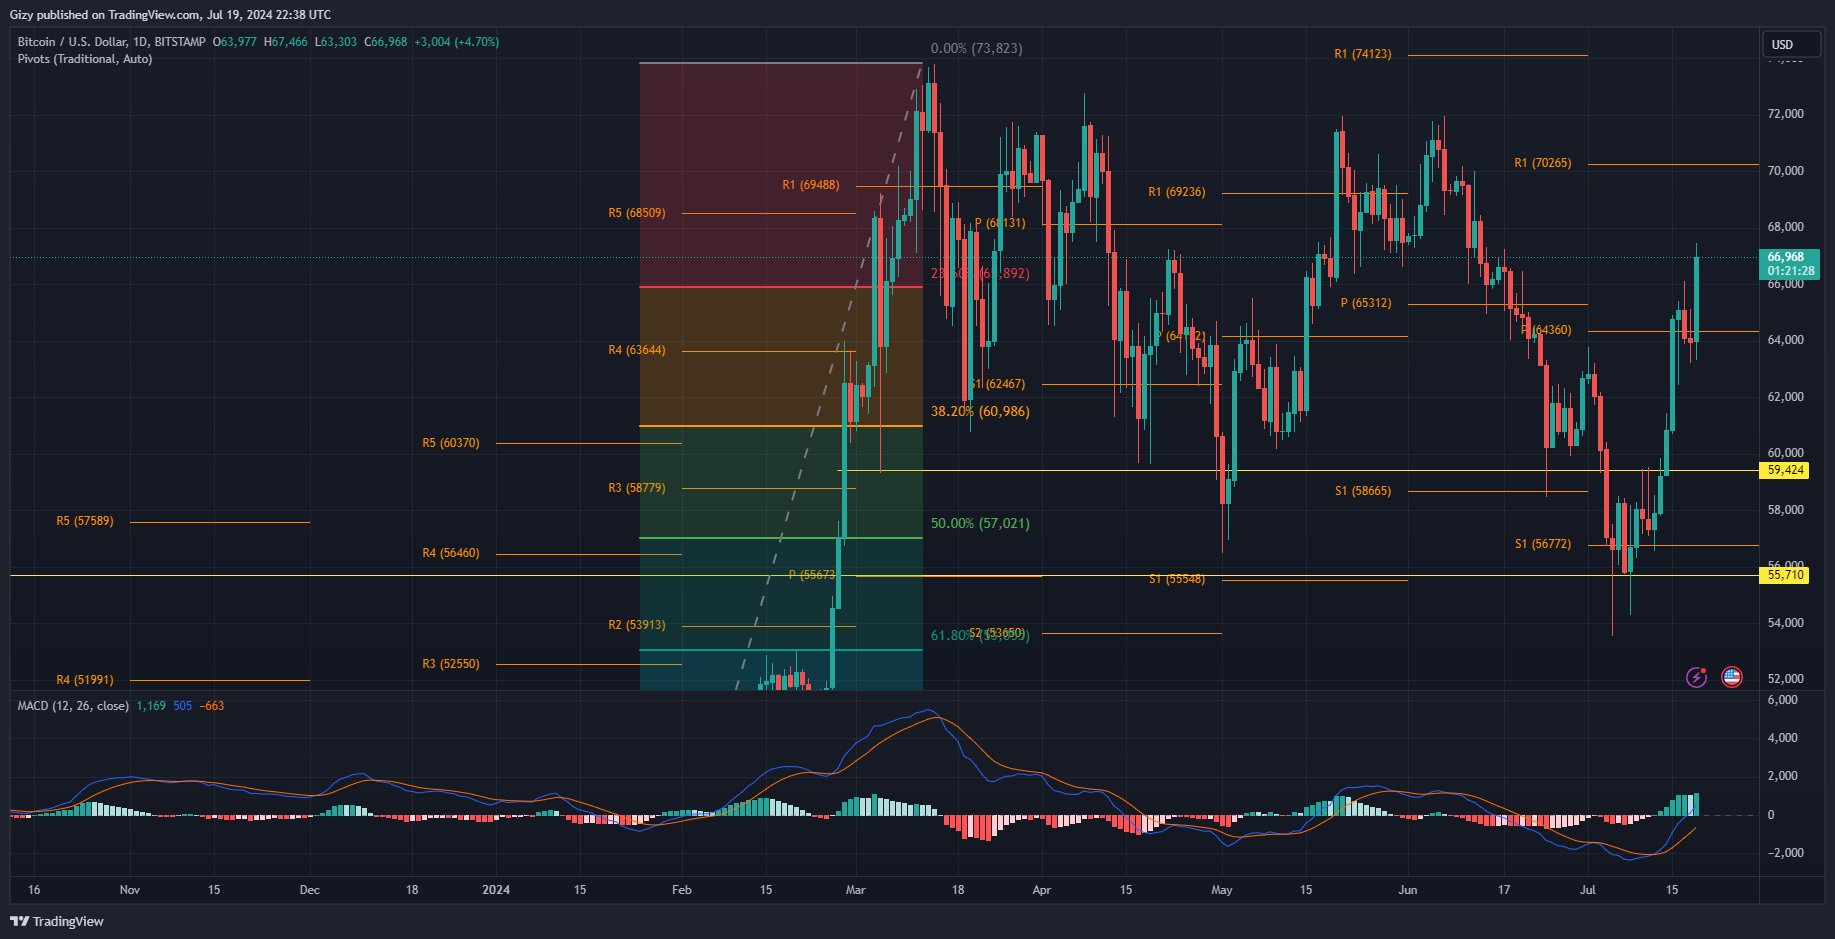
Data from Coinglass shows that more traders are looking to buy more BTC between $66k and $67k, which explains the growing stability of this price range.
RSI Edges to 70
The relative strength index is seeing a significant boost from the most recent price trend. It has been on the rise, indicating a massive increase in buying volume. However, it is a blaring warning and pointing at the need for correction.
The metric is at 66, which is 4 points shy of 70. A breakout above 70 will mean the asset is overbought and due for massive corrections. It will also mean a break from the coin’s most recent uptrend.
The moving average convergence divergence is still printing buy signals amidst RSI readings. Both EMAs are showing no signs of retracing or halting the uptrend. It is also worth noting that the metric leaves the ‘bearish area’ as the 12-day EMA surged above 0.
If the current uptrend continues, the relative strength index may rise above 70 within the next 48 hours. This prediction is based on the metric’s rapid increase over the past 48 hours, during which it gained over 5 points.
RSI suggests a potential downtrend if the uptrend persists, as the asset will become overbought once the metric surpasses 70. Furthermore, the sharp price increase indicates a likely correction ahead.
Nonetheless, it also indicates room for more price climbs. After gaining stability above $67k, the coin will reclaim $68k. The chance of the asset flipping these critical levels is high as more buy orders are concentrated around this mark.
Bitcoin always attempts 70k after reclaiming this level. Hence, the bulls will exert more pressure. A decisive flip of the highlighted may guarantee a return to $70,000 as the buyers will push for more gains.
