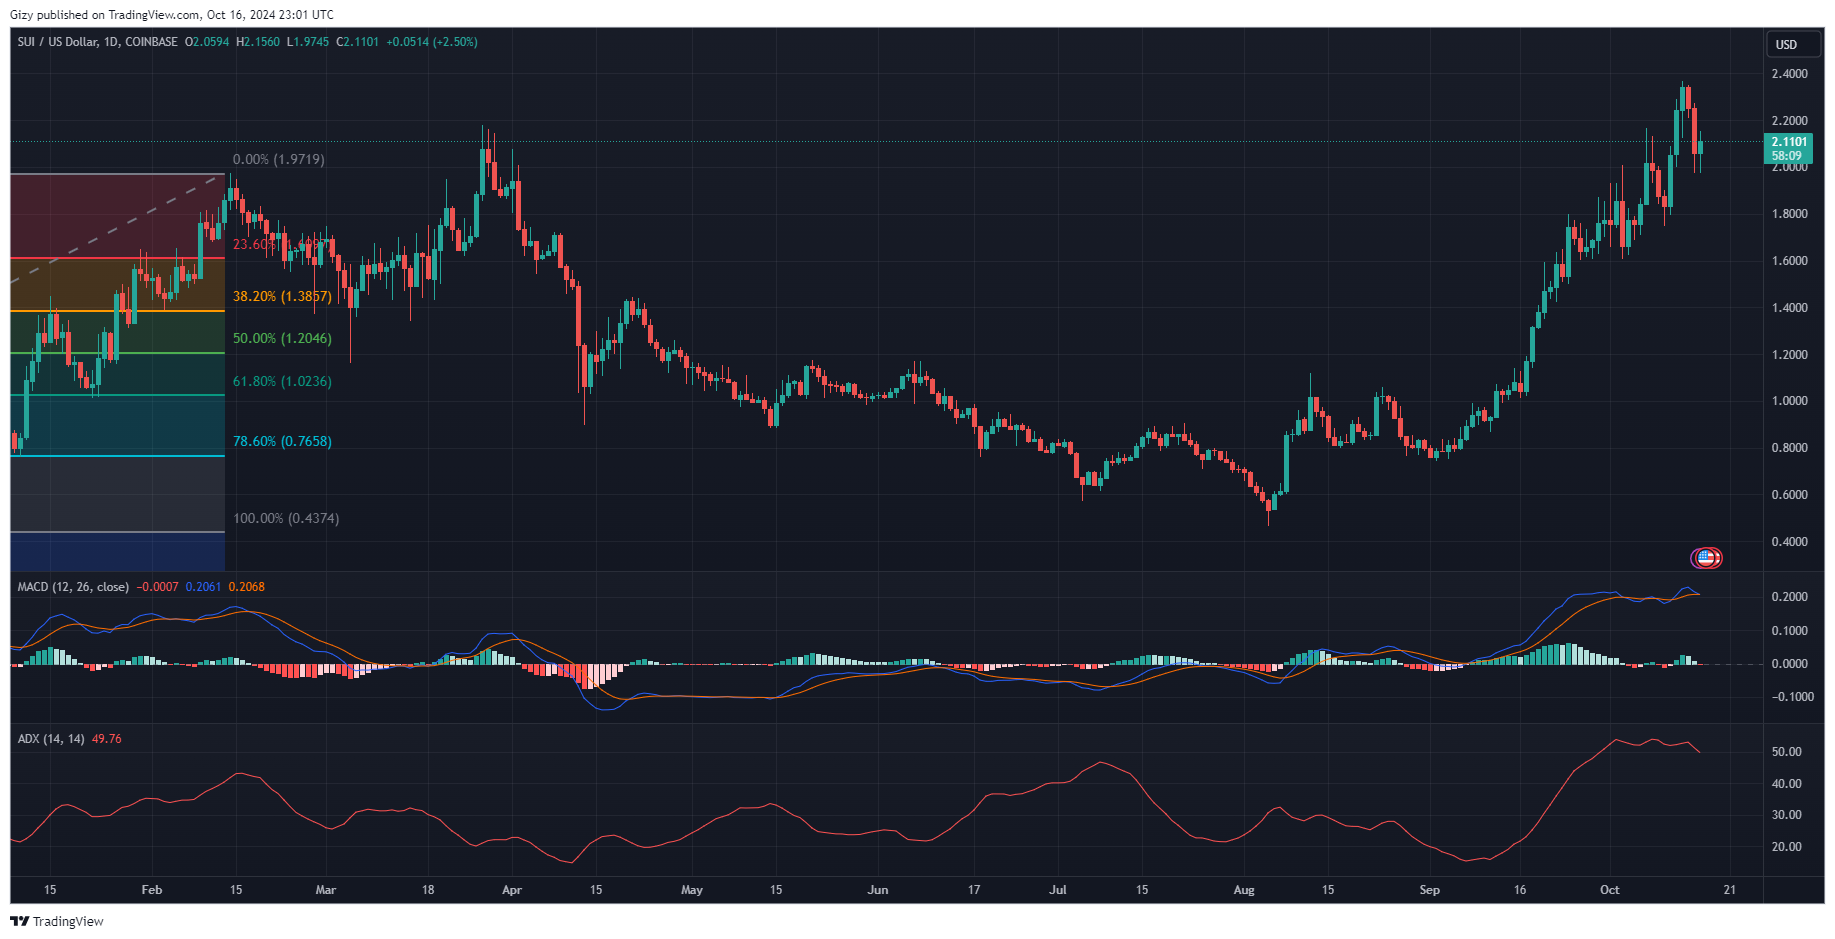
SUI started October 15 at $2.25 and started with hopes of an uptrend but failed to continue. It experienced massive selloffs that caused significant price movement. The token broke the $2 support and continued downwards, rebounding at $1.97.
The token had another notable decline below $2. Nonetheless, it rebounded and resumed its uptrend. Currently at $2.12, the altcoin is up by over 3%. Its first green candle may carry a glimmer of hope amidst growing price uncertainty.
Traders are Losing Confidence in SUI
One reason for the growing price uncertainty is some news that made the rounds. A few days ago, an on-chain analyst declared that a whale sold over $400 million tokens and hinted at the Sui Foundation’s involvement in the sale, claiming it was an insider trade.
The token’s price took a small plunge as the news spread. However, the firm broke the silence, issuing a stern statement that it had nothing to do with the sale, nor did its employees or any affiliated members.
Price actions during the previous week indicate that confidence has significantly reduced—nonetheless, price actions over the last 24 hours indicate a change in this sentiment.
Aside from the previous market sentiment, the chart shows the reason for the massive declines. The first is due to the relative strength index. The metric climbs in relation to buying pressure that pushes prices. It recently broke above 70 and continued upwards, hitting a high of 75.
Breaking above 70 meant that the asset was overbought and due for corrections. Over the last two days, the ensuing declines were the healthy downtrend it needed. RSI is at 61 at the time of writing.
The Bollinger bands point to another reason for the decline. SUI slightly surged above the upper band but retraced below it. However, the surge continued the next day as it broke above it the next day. The token peaked at $2.24 on Sunday, above the upper SMA at $2.22.
Any asset trading out of the Bollinger band is due for a trend reversal. Since they were trading above it, cryptocurrencies were due for corrections. Although back within the upper and middle SMAs, other indicators point to further declines.
MACD’s Divergence
The moving average convergence divergence is printing a sell signal amidst the current price increase. Surprisingly, the RSI shows room for more price climbs amidst this reading. A closer look at the chart shows that the 12-day EMA halted its uptrend since the price declines started. It started a downhill movement and edged closer to intercepting the 26-day EMA.

Both EMAs are close to concluding the bearish convergence, and a divergence is imminent. The impending interceptions are not bullish for the token; they hint at further price declines.
The average direction index is also printing sell signals at the time of writing. Although a lagging indicator, the metric is declining as the strength behind the previous price surge is absent. This may mean that the most recent increase may be short-term.
Nonetheless, the accumulation and distribution chart shows that the bulls are gradually soaking the excess supply. The asset may resume its uptrend if the trend continues.
In the Coming Days
With major indicators leaning towards further decline, such is almost inevitable. The cryptocurrency may decline further, hitting critical barriers.
The Fibonacci retracement level highlights several key levels to watch. One such is the $2 support. Having lost this critical level twice this week, it’s fragile, and the altcoin will slip below it again. However, the most recent price shows a significant demand concentration at $1.97. Further slips may send prices as low as 38% support.
Nonetheless, the bulls may attempt to sustain the ongoing bullish push. They may push it to $2.20.
