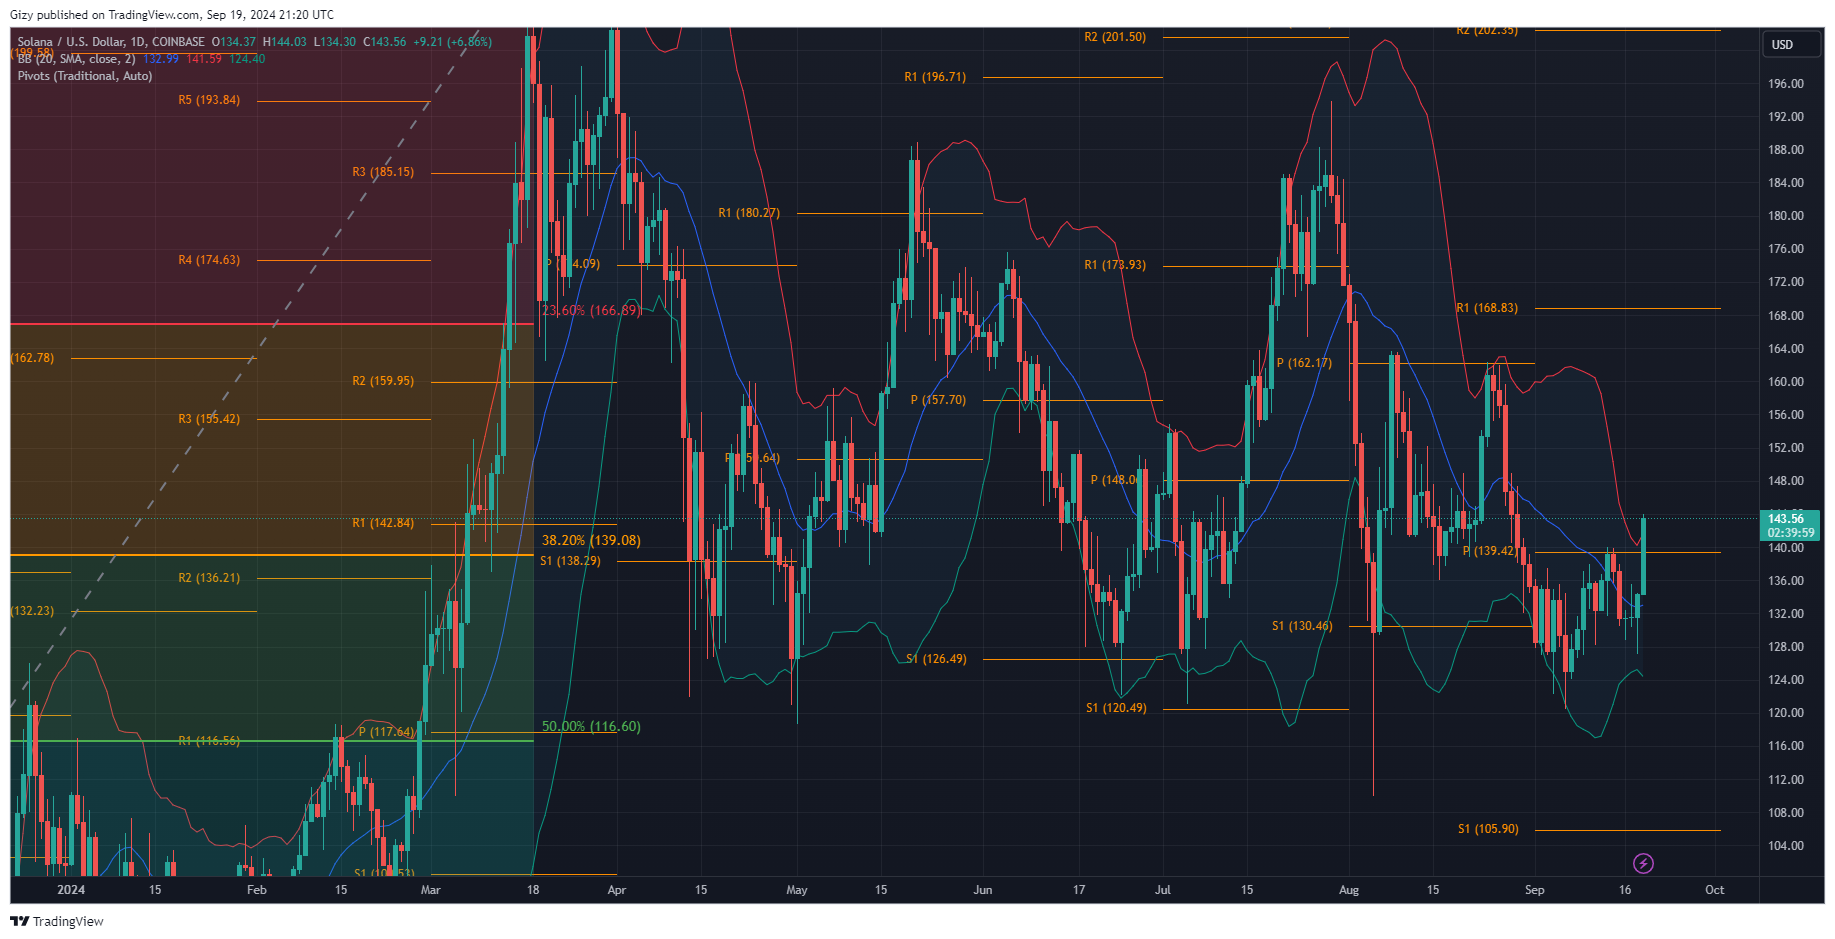
Solana is trading at $143 after starting the day at $134. It is over 10% higher than its opening price, signifying the continuation of the uptrend.
The asset saw small losses as the market braced for the uncertainties that may plague after the FOMC meeting. SOL retraced to below $130 but rebounded at $127. Nonetheless, it resumed its uptrend and closed the day with gains exceeding 2%.
The two-day surge has received little reaction from traders, as most are skeptical about how prices may play out from now on.
It is worth noting that altcoin is trading close to its fourteen-day high. After several attempts, it failed to surge above this critical level. Many blamed the drop in network activity for the latest failure, as the asset’s use case dropped over the last three months.
Transactions on the network also significantly reduced, causing a notable price decline. With the launch of memecoins in the ecosystem, fewer developers and traders are interacting with them. All these factors looked plausible. However, the situation may change for the asset.
Post-FOMC May Be Bullish
The FOMC ended on September 18 with several vital highlights. One of the biggest is the announcement of the interest rate cut. The regulators unanimously agreed to cut rates by 50 points, while others maintained a lesser slash.
Nonetheless, Arthur Hayes is skeptical about the latest cut. He believes it is politically motivated and that a decline is almost inevitable. Nevertheless, Jerome Powell anticipated such rhetoric and replied that he saw no signs of such unfolding as the economy looked strong and the labor market was as it should be.
The latest rate cut may be positive for the entire crypto market. Solana may resume its uptrend, flipping several resistances. The announcement of the latest web3 phone may also increase confidence in the ecosystem and improve network activity following the launch.
Solona Breakouts From Bollinger
Solana recently broke above its fourteen-day high. It is seeing massive buying pressure post-FOMC and recently broke out of a trend.

The Bollinger band shows that the asset broke out of the bands. It is trading at $143, which is above the upper bar. The breakout has received minimal reaction from proponents. However, the surge was a short squeeze as the market, the highlighted metric, was tightening. The upper and lower SMAs are widening in reaction to the latest move.
Nonetheless, other indicators are still bullish. The moving average convergence divergence shows that the uptrend may continue longer as it prints buy signals. The 12-day EMA is edging close to its highest in over one month.
Solana’s surge is volume-motivated, as trading volume increased by over 31%. The relative strength index suggests that most of the new volume was buying action, as it surged to 56 from 47 during the previous intraday session. The RSI also shows that there is room for more price increases, as it is far from 70.
The average direction index is a bit bearish amidst the surge. Although a lagging indicator, it is yet to show signs that the unfolding price movement may be long-term. It is on the decline, indicating that the price increase may phase out soon as the strength behind the momentum is not strong.
The Fibonacci retracement suggests two levels to watch. After regaining control above the 38% level, it will look to reclaim the 23% Fib mark at $166. The pivot point standard also expresses this possibility. Since reclaiming its pivot point at $139, the asset will look to retest the first pivot resistance at $168.
Both metrics point to the asset breaking above $160 after flipping $140. Nonetheless, the previous price movement suggests significant selling congestion at $148. If the uptrend continues, the price may halt for a bit around this mark
It is also important for the altcoin to maintain trading above $140 as a slip may reignite risks of a slip below $130
