Solana prints another red candle as it succumbs to a significant change in trajectory. However, it holds steady above $190.
The altcoin opened Sunday at $195 but now trades down by 2%. Its recovery, which started on Saturday, ended abruptly. Solana surged from $183 to $195 during the previous intraday session, gaining over 6%.
Solana experiences the same sentiment as the rest of the crypto market. Several assets are significantly down. However, the downtrend had almost no impact on several aspects of its ecosystem. One such is the total locked value. The TVL increased from 44.8 million SOL on Friday to 46.2 million SOL on Saturday.
User’s interaction with the chain remains almost the same as it maintains almost an equal amount of transactions in the last 24 hours. However, some investors are withdrawing from the ecosystem. Outflows exceed 5.62 million SOL at the time of writing.
A Bearish Divergence
The moving average convergence divergence on the one-week charts reveals the reason for the downtrend. Three weeks ago, following its first massive declines, the SOL/USD pair started a bearish convergence. Prices sank lower as the 12-week EMA continued its descent. The metric is on the verge of a bearish divergence, as the 12-week EMA is in the 26-week EMA.

An interception between the two metrics may result in further price declines. Nonetheless, the relative strength index shows the bulls accumulating. The indicator is on the rise as the asset sees more buying pressure.
The bollinger band hints at a rebound. Solana was above the bands in the week starting Nov.25. It retraced below it as it lost momentum. It tried breaking above it during the next week but failed. The coin has since been on a downtrend.
Previous breakouts halted at the middle band. One such event happened between March and April, when the asset broke above the upper SMA and declined. It ended its downtrend at the midline. A repeat of the same event may mean that the altcoin is close to recovery, as it currently trades at the highlighted mark.
Solana Will Surge
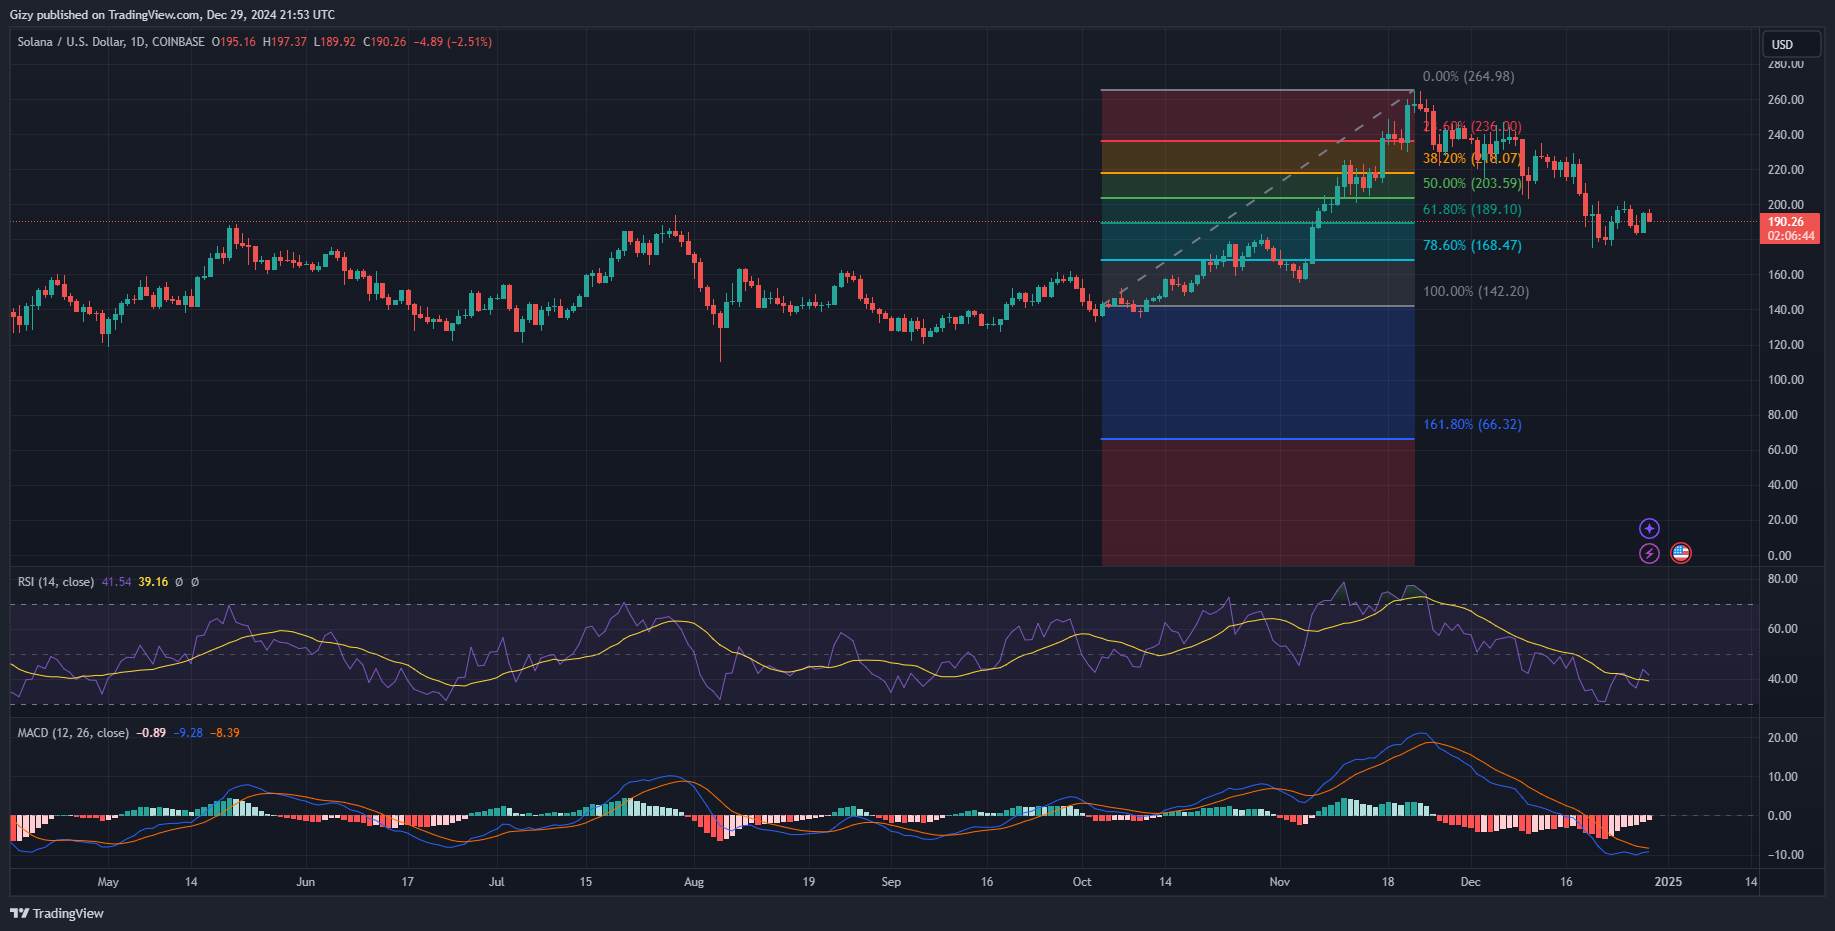
The one-day timeframe paints a bullish outcome for the cryptocurrency. MACD on this prints bullish signals. The 12-day EMA is close to intercepting the 26-day EMA in positive divergence. This may mean more price increases for the asset.

RSI showed that the altcoin experienced massive selling pressure on Dec.20, resulting in its becoming almost oversold. The metric hit a low of 31. The indicator is now at 41, as selling pressure improved, translating to a notable increase in price.
The SOL/USD pair dipped below Bollinger bands’ lower SMA. An asset dipping below this mark would result in a rebound. However, due to the selling sentiment across the market, the pair is yet to recover fully. Nonetheless, it trades between the lower SMA and the middle band. It will look to break above the midline at $205.
The Fibonacci retracement levels show that the altcoin is trading above a critical barrier. Above the 61% level, it will look to reclaim the 50% level at $203.
Other assets in its ecosystem will see further increases as Solana surges. Dogwifhat currently trades at $1.83. If trading conditions improve, it may surge above $2.
MOODENG received a a fresh boost from Ethereum co-founder Vitalik, who donated the token to a wildlife zoo a few days ago. Prices and volume positively reacted to the news.
