XRP recently had another attempt at its five-day high but failed as selling resumed. It received the same reaction as on Monday when it tried to break $1.95.
On the 1-day chart, XRP approaches its third straight day of gains, signaling a continuation of the recent uptrend that began Monday with a 4% increase. However, momentum has slowed as the week progresses, indicating a possible shift away from sustained upward movement.
The asset had no significant price change on Tuesday, and the trend is repeating. Aside from its failure to break the barrier, the low upward momentum over the last 48 hours suggests the bulls are becoming exhausted.
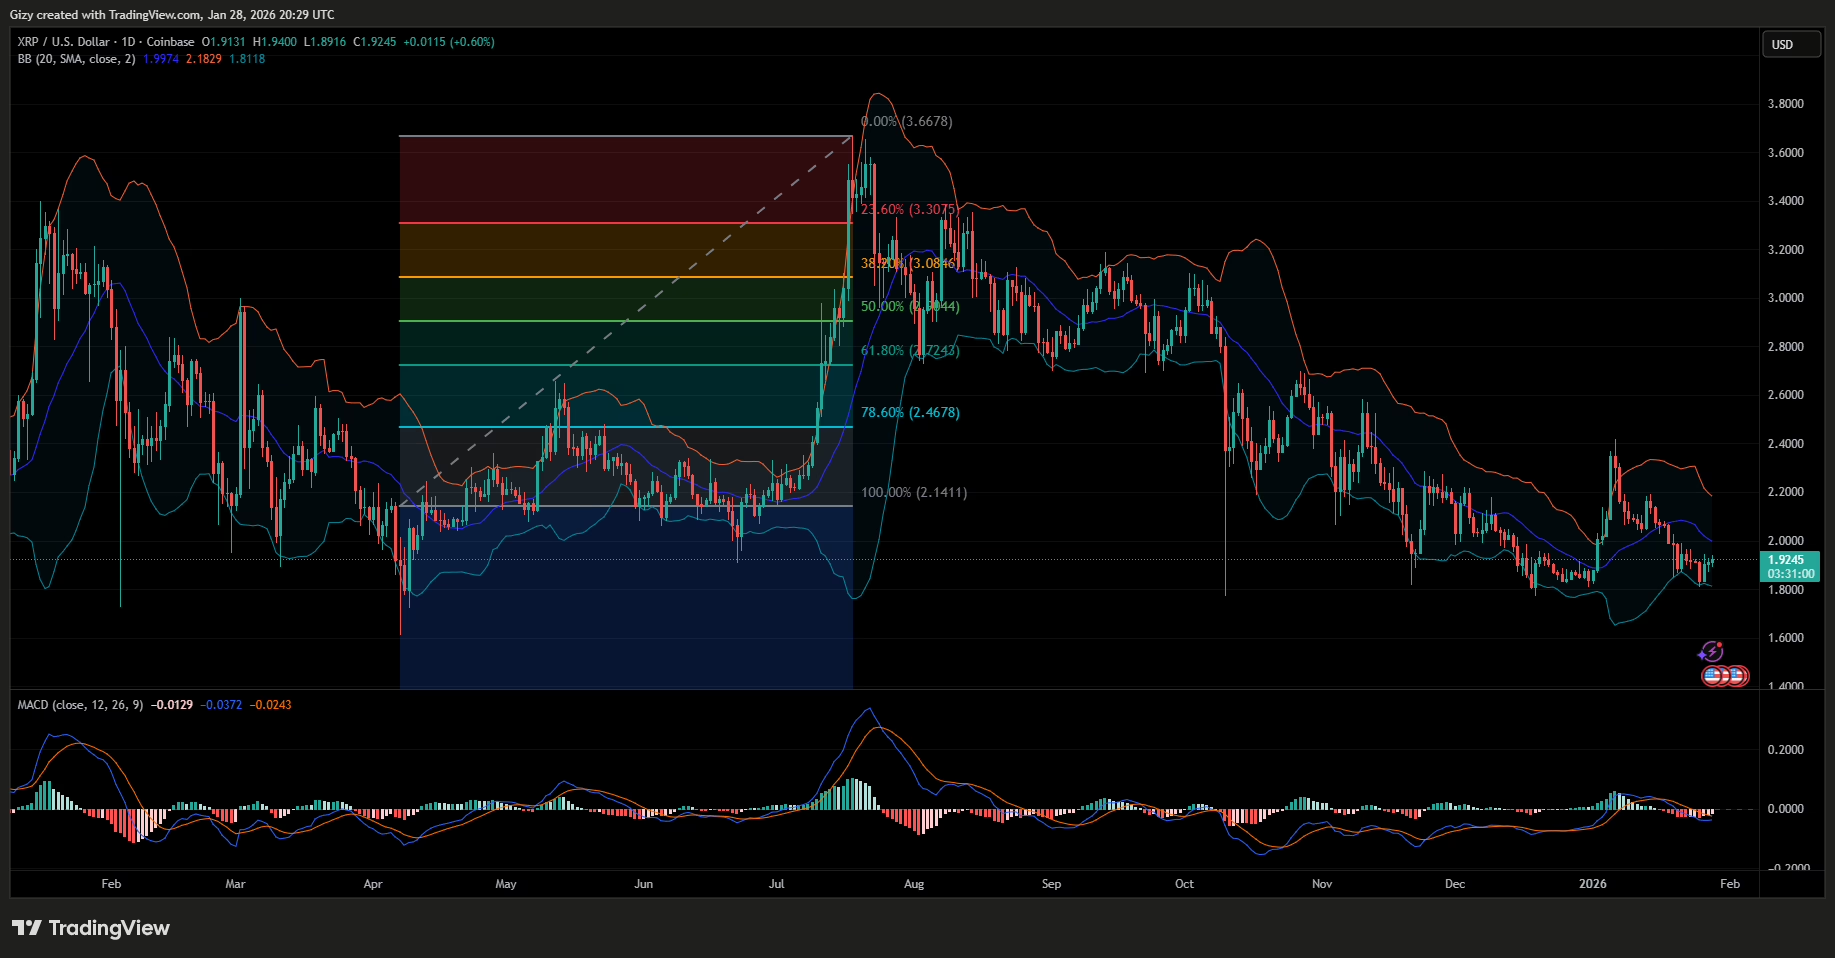
Nonetheless, indicators are currently flipping positive amid the slow climb. One is the moving average convergence. Although it is still in a downtrend, its histogram prints shorter bars as the 26-EMA approaches the 12-EMA. In essence, the asset is currently having a bullish convergence.
Aside from MACD, the bollinger band is also positive. The asset bounced off the lower band on Sunday and has been rising since then. If the trend continues, the coin may test the middle band.
In summary, it is easy to conclude that XRP will continue its uptrend based on the indicators. However, onchain data and price movement suggest otherwise.
XRP Has a Huge Liquidation Cluster
The altcoin’s second attempt at $1.95 failed as it faced rejection on its approach. Previous price movements indicate that, aside from Monday, this is not the first time the asset has failed to break the mark.
In mid-December, XRP failed to flip the level after several attempts. Following its failed trials, it plummeted over the next few days. The same trend played out last week, and a decline followed. Interestingly, the coin retraced to the same level on both occasions: $1.81.
The doji on Wednesday suggests that the latest attempt may be the last before prices decline. If the altcoin fails to flip the barrier on Thursday, a drop to $1.80 is more likely, in line with the trend.
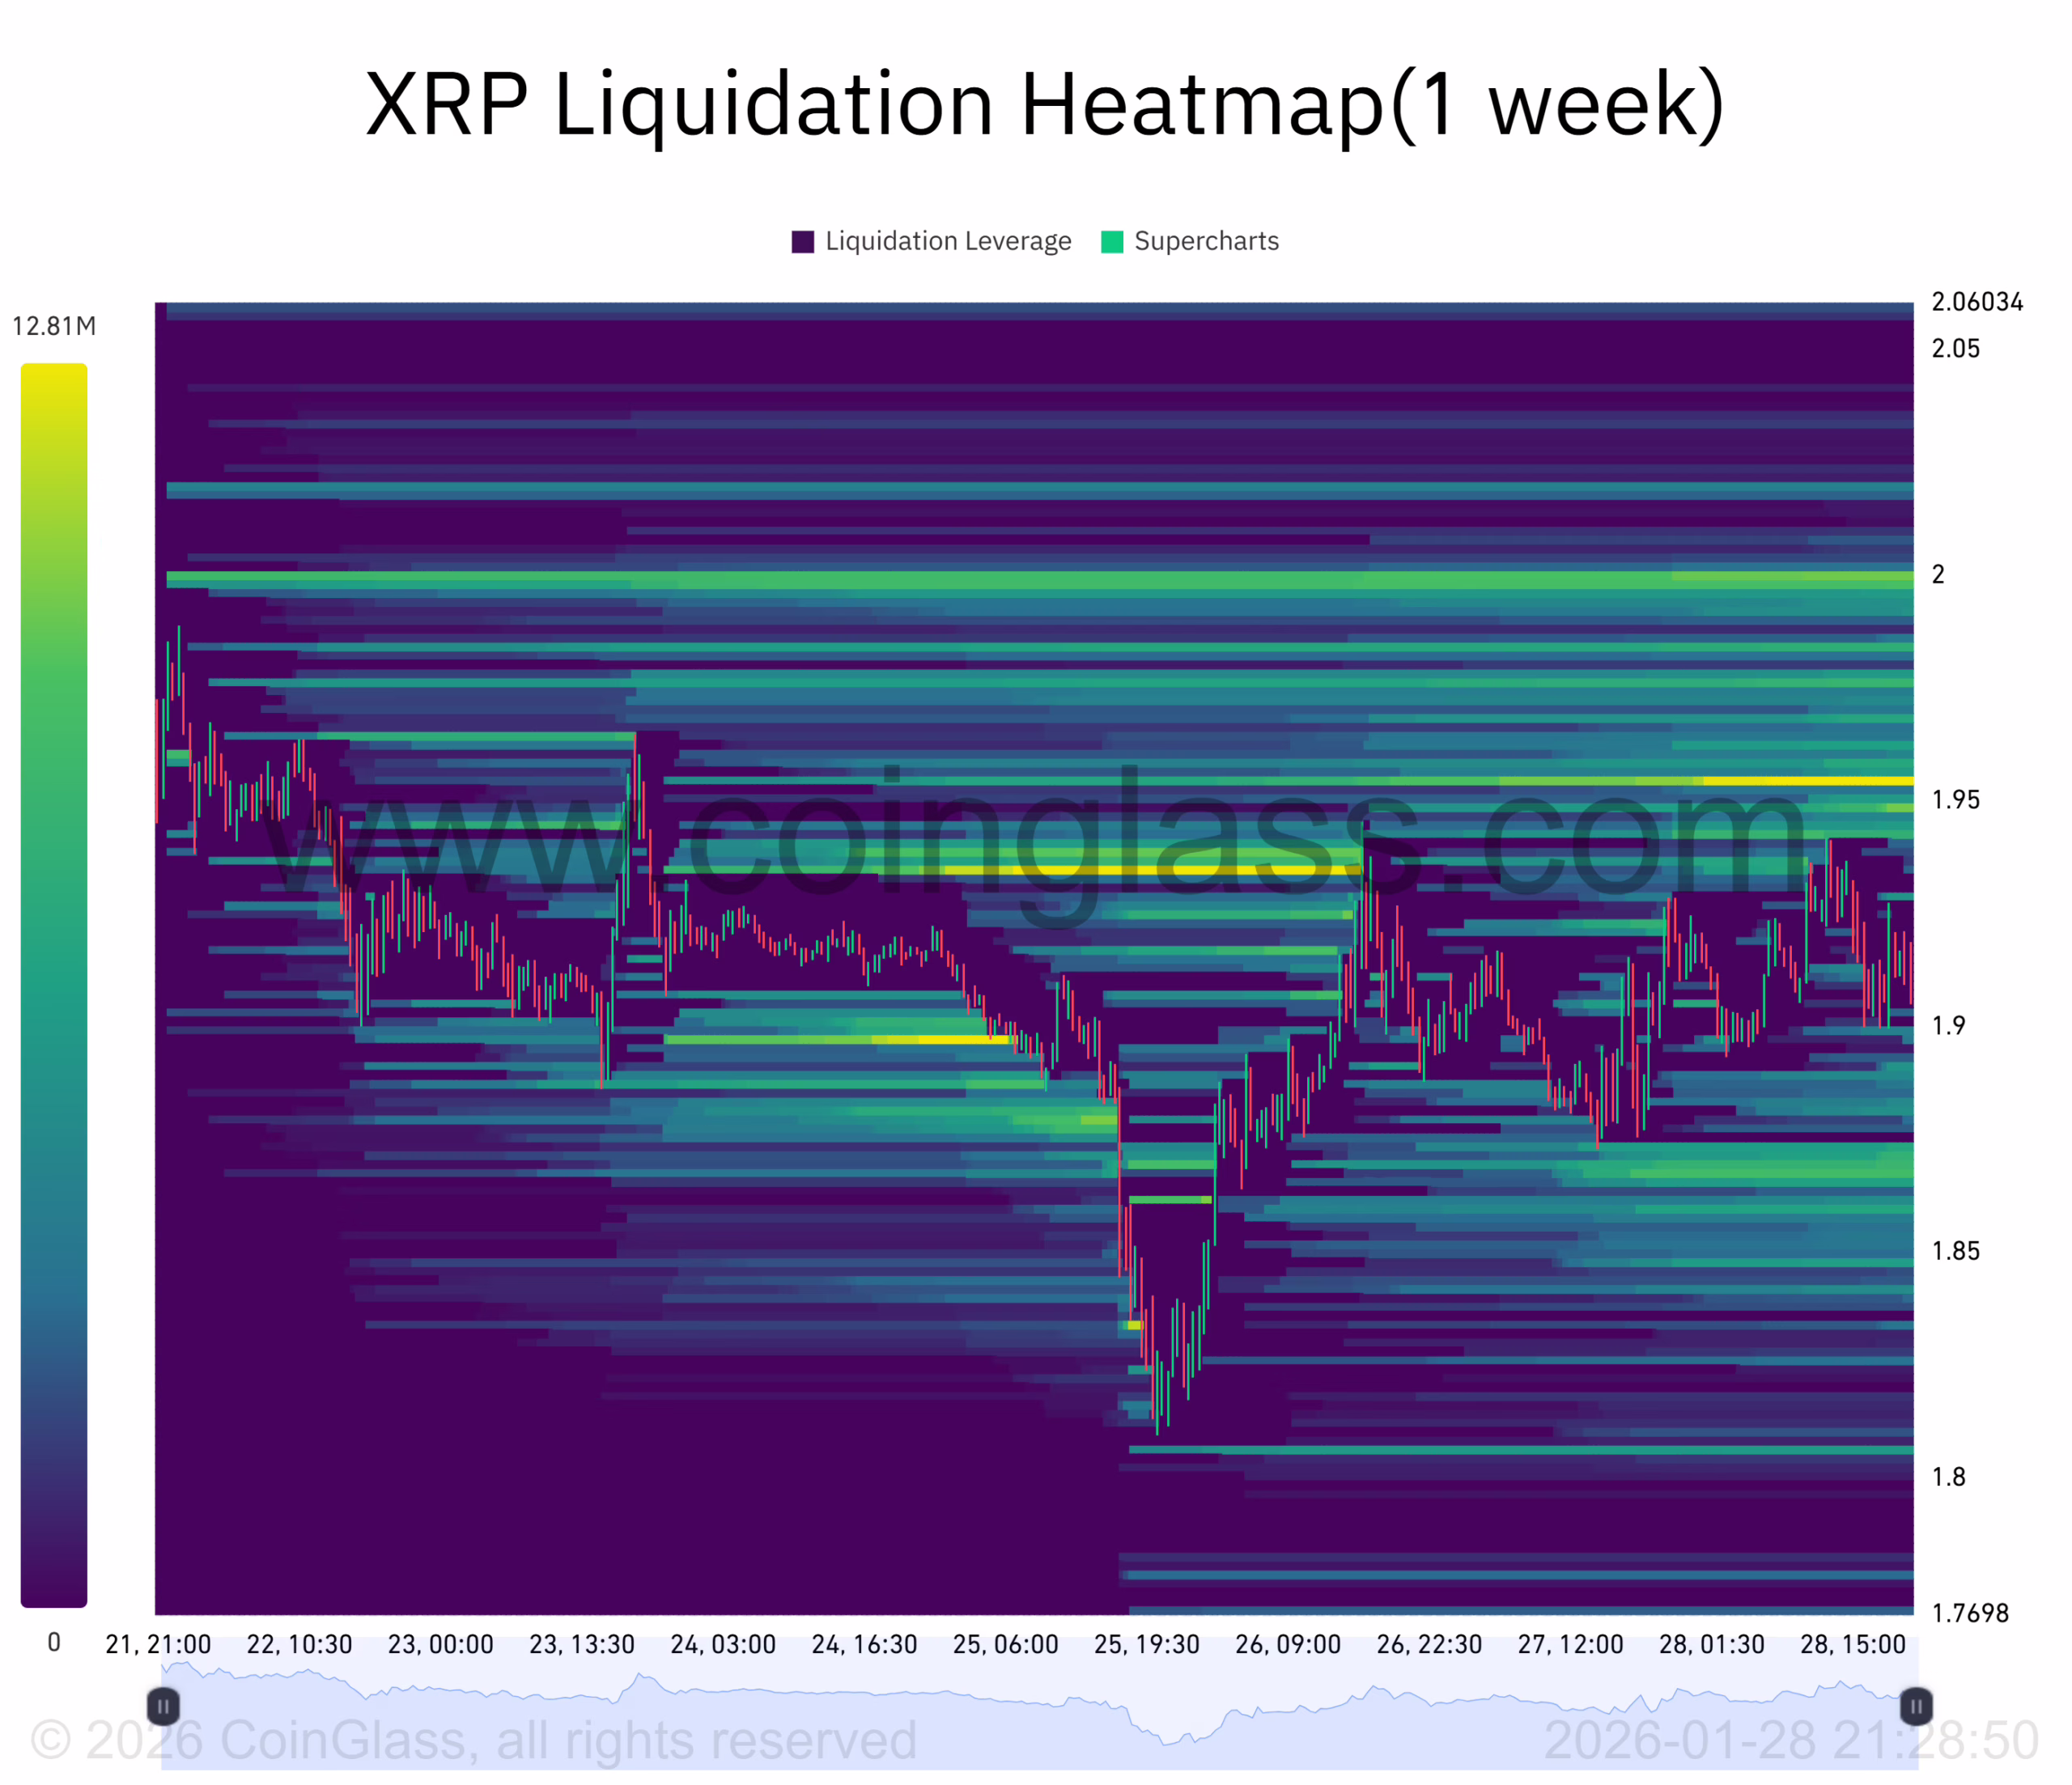
Nonetheless, the liquidation heatmap explains the failure to break the resistance. A closer look at the map shows that over the last week, traders opened several positions with liquidation at $1.95. To prevent these positions from closing, the bears are staging selling congestion. It remains to be seen how long they’ll defend the level.
In the event of a downtrend, the heatmap shows no tough levels at $1.80. Although there are sparse liquidation clusters before $1.85, they are not enough to halt a downturn if they remain the same.
However, the cost-basis distribution heatmap offers a glimmer of hope. XRP recently dipped below the mark where investors scooped over 890 million units, but surged above $1.88 on Monday, reclaiming the CB.
Cost basis is a level investors will likely defend, but the $1.88 is not densely populated. The $1.96 mark is where investors bought over 1.7 billion units. With the asset trading below it, these traders are in losses. They may stage further increases to reclaim the CB.
In a nutshell, bullish sentiment is waning, and several indicators point to a massive decline. XRP will most likely retrace to $1.80 in the coming days if market conditions remain the same.
Get Trending Crypto News as It Happens. Follow CoinTab News on X (Twitter) Now


