XRP attained a new all-time high a few days ago. It registered the milestones during the week starting July 14.
On the weekly scale, the asset opened trading at $2.83 and broke above $3. It continues upward, breaking above $3.50 and peaking at $3.66. Although the altcoin saw a slight retracement following the surge, it ended the session with gains exceeding 21%.
The 1-day chart shows a gradual progression as the asset grappled with notable selling pressure around $3.10. It failed to break above the level after several attempts. However, this changed on Thursday, Jul 17.
The trigger was the signing of the CLARITY and GENIUS Act. XRP investors were especially thrilled with the development as they envisioned a more favorable condition for Ripple to grow after following the signing of what many call the “Crypto Bills.”
Brad Garlinghouse lauded the signing, saying it has the potential to place the US at the forefront of the crypto industry.
One of the main aspects of the bill is its firm stance against CBDC. The launch of Ripples stablecoin earlier this year thrilled many. Market watchers speculated that a central bank digital currency could hamper the growth of other stablecoins.
It is also worth noting that investors expect RLUSD to trigger further adoption of the XRP Ledger. Further increase in its usage will trigger the needed utilization of the XRPL, contributing to the native token’s burn mechanism. This will, in turn, reduce XRP’s supply.
Away from fundamentals, the asset is facing a cooldown, with questions about how the altcoin will perform in August raging.
XRP is at a Crossroads
The altcoin had a massive decline a few days after it registered its new ATH. On Jul 23, the asset dropped from $3.55 to a low of $3.05. It rebounded and closed with losses exceeding 10%. The one-day chart indicated that the bull tried restarting the uptrend but failed as the coin faced massive rejections at $3.20.
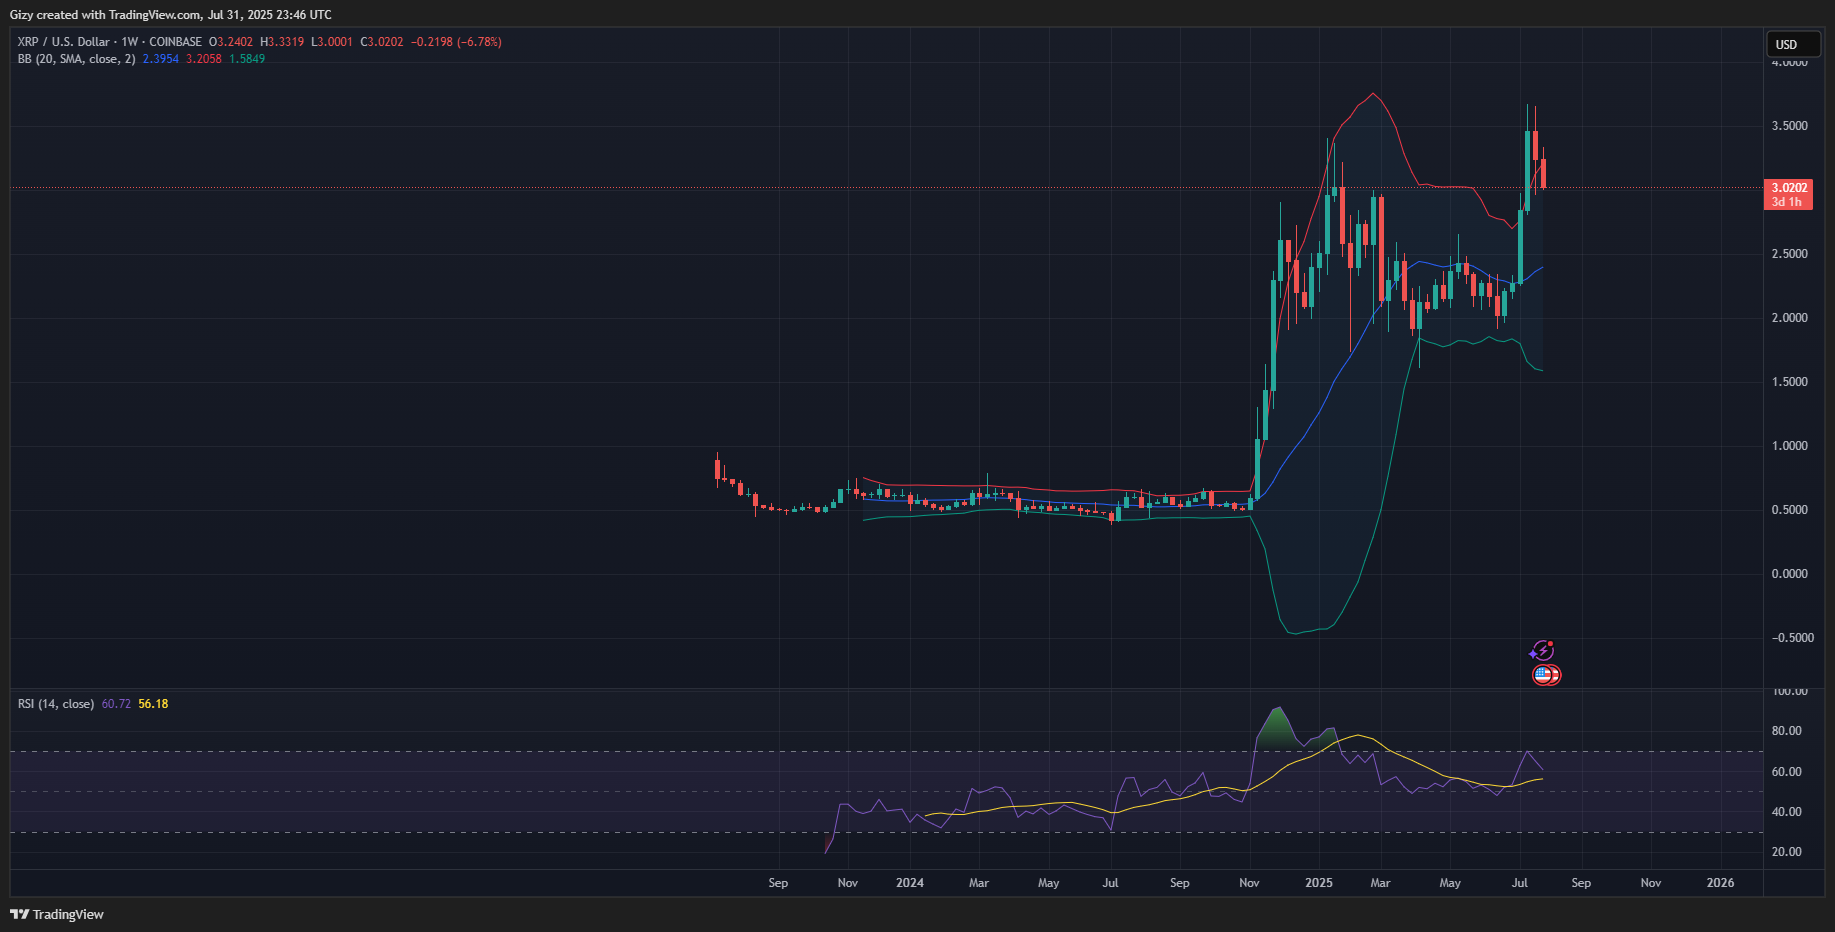
The altcoin edged closer to breaking below $3 as it experiences notable selling pressure at the time of writing. Indicators are flipping negative, suggesting that the altcoin will see further price declines in the coming days.
The bollinger bands show XRP trading below the middle band after failing to break above it. It is worth noting that the asset broke above the upper band a few days ago; its trading below the SMA may result in the coin dropping as low as the lower band.
At the time of writing, the metric is at $2.72. This may be the coin’s next price mark within the first few days of August. However, previous price movements suggest that it may rebound after testing bollinger’s lower band. The cryptocurrency will look to reclaim lost levels afterward.
Taking into account the role of fundamentals over the last thirty days, positive fundamentals may send XRP to a new all-time high. Nonetheless, failure to defend the $2.70 barrier may result in a drop below $2.50.
Solana Sees 8% Drop.
Solana is seeing massive declines this week. It opened the session at $188 and surged to a high of $195. However, it trades $172 at the time of writing. Its current price indicates that the asset is down by over 8% this week.
The 1-week chart reveals a significant change in market sentiment. SOL prints its first red candle after four greens. It is worth noting that the altcoin saw a gradual change last week. It broke above $200, peaking at $206. The candle shows that the coin saw massive retracements after registering a high.
Nonetheless, it is worth noting that the altcoin benefited from several fundamentals. News of the impending ETF approval spurred more optimism among traders. They reacted by aggressively stacking up the asset.
Additionally, Solana gained the attention of institutions over the last thirty days. One such is Bit Mining Limited. The company unveiled a strategic development to expand into the Solana ecosystem. It announced plans to raise between $200 to $300 million in part, to accumulate SOL.
Upexi joins the list of institutional adopters of the coin. The firm entered into an equity line agreement with A.G.P./Alliance Global Partners to sell up to $500 million of its stock. It plans to use the proceeds to boost its Solana treasury strategy.
SOL to See a Rocky Start to August
The 1-week chart shows that the altcoin is seeing a massive decline. It indicates that the downtrend started after the asset failed to break above the bollinger bands. It faced massive rejections after testing the upper band.
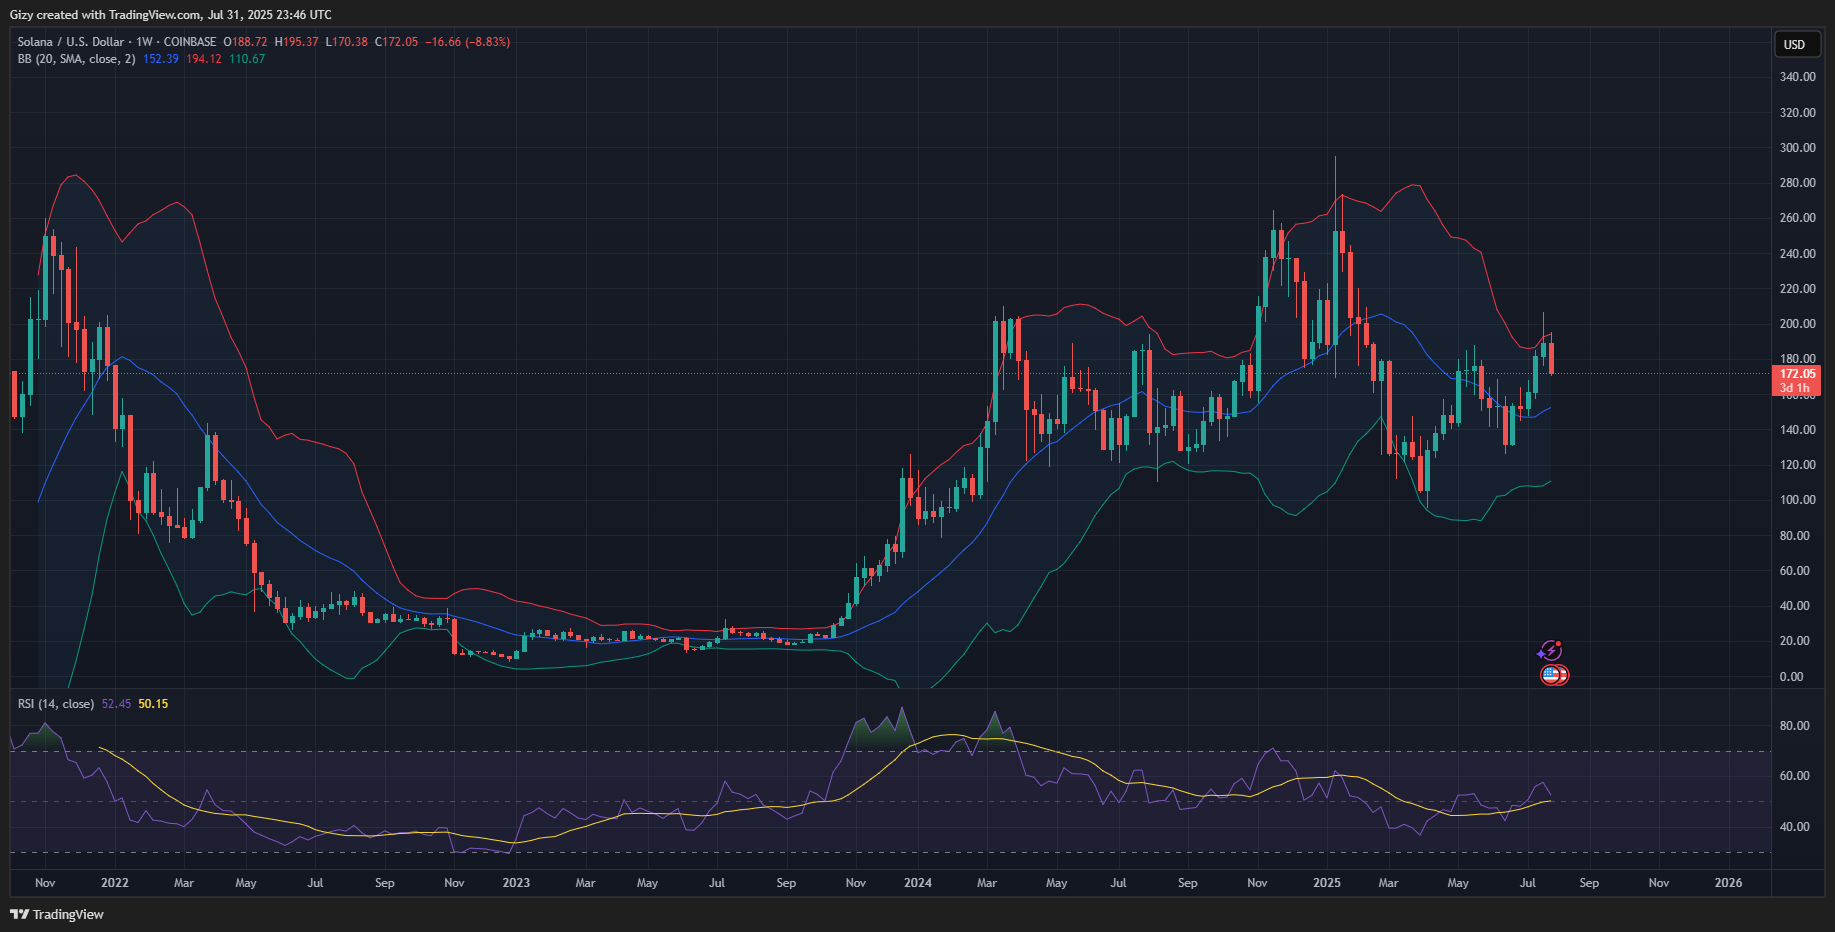
The ensuing downhill movement may continue. SOL may drop as low as the middle band around $152. This will mean that the altcoin will edge closer to retesting the $150 support. Failure to defend the mark will see it drop to $140.
Nonetheless, indicators on the 1-day chart suggest that the altcoin will rebound after dipping. The relative strength index is at 48. A further spike in selling pressure will send the metric as low as 30. Dropping below the mark will result in the asset being oversold.
While there is a high likelihood the RSI won’t drop to this level, recovery may start soon. With both indicators pointing to massive declines at the start of August, SOL may be off to a rocky start over the next few days. The coin may record a low between $140 and $150.
Nonetheless, the asset may rebound during the second week of the month. After finding support, the bulls may send the price higher, reclaiming lost levels. Based on its current high, there is a reduced chance of an ATH next month.