
Bitcoin prices during the previous intraday session had very little volatility. As a result, it closed with changes of less than 2%. This is far from what it gained on May 3, when it surged from $59k to a high of $63k and closed with gains exceeding 6%.
Price action on Friday was a critical turning point in the asset’s previous downward trajectory. Several catalysts played in favor of the asset. One such catalyst was the announcement by the US Federal Reserve, which affirmed its disinterest in further interest rate hikes.
Following a two-day meeting, the Fed stated that it would be inappropriate to raise interest until it has confidence that inflation is sustainable.
Additionally, the news of the United States seeing an increase in employment opportunities reeled up the market. The concerned authorities mentioned that in April, several industries added 17,000 jobs.
Trading action during the previous intraday session suggests that the uptrend is slowly grinding to a halt. Is there any chance that Bitcoin will retrace to $60k?
Exchange Reserve is Increasing
On-chain data shows that the number of BTC in exchanges increased by almost 1% in the last seven days. However, the chart also suggests that bulls are buying back, but the amount of those buying and dumping is almost at an equilibrium.
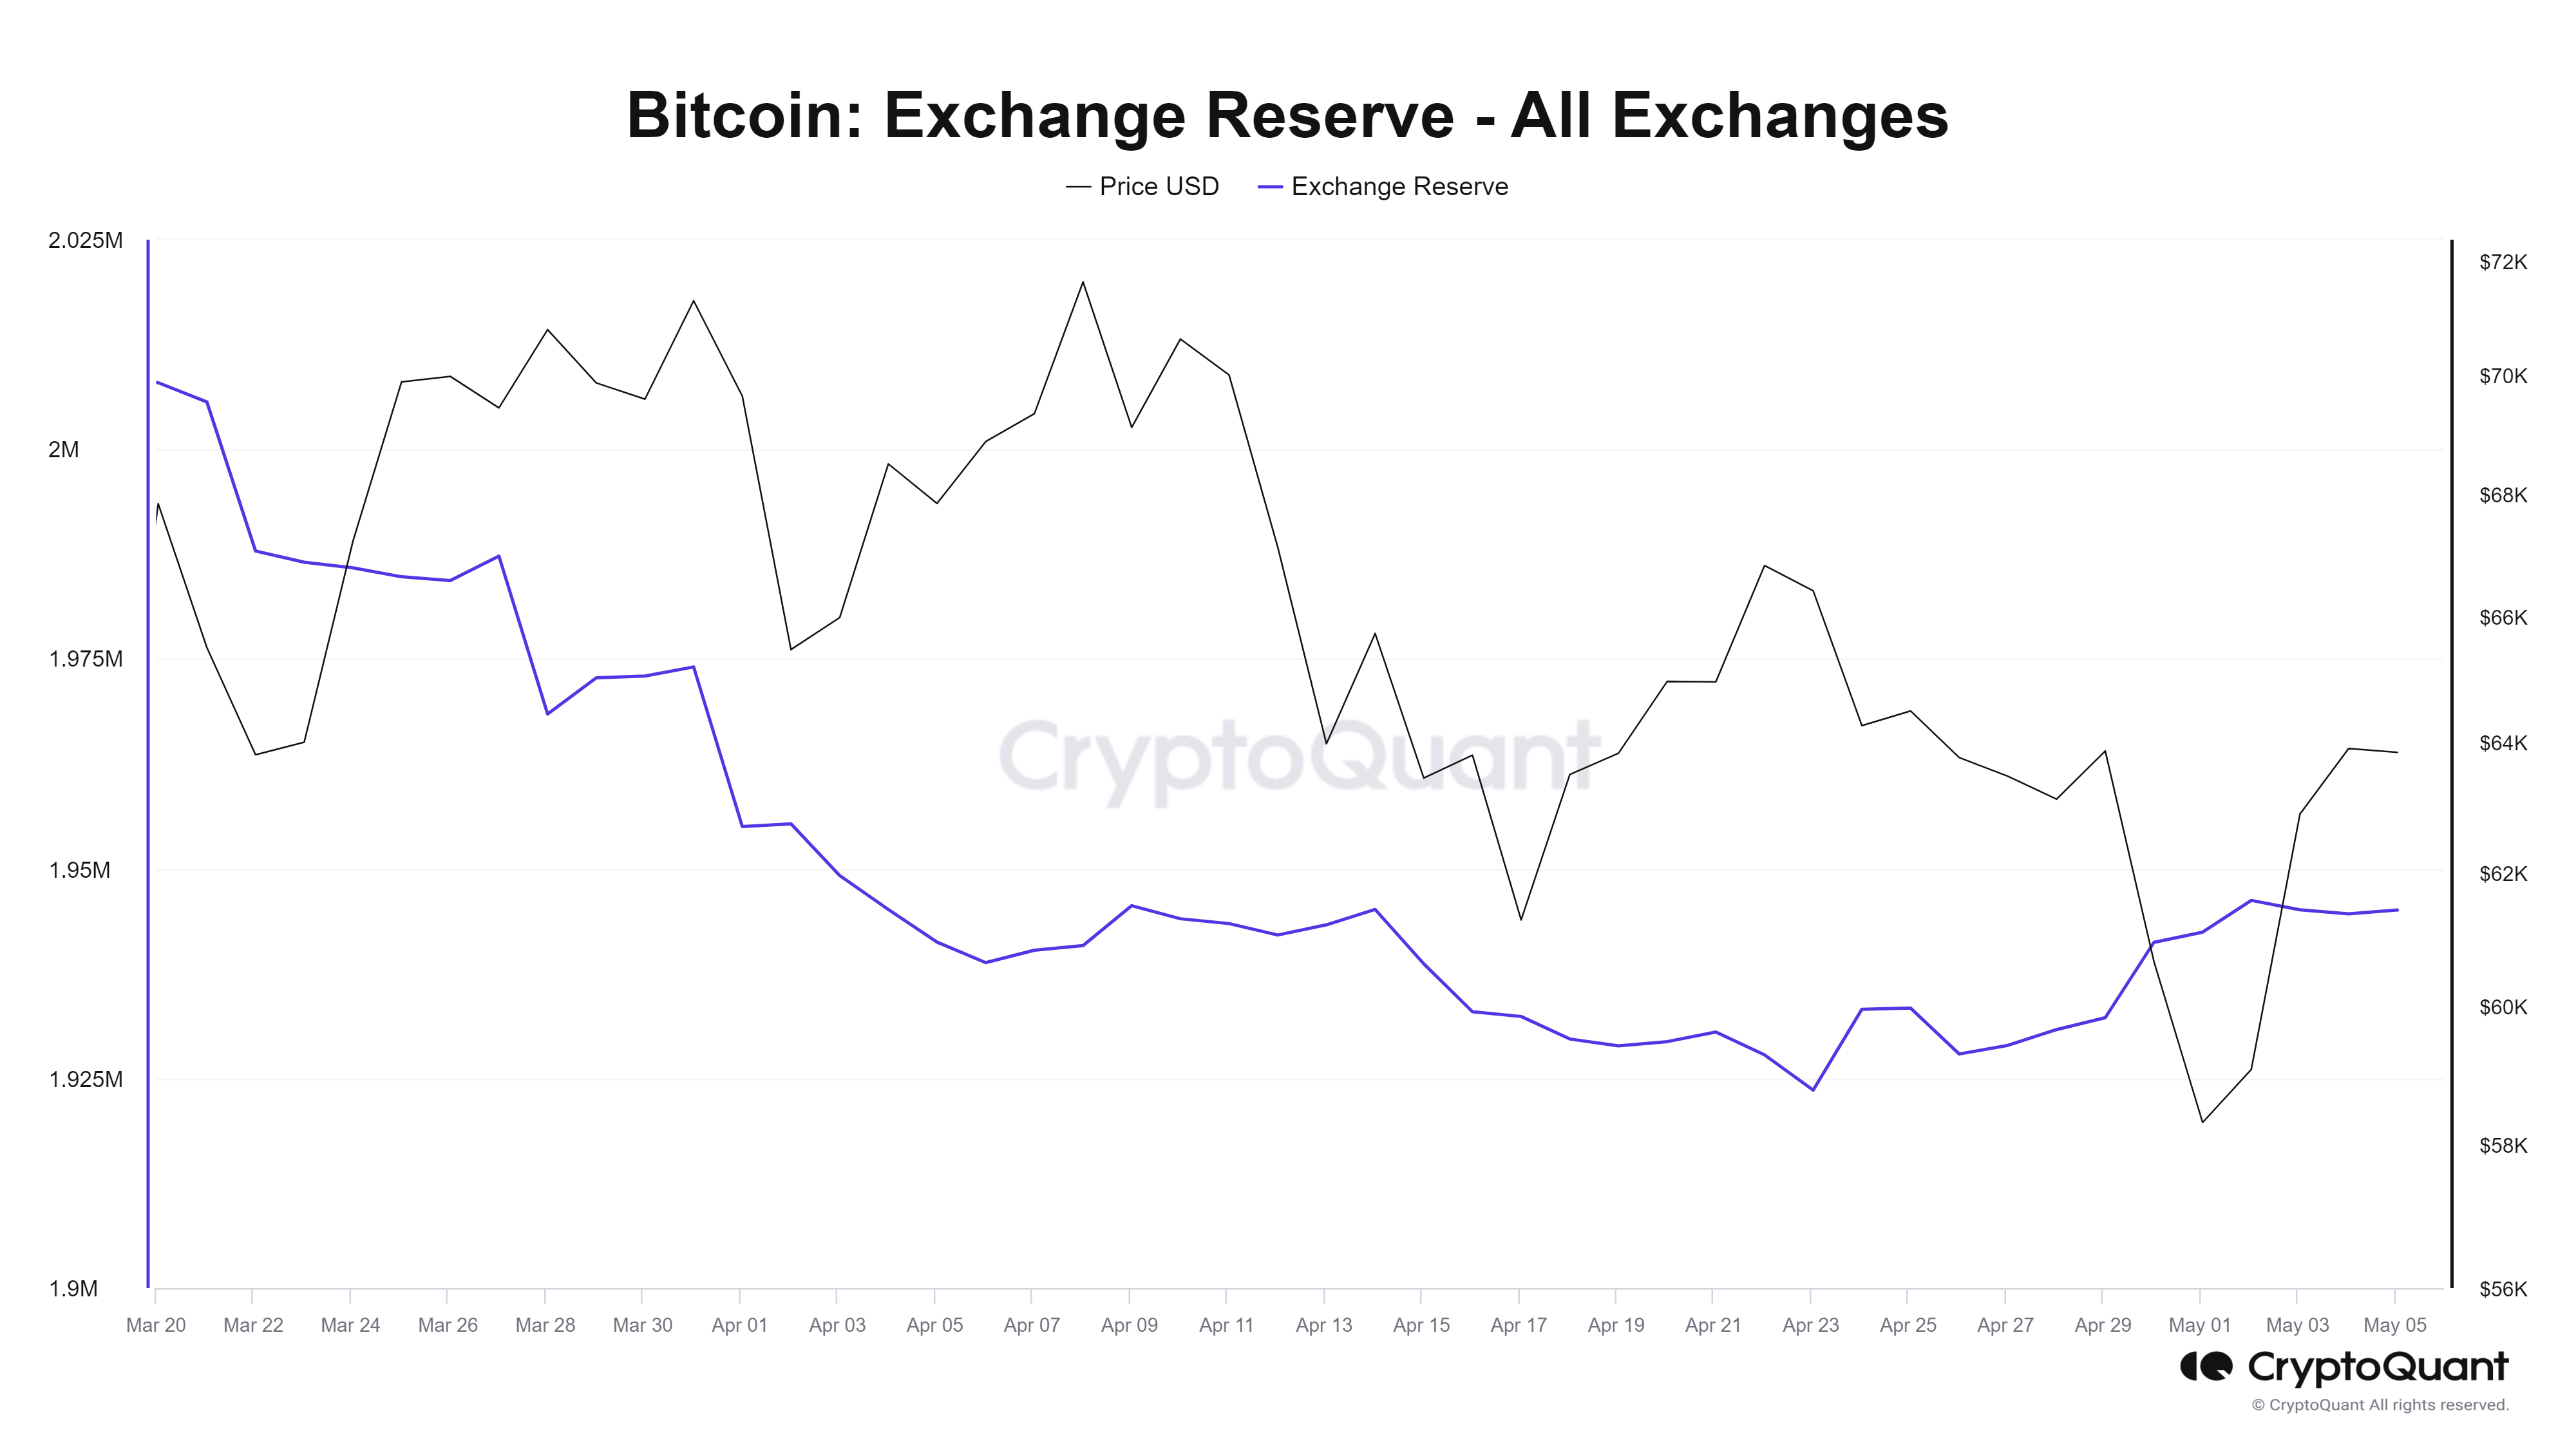
The chart also suggests that the subtle increase in buying pressure is another attempt by the bulls to keep the price above $63k. With no end in sight, the largest cryptocurrency may buckle under intense selling pressure as the thrill of the previous fundamentals dies down.
The asset’s NetFlow also flipped green for the first time in three days. Additionally, short-term holders are taking profit now. All these conditions add up to more selling pressure for BTC.
Bitcoin May Retest $60k
At the time of writing, the coin is seeing small corrections. As a result, it is printing a red candle that resembles a hammer. A close at the current price will make the candlestick more pronounced, which may also mean the end of the uptrend.
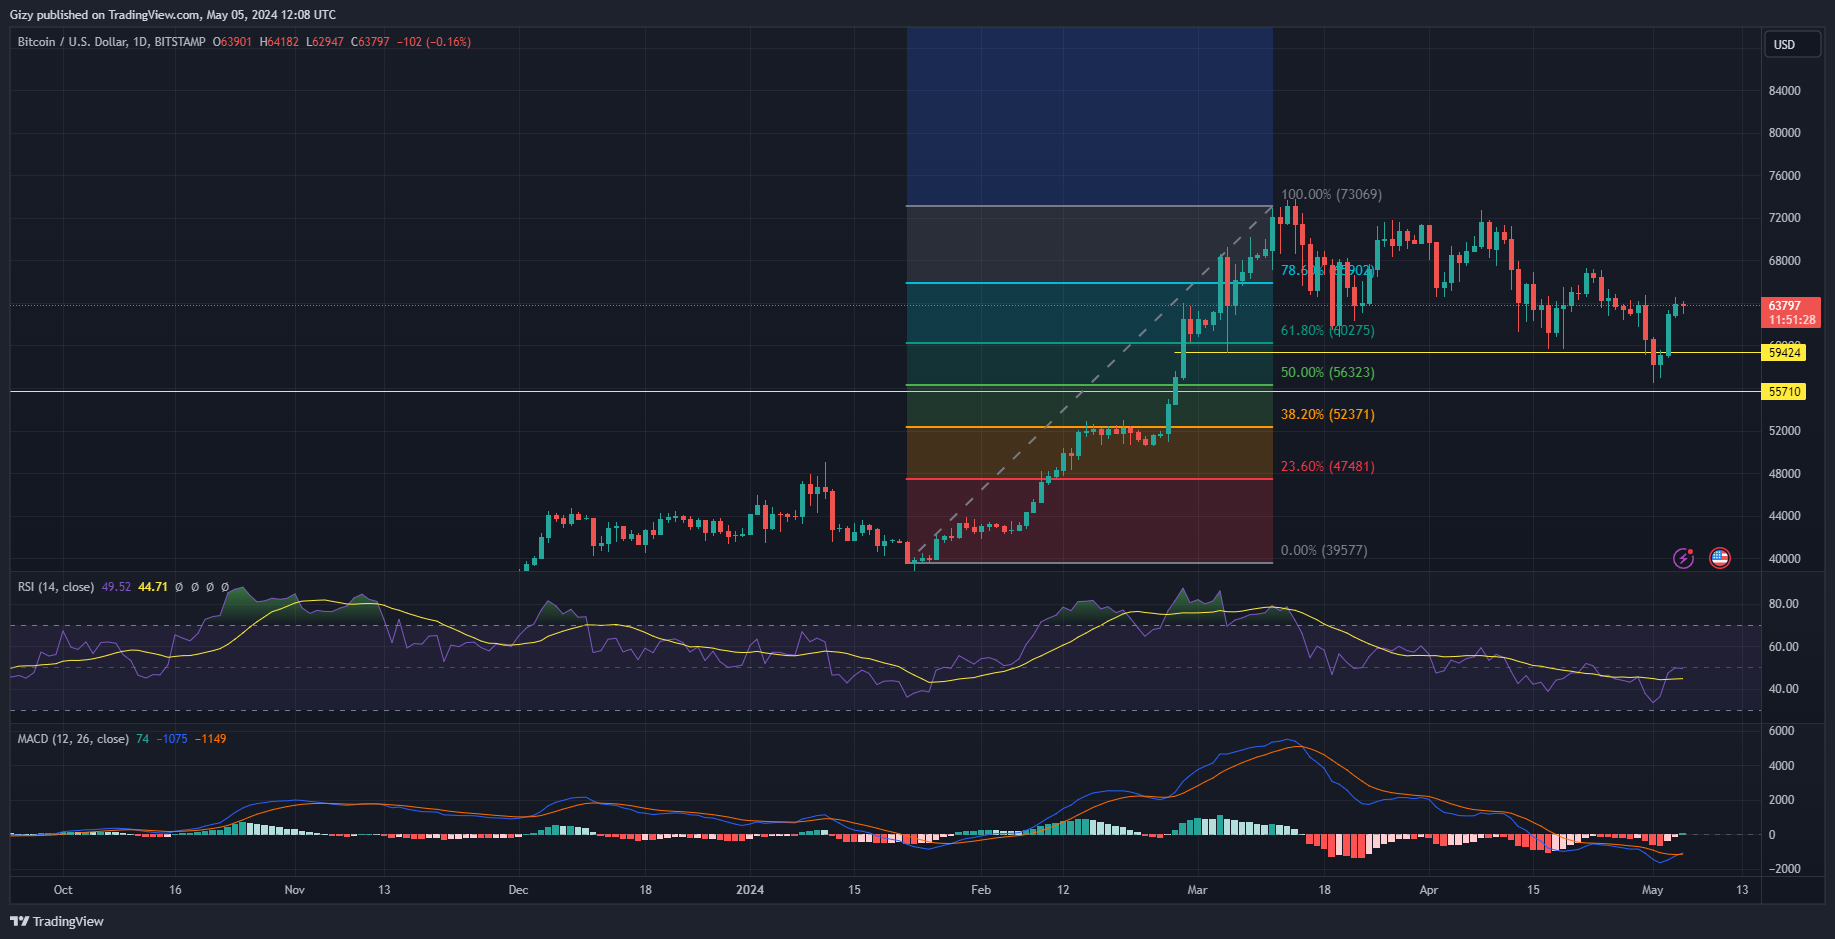
The coin failed to decisively flip the pivot point at $64,185 during the previous intraday session. The mark is a critical resistance currently holding up against further attempts. Failure to gain stability above it will result in a bearish close.
Nonetheless, the largest cryptocurrency is trading below the 50-day exponential moving average. Following its failure to close above the EMA on May 4, a repeat of this trend will send bitcoin downwards.
Indicators like the relative strength index point to the gradual increase in selling volume. It surged from a low of 33 to 49 in four days. However, the uptrend is coming to an end, as the bulls are unable to sustain it. A closer look at the metric shows it is starting to go downhill in response to the most recent trend.
This metric’s reading suggests mounting pressure on Bitcoin. If it continues, it will lose its $63k support. According to previous price movements, the coin has no vital area of concentration after $62k. The next critical level is the 61% Fibonacci retracement mark at $60,275.
A drop below $60k will happen if the bulls fail to defend the critical level.
MACD’s Bullish Convergence
Amidst the looming threat of massive price declines, the moving average convergence divergence is printing buy signals. The 12-day EMA is in contact with the 26-day EMA as the bullish convergence comes to an end.
With the prospect of a bullish divergence, traders expect a resumption of the uptrend. A close above the 50-day EMA will mark the start of such price ascent. This will also mean gaining stability above the pivot point.
Ticking these boxes will set the apex coin to retest the 78% Fibonacci retracement level at $65,902.


