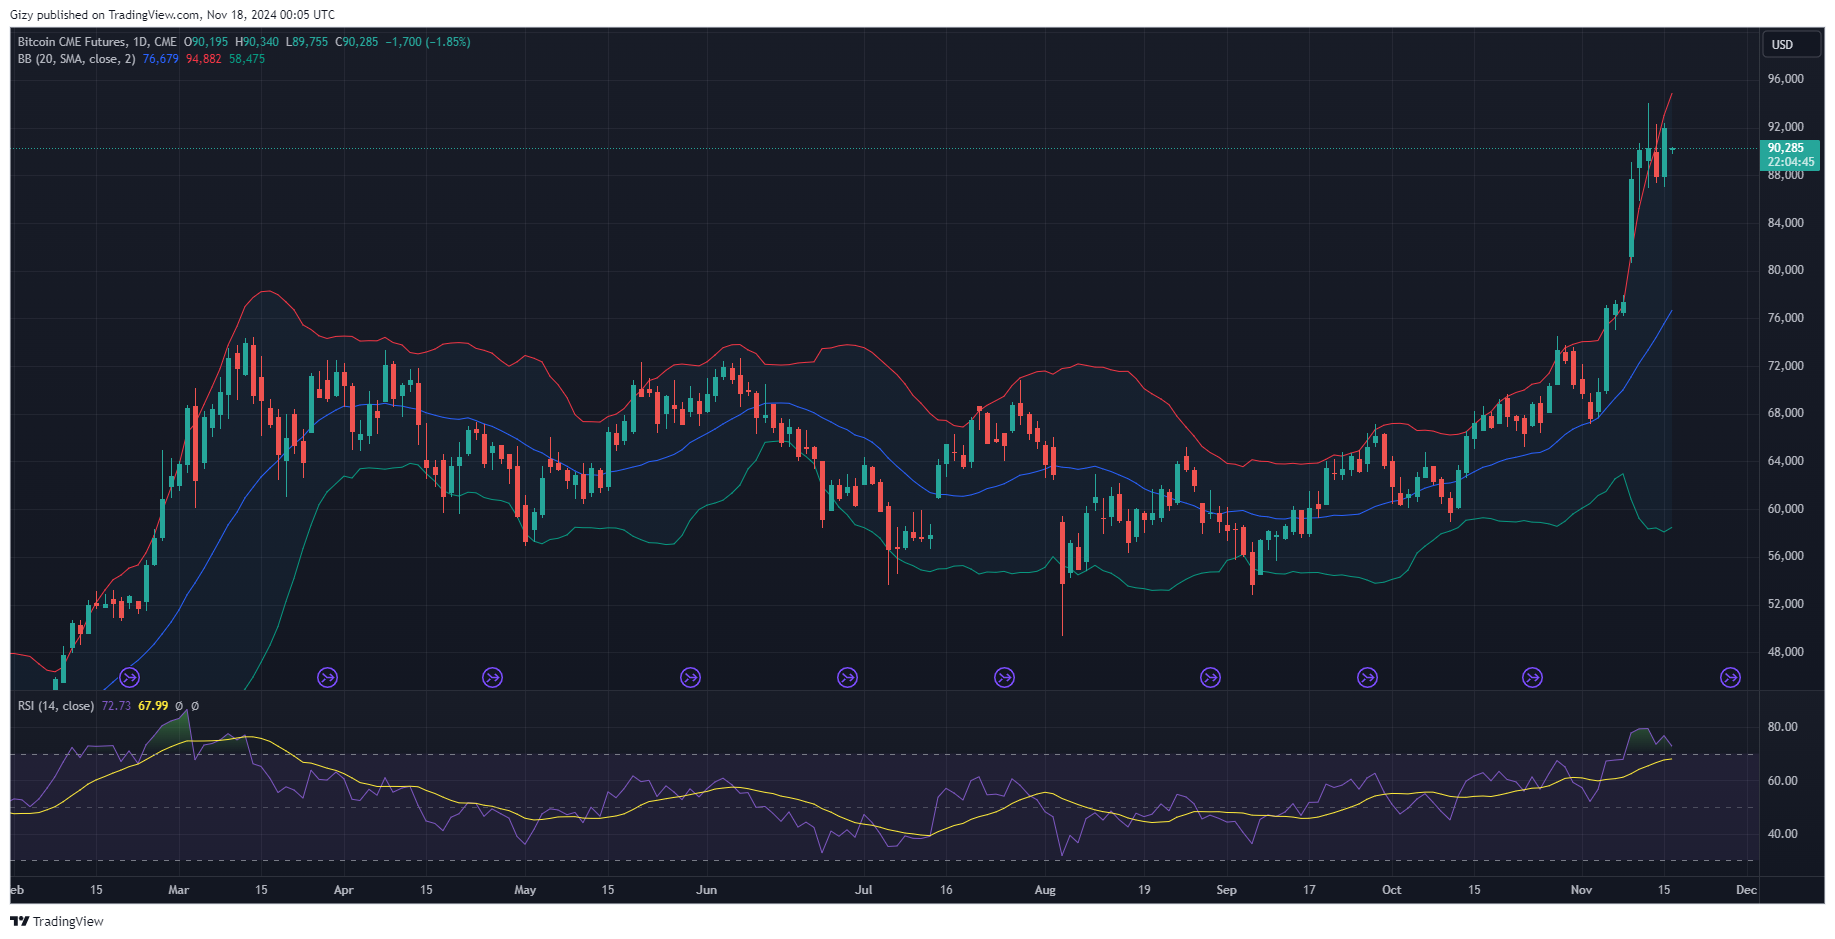
Bitcoin registered a new all-time high at $93,483 on Nov. 13. The surge was widely celebrated across the market at the time as the asset rebounded from a downtrend that threatened to increase in intensity.
The apex coin lost over 3% the next day as it reverted following the previous day’s close at $90,498. It dropped to a low of $86,685 but recovered the next day. However, trading actions over the last 48 hours presented another failure to sustain a surge above $90k.
Currently trading at $89,537, the asset may close another session below $90k. The pull below the highlighted mark is vital as the bulls may be exhausted from the previous uptrends.
Onchain data show a gradual decline in investors’ interest over the last seven days.
A Drop in Whale Transactions
A sign of the drop in interest is a gradual decline in large transactions on the cryptocurrency. Such transfers exceeded 19,527 as of Nov. 12 but are at 9201 as of the previous intraday session, a more than 50% dip.
Some traders who bought above $90k are currently in losses. However, this fraction of holders may not affect Bitcoin’s price; they are less than 2%. While a larger number of holders are in profit, an event could affect the market, causing panic. Nonetheless, total exchange netflows are negative, -$53 million as of the previous day, indicating traders are still taking profit.
These readings are also present on CryptoQuant. Exchange reserves are gradually increasing, with a tiny hike during the previous session. The latest trend is due to more investors moving assets into these trading platforms and selling. Transfer volume increased by over 50% as active wallets surged by 3% and transactions increased by 31%.
Nonetheless, US investors are mostly optimistic amidst the growing price uncertainty. The Coinbase premium is positive, indicating relatively intense buying pressure. However, this is not the case with ETFs, as the fund premium is negative due to outflows. The Korea Premium is also negative as the Asian market takes a bearish stance.
The growing bearish trend spreads into the derivative market, as open interest is relatively lower than in previous sessions. Selling sentiment is also prevalent as more sell orders are being filled. However, the bulls are trying to pull back by flooding the sector with funds. Their efforts have yielded minimal results.
Current funding data shows that long-position holders are adding more funds to keep their positions open. It remains to be seen how such endeavors will affect price trajectory.
Bitcoin Pull To $80k
The BTC CME chart shows a significant gap between $77,500 and $80,700. The principles guiding such is an almost 100% chance prices will slip to this level to fill it. However, questions of when prices will retrace to this level are one only time will tell.

Nonetheless, onchain data shows a massive chance of worsening ongoing price struggles. CryptoQuant’s stochastic and relative strength index are currently negative, indicating that the asset is overbought. Based on this metric, Bitcoin may decline further.
However, this reading is also present on the one-day chart. RSI surged to a high of 84 on Nov. 11 but has since declined as selling pressure increased. Currently at 73, the price may continue downward until RSI drops below 70.
Coinglass shows huge buy orders around $87,550. There are more around $85k. If such declines to the highlighted level happen, prices will almost certainly drop to fill the CME gap.
Previous price movement suggests that Bitcoin’s inability to break above a critical barrier may result in further downtrends. The next 48 hours will be a decider when the apex coin fills the gap.
