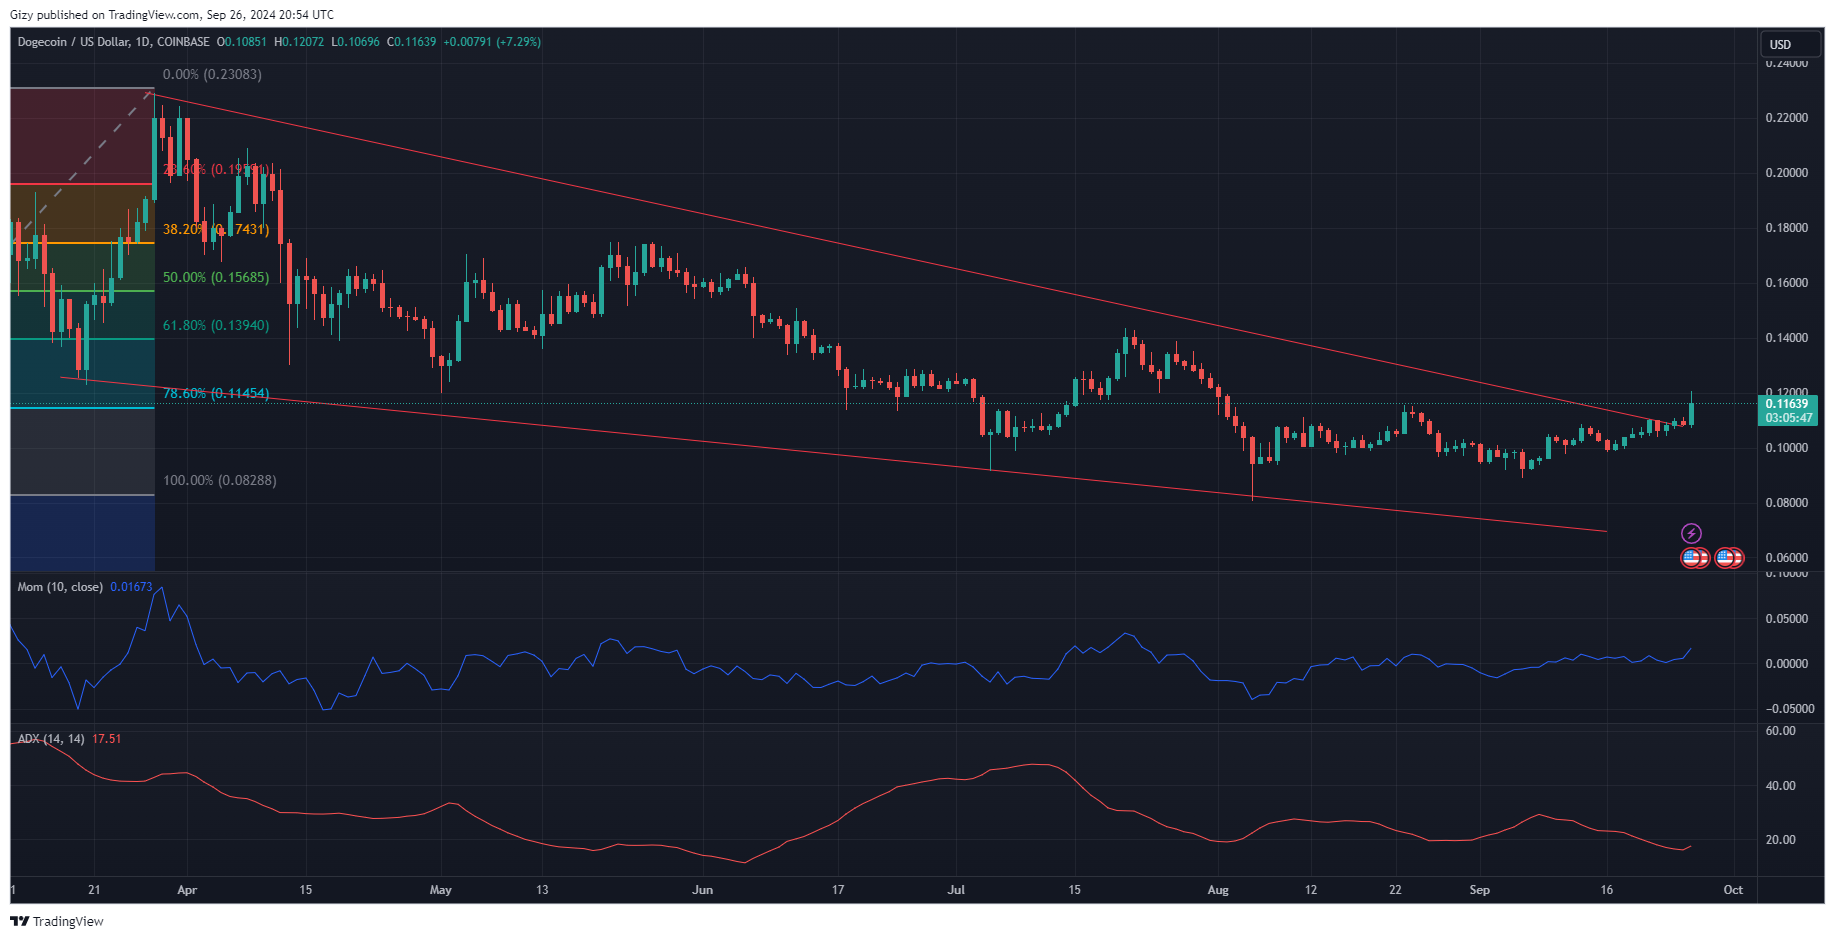
Dogecoin registered massive gains over the last 24 hours. It started the day trading at $0.10 but suddenly shot up, flipping the $0.12 resistance. However, the climb above this critical mark was short-lived as the price retraced following the flip.
Currently exchanging below the highlighted level, questions of whether the uptrend will continue looms.
What Caused the Surge?
Dwindling supply on supply on significant exchanges is most likely the reason for the latest spike. Crypto exchanges like Binance and Bybit see limited DOGE in their reserves as more traders withdraw their bags from these platforms.
Recent on-chain data shows over 10 million DOGE left the two highlighted exchanges. This trend shows a shift in market sentiment, as many investors are massively bullish and are moving their assets to cold storage.
The outflow exceeds the inflow from other trading platforms. For example, Coinbase and Kraken saw minimal inflows. This reaffirms the shift in traders’ psychology. Why the sudden behavior change?
Two Reasons
Two factors may have influenced the latest trend. The first could be a recent improvement in the global economy, especially in the US. China also recently announced some pivotal events in its economy that translated to bullish trends in the global crypto market.

The second reason is on the one-day chart. Several indicators in this timeframe point to a further uptrend, one of which is a chart pattern. A close look at the chart below shows that the altcoin’s recent surge was a breakout from a falling wedge. It shows that the asset is due for a massive breakout.
Aside from the highlighted patterns, other indicators also point to more uptrends. The momentum indicators show a significant push behind the massive increase. It remains to be seen if the bulls can sustain the trend. Nonetheless, the average direction index is rising, which may mean the uptrend will continue.
It edged closer to its first pivot resistance. Although it broke $0.12, it failed to break this critical mark. The asset is trading above its pivot point, which many regard as a bullish sign.
However, the most recent decline appears too sharp, as there was no notable buildup to it. Fears of an equal decline are rising.
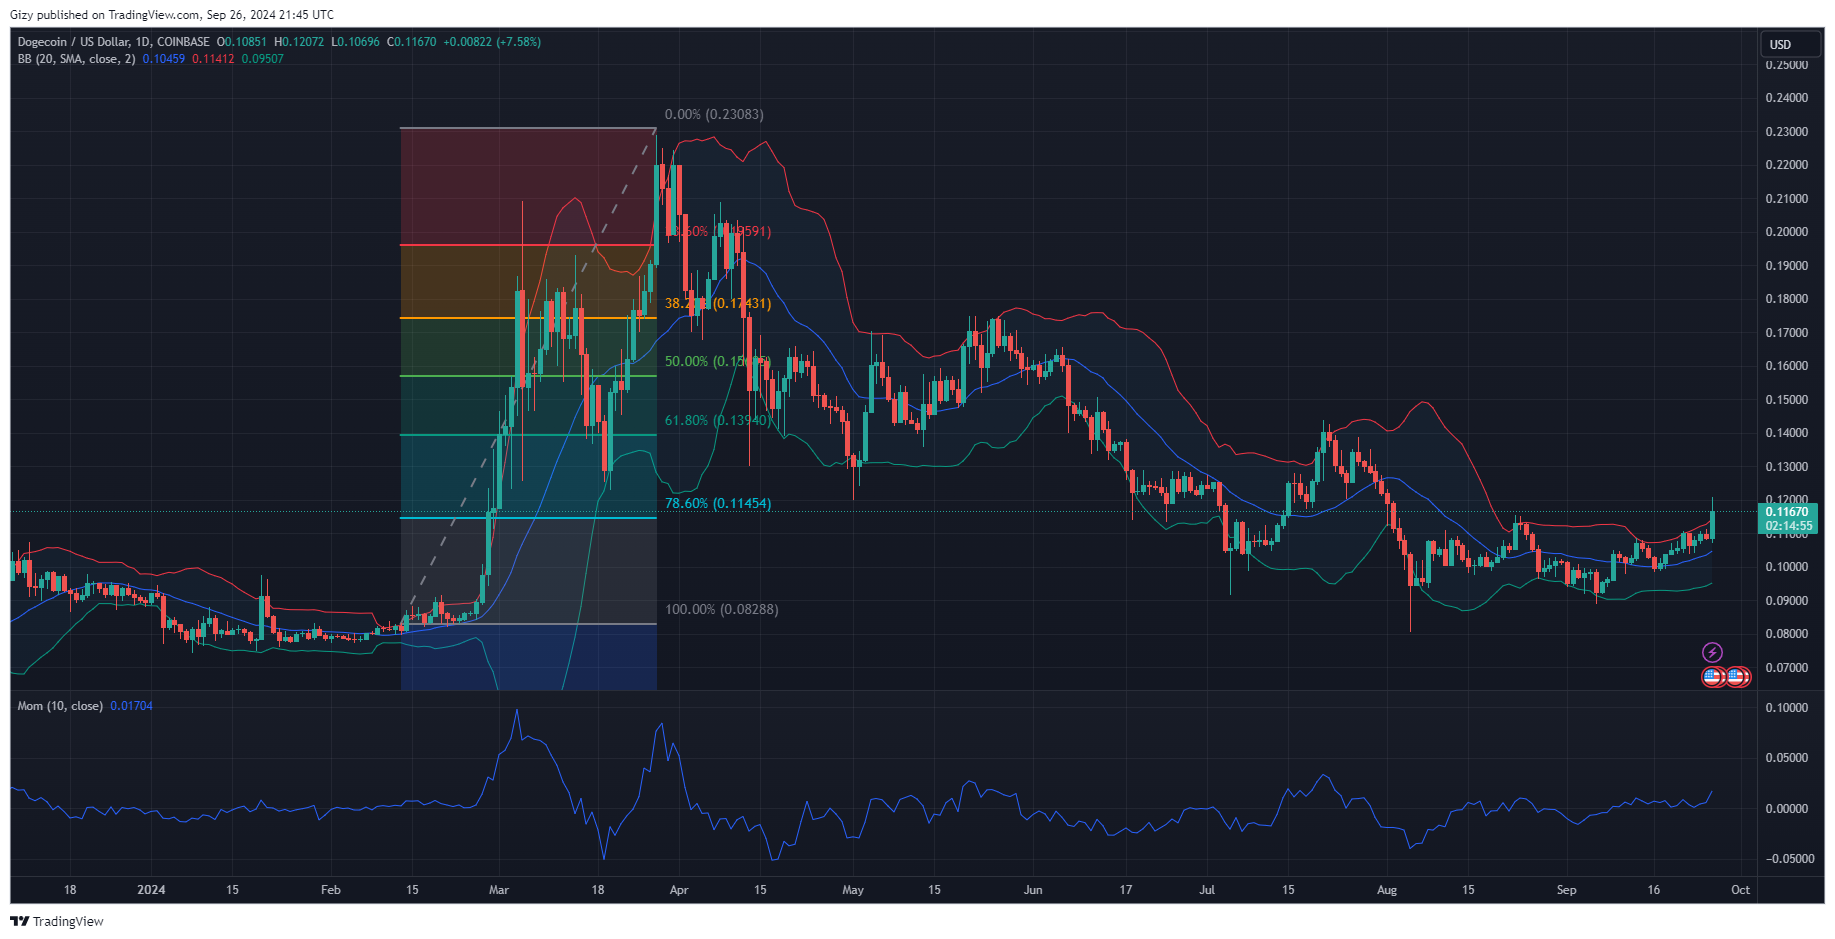
Dogecoin Surges Above the Bollinger Bands
Dogecoin has traded above the middle band in the Bollinger bands, maintaining trading within this region over the last two weeks. However, the recent breakout may be a bad sign for the cryptocurrency, as it may mean the end of the uptrend.

A similar event took place a few weeks ago. It surged by over 4%, touching the highlighted level. It lost over 7% following this event. The same scenario may play out this time. However, the decline’s proportion is unknown.
A close look at the current day candle suggests that the uptrend may be unsustainable as the long wick indicates that the bulls are getting exhausted.
Key Levels to Watch
Vital support: $0.10 $0.09 $0.08
Vital Resistance: $0.12 $0.14 $0.16
The downtrend may not be as severe as during the bear market. Nonetheless, the asset will test its pivot point at $0.10. Due to notable demand concentration, there is a low chance that the mark will break. Due to this concentration, it has held out against several attempts.
Nonetheless, a flip will result in an almost inevitable retest of the $0.09 support. Although prices only touched this mark a few times in the three months, it held out. The last barrier is the tough $0.08. Prices are almost sure to rebound off this mark.
On the other hand, Dogecoin will look to continue the uptrend. It may break its first pivot resistance and test the second pivot resistance. The bulls will look to push the price to R3.
