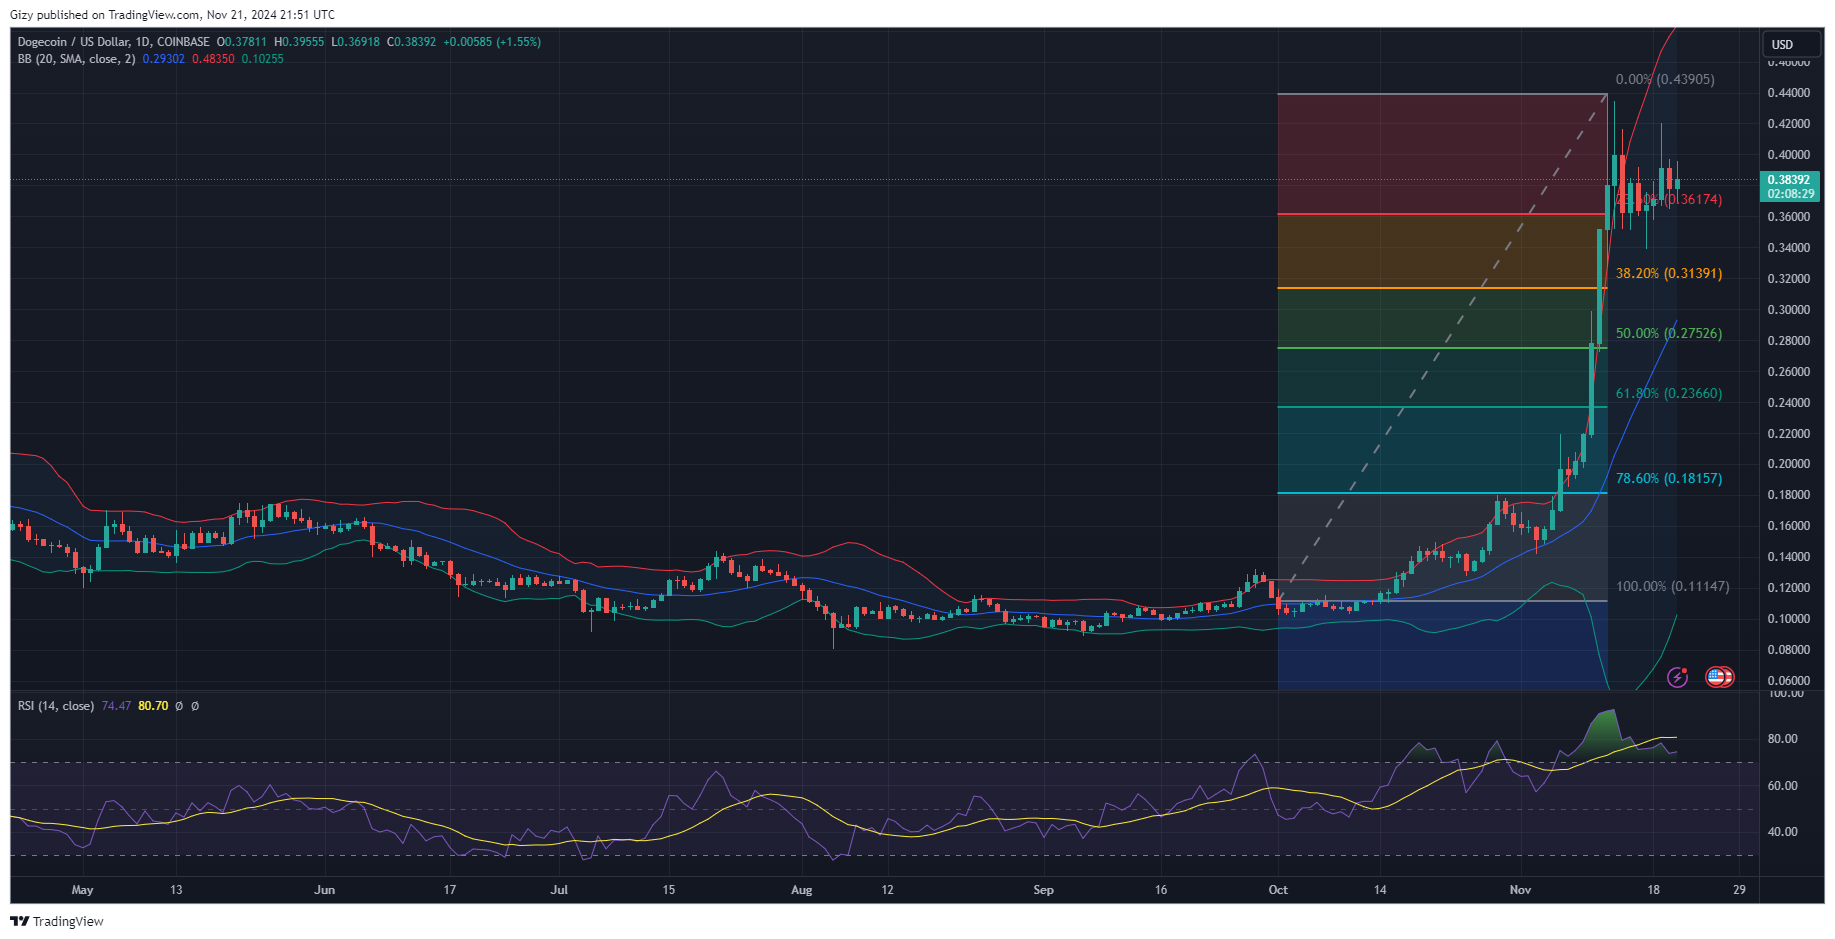
Dogecoin is trading at $0.38 following its recent drop to $0.36. It attempted the $0.40 barrier but failed due to massive rejections.
This is not the first time the memecoin has faced such resistance. It had a similar movement during the previous intraday session with small losses. However, previous price movements suggest that the highlighted barrier is one of the major areas in which the asset grapples.
The $0.44 barrier has remained the strongest over the last ten days. DOGE failed to break it following its surge on Nov. 12. It faced massive rejections at the mark as the bears staged selloffs. The same trend repeated the next day when it started trading at $0.38, recovering from a dip to $0.35. It tested the mark but failed.
The apex memecoin edged closer to the highlighted resistance on Tuesday. It started trading at $0.37 and surged after a brief decline. It peaked at $0.42 and closed with gains exceeding 5%.
Why is DOGE Stuck Below $0.44?
Dogecoin’s failure to break above the $0.44 mark remains a concern for many. They cited the coin’s price correlation with Bitcoin as a reason for an uptrend. This comes after the apex coin registered a new all-time high edges closer to $100k a few hours ago.
Onchain data shows a massive struggle for dominance between the bears and bulls. The competition is fierce, with a close margin. Indicators indicate a huge chance the bulls may lose out in the struggle. Nonetheless, the growing selling pressure may worsen in the coming days.
The asset sees notable demand concentration and trading volume at $0.38, causing a rebound when prices slip below the mark. However, the volume gradually reduces, and buying pressure drops when it edges closer to $0.42. This trend explains the reason for the ongoing ranging between both price marks.
Onchain metrics show dwindling interest in the coin as its community growth is at its lowest over the last seven days. The number of transactions has significantly declined during this period.
Dogecoin May Slip Further
Indicators on the one-day chart show the asset gearing up for a significant bearish move. The moving average convergence divergence prints a sell signal at the time of writing. The 12-day EMA is declining and close to intercepting the 26-day EMA. The ongoing bearish convergence reflects on the price trajectory. A divergence may hint at further decline.

The momentum indicator shows the bulls losing out in the struggle for dominance. It has been on a downtrend since Nov. 14 and has had one of its sharpest dips over the last three days. The drop in momentum shows a growing bearish sentiment among the asset’s holders.
The relative strength index is negative at the time of writing. Dogecoin surged above 70 on Nov. 6 and has since continued above it. It peaked at 92 a few days ago but declined. Nonetheless, the current day marks the 15th day of being overbought. RSI blares warnings, hinting at an impending massive price decline as the asset is due for corrections.
The Bollinger band shows the asset trading closer to the upper SMA—the metric hints at a massive chance of further declines. DOGE may dip to the middle band at $0.30.
Fibonacci retracement points to a notable demand concentration at $0.36. Previous price movements show the bulls holding this critical level. Dogecoin may lose this price level following growing selling pressure. It will slip as low as the 38% fib level at $0.31.
The trigger for such a decline is still uncertain. However, it may happen after another failed attempt at the $0.44 barrier. Losing the $0.36 support may signal an almost inevitable dip to $0.30.
