
Ethereum sees notable declines following its good start to the week. The largest altcoin currently grapples with significant selling pressure.
ETH opened Tuesday at $2,744 but experienced a wave of notable selling congestion. As a result, it retraced, hitting a low of $2,600 before rebounding.
The latest decline sees the second-largest coin erase Monday’s gains. It was off to a good start, surging from $2,661 to break the $2,800 barrier for the first time in two weeks. The altcoin peaked at $2,849 but retraced and closed at $2,744.
Investors were shocked when ETH experienced a spike in selling pressure. Following the good start to the week, they anticipated further price increases.
Monday’s Surge May Be a Pump-and-Dump
Ethereum surge on Monday was surprising as there were no indications before the surge—nonetheless, onchain metrics hints at the cause of the sudden uptick.
An increase in its network activity sent traders into a short-term buying frenzy. Data from CryptoQuant shows that buying volume was significantly high at the time as the exchange reserves slightly declined.
The rise was due to the launch of a new launch pad within the ecosystem. The Pepe launch pad hit the market on Monday, resulting in a sharp increase in network activity. Fees rose from $0.70 to $70 per swap.
ETH price followed with an almost 7% initial hike. PEPE registered a similar increase, surging from $0.0000097 to $0.0000106. The memecoin gained over 10%.
However, further data showed a significant decline in several onchain metrics. The number of transactions was significantly lower than the previous day’s and active addresses plummeted. The readings suggest that the hike in network activity involved a few wallets and does not reflect the broader sentiment across holders.
The final piece of the puzzle is the exchange netflow. It was 160% positive, indicating significant selling pressure amid the short-term increase.
Ethereum is currently grappling with significant selling pressure at the time of writing. Down by almost 4%, onchain metrics point to further declines.
Massive Selling Volume
Data from CryptoQuant shows an ongoing selling frenzy. Exchange reserves slightly increased in the last 24 hours. The derivative market shows dominant selling sentiment as the bulls see tremendous losses.
Investors displayed notable selling pressure on Tuesday compared to the previous day. The Korea Premium is negative as traders from the region sold more assets. Nonetheless, the Coinbase premium is negative but significantly lower.
On the bright side, some holders are gearing up for an impending surge. The exchange netflow total shows more assets, leaving the trading platform for cold storage. Transfer volume also soared by 128%.
Ethereum May Retest $2,500
The one-day chart shows indicators reacting to the latest dip. The moving average convergence divergence flipped bearish several days after its bullish divergence. Its 12-day EMA halted its uptrend and trends on a straight line. Further declines may result in the start of a bearish convergence.
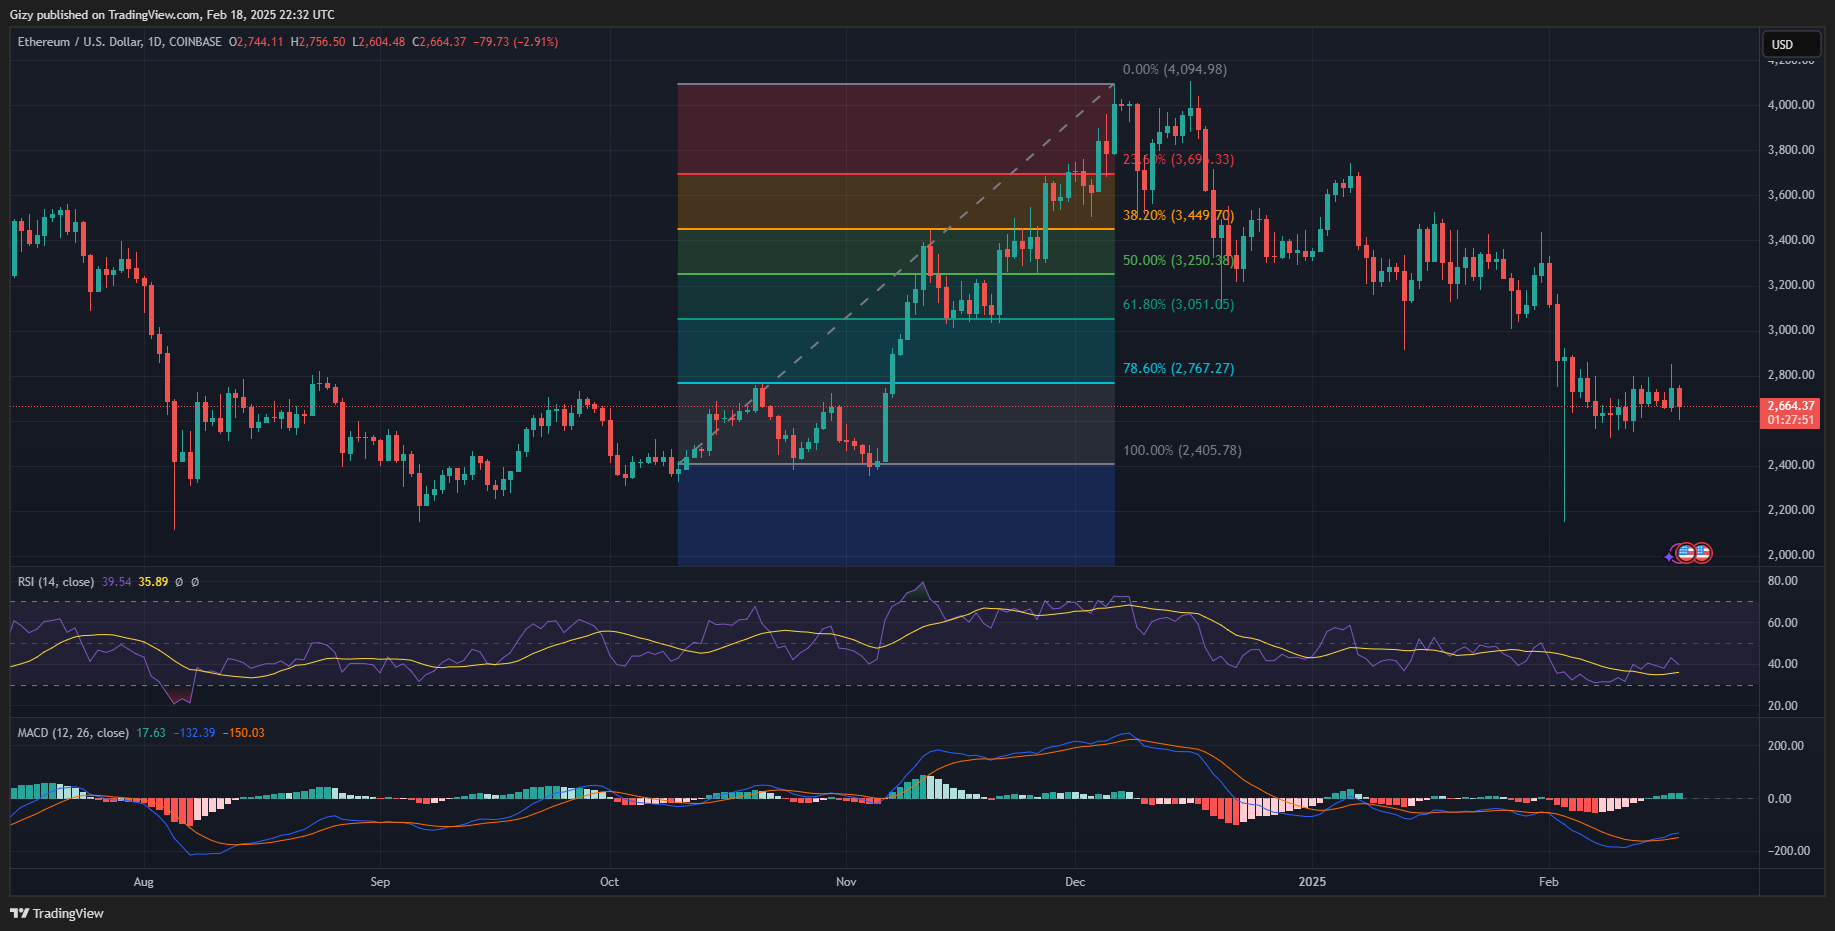
The largest altcoin may lose the $2,600 support. It has maintained trading above $2,550 over the last two weeks, but this may change in the coming days as the crypto market slips lower into the bear’s dominance.
Other metrics, such as the relative strength index and the accumulation/distribution chart, suggest that the bulls are unable to absorb the excess supply at the time of this writing.
