Bitcoin had one of its biggest declines on Monday. It retraced from $95k, lost the $90k support, and rebounded at $89k.
The dip left the market in shock as many investors scrambled to understand the reason for the latest dip. The crypto market registered significant outflow during the previous day as the selling pressure increased. This action comes barely a week to Donald Trump’s inauguration.
Many expected that the days leading to the historical event would result in massive bull runs. However, price actions shows that the reverse is the case. The treasury yield posted a 5% increase last Wednesday. The increase in the market was due to fears that the president-elect will cause more pressure on the $28 trillion market.
The dip during the previous intraday session was due to investors moving their assets from high-risk assets like several cryptocurrencies and stocks into low-risk markets like treasury. Investors were massively bearish on several assets.
However, the last few hours of Monday saw a change in trajectory. The market saw a massive buyback, resulting in prices returning to lost levels. Bitcoin closed at $94,537, its opening.
Traders feared further declines following the previous day’s action. The latest increase may indicate that the bears are exhausted.
Why is Bitcoin Up?
Donald Trump restated his commitment to the crypto industry with some additions to his inauguration. It will feature a crypto ball, celebrating him as the first crypto president.
The latest changes received applause from several crypto proponents, boosting the crypto market’s confidence in his policies. This is why Bitcoin and other cryptocurrencies surged.
While the surges revives optimism, investors brace for another decline in the next 24 hours. The United States Bureau of Labor Statistics (BLS) will release the Consumer Price Index (CPI) on Jan. 15. Reports from Forbes stated that it “could show accelerations in year-on-year total CPI to 3.0% from 2.7% and core CPI to 3.4% from 3.3%.”
The increased CPI may affect the Federal Reserve’s plans to cut interest rates. The crypto market may react negatively to the release.
Is BTC out Dangerzone?
The CPI release may be the last hurdle before the inauguration. However, the one-day chart suggests that the apex coin is not out of the danger zone.

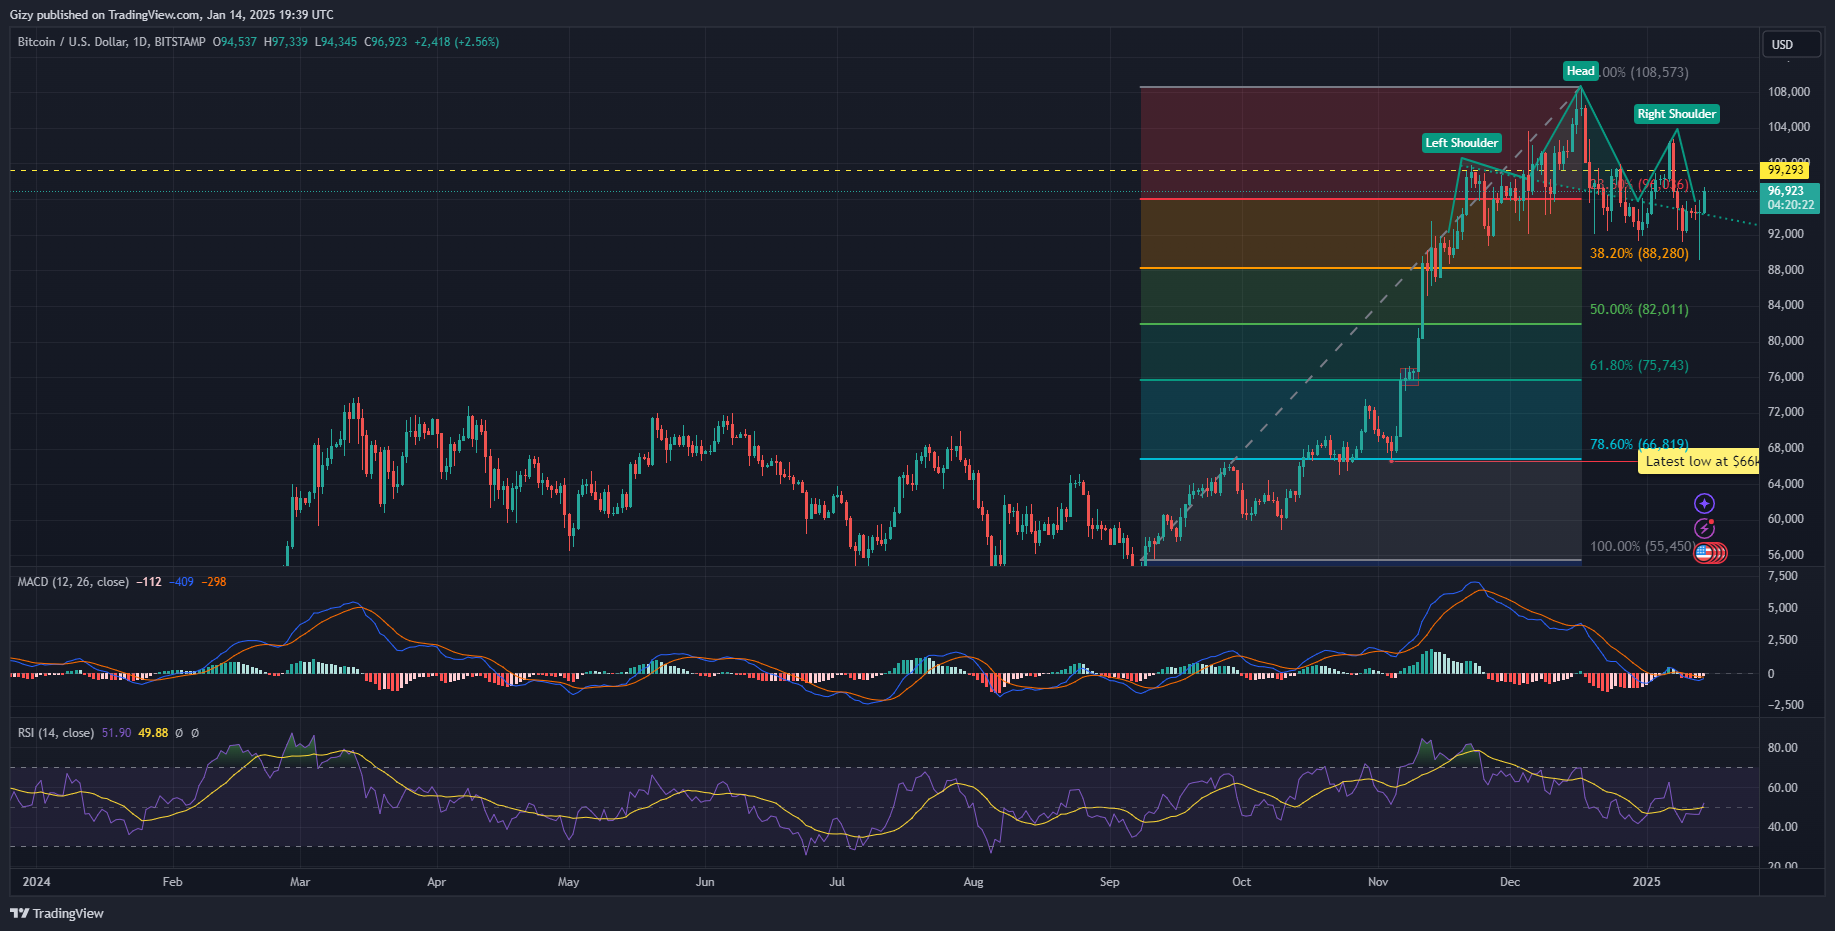
The chart above shows a head and shoulders pattern. This pattern is bearish and appears towards the end of bull run. It hints at further declines in the coming days. Price may sink as low as $88k if the dips continues.
Nonetheless, indicators are positively reacting to the ongoing price trend. The moving average convergence divergence prints bullish signals at the time of writing. The 12-day EMA is on the uptrend and may intercept the 26-day EMA as the bullish convergence progresses.
RSI crossed the 50 a few hours ago as buying pressure increased. Data from CryptoQuant shows that bulls are dominant in the spot and derivative market. The taker buy-sell ratio is above 1, indicating more positive price trend.
The apex currently trades above its 23% fib level at $96k, presenting a critical level with notable demand concentration. It may attempt the $100k barrier if the buyers sustain the current momentum.
