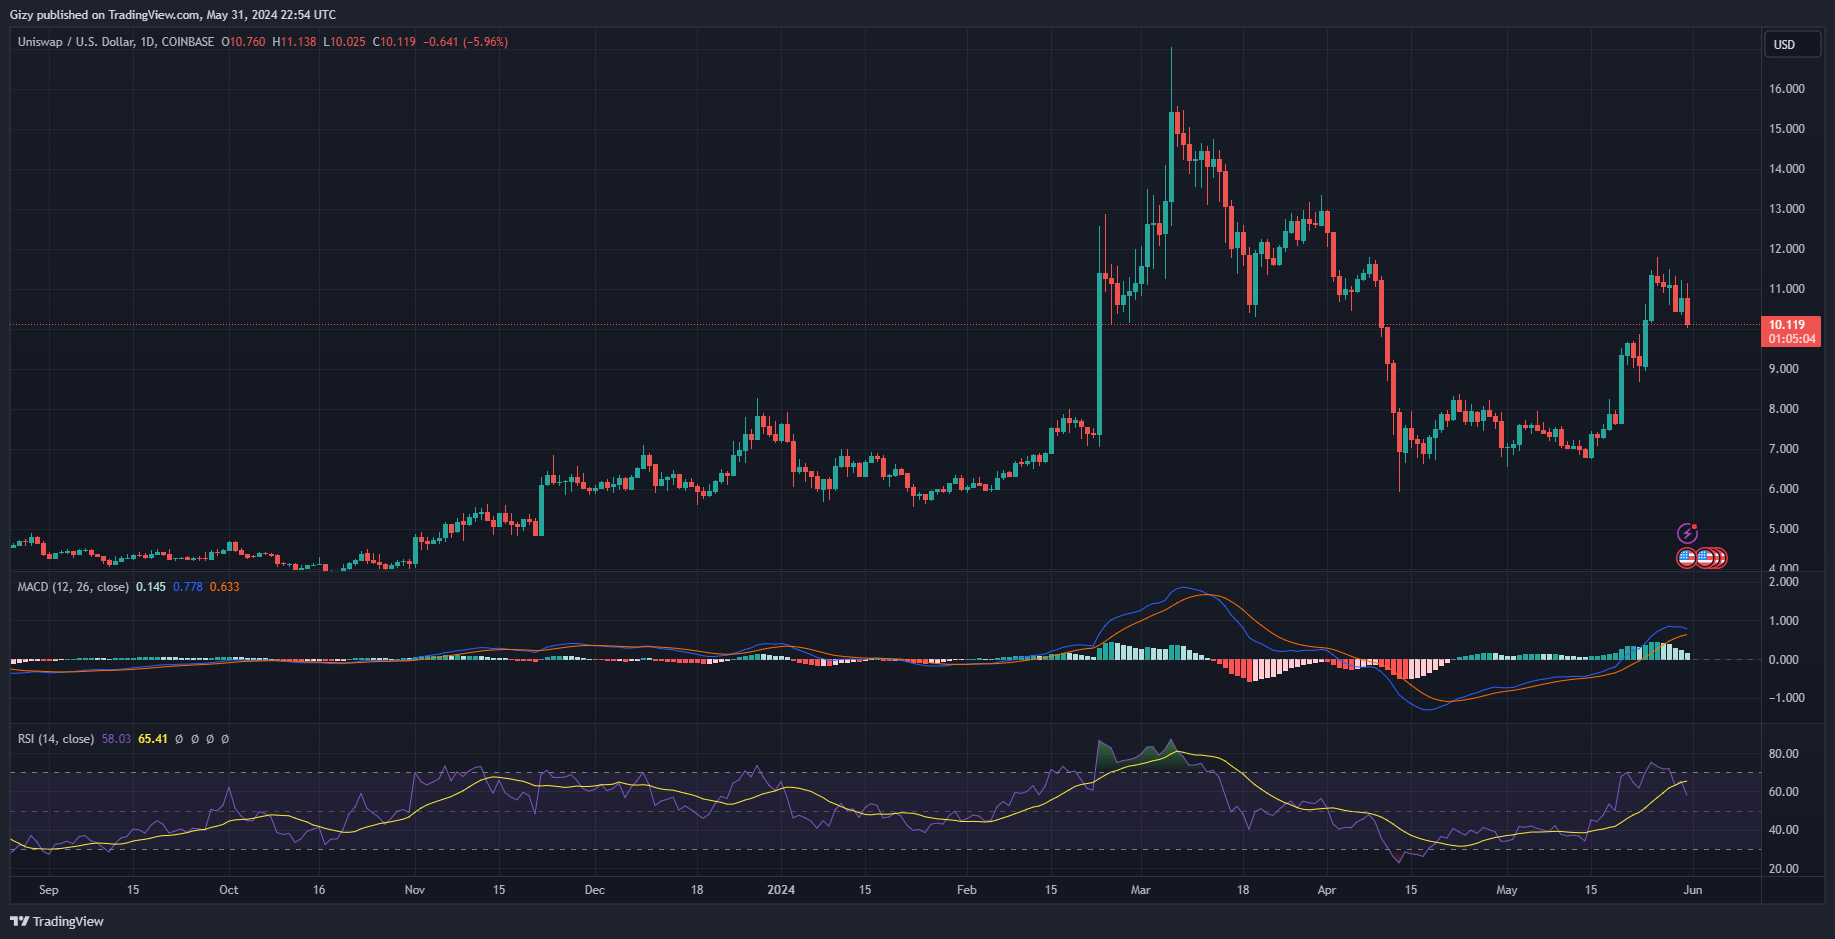
Uniswap is losing almost 6% at the time of writing. The asset continued its decline after a small hike during the previous intraday session. Nonetheless, it is edging to test the $10 support.
The latest decline continues the ongoing bull flag. It started this pattern following a failed attempt at $12. The downtrend worsened following the May 29 price actions. It tried gaining stability above $11 but failed as it faced a massive correction that saw it drop to $10.4 and close with losses of 6%.
The unfolding chart pattern is causing a lot of uncertainties in the next price actions.
Uniswap Will See More Declines
Although the ongoing chart pattern indicates an impending bullish action, when it will take place is a question only time will answer.

Nonetheless, the moving average convergence divergence hints at a further decline. The 12-day EMA recently halted its uptrend and is arched downward. With the ongoing bearish convergence, the asset will see more downtrend.