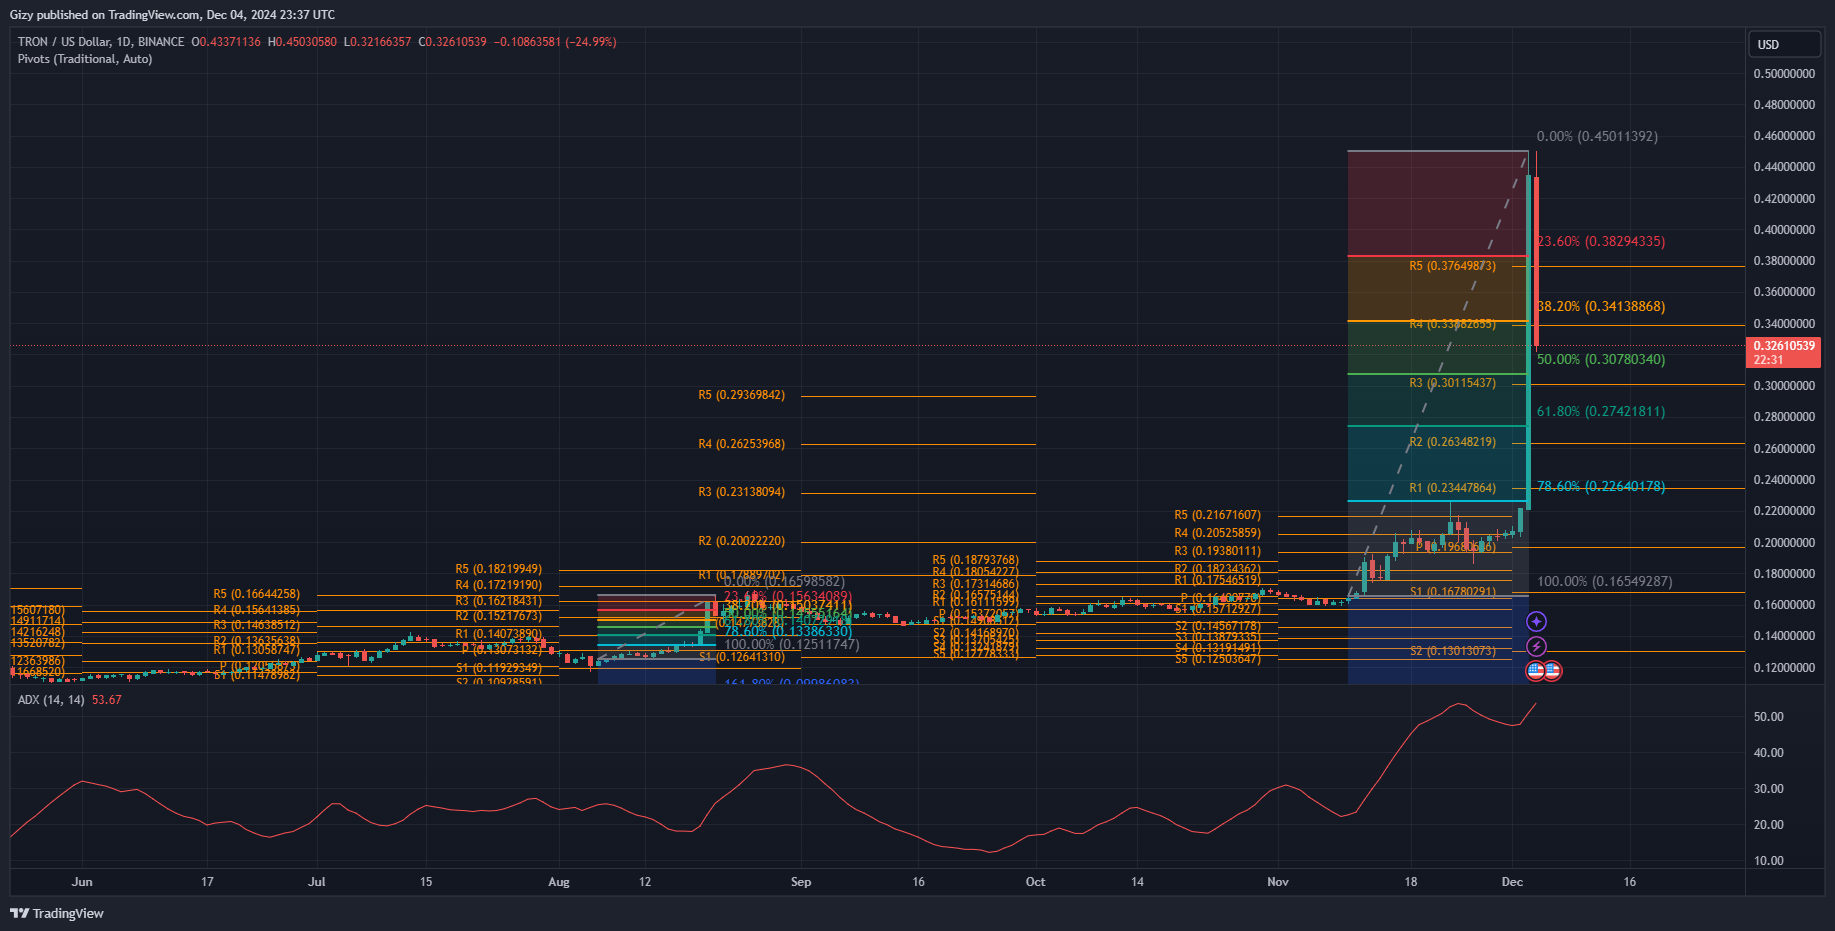
Tron had one of its biggest surges during the previous intraday session. It almost doubled in price, breaking several critical levels.
The altcoin started the previous session at $0.22. The one-day candlestick shows that the asset shot up as the bulls aggressively bought into it. Coin tracking platform shows it had an over 500% increase in trading volume over the last 24 hours.
TRX returned to levels it had lost since January 2018, hitting $0.30. It continued upward, breaking its previous all-time high at $0.35. As the uptrend continued, it broke $0.40 and edged closer to $0.46, but it faced strong rejections at $0.45(the new ATH). Nonetheless, it closed with gains exceeding 96%.
Since attaining the milestone, the asset has struggled to continue the uptrend. It tried breaking it at the start of the present intraday session but failed. It retraced, losing the $0.35 mark and hitting a low of $0.32. Currently down by over 23%, it shows no signs of a significant recovery.
Tron Remains Very Volatile
Tron sees massive selloffs as traders take profit. It is significantly down after its massive increase during the previous intraday session. The Bollinger bands are at their widest in more than a year as the asset sees massive price swings. The metric maintains the trend, indicating further swings.

Nonetheless, TRX saw massive buying volume, as indicated by the relative strength index. It broke above 72, peaking at 93 on Tuesday. The altcoin was overbought and due for corrections. The ongoing price decline is a result of peak buying volume and a rapid change in traders’ sentiment. RSI is below 70 at the time of writing.
The bulls struggle to maintain the uptrend amidst growing bearish sentiment. Tron gradually loses momentum, with prices following. The average directional index continues upward despite unfolding trends. It shows notable bullish attempts at resuming the upticks.
The pivot point standard shows the asset barrelling towards a critical level. It lost the fifth pivot resistance earlier and the fourth pivot resistance a few hours ago. It edged closer to the third pivot resistance at $0.30 but rebounded.
Fibonacci retracement level points to significant demand concentration at $0.31, hinting at a higher chance of the downtrend halting around this mark.
EOS Surges Higher
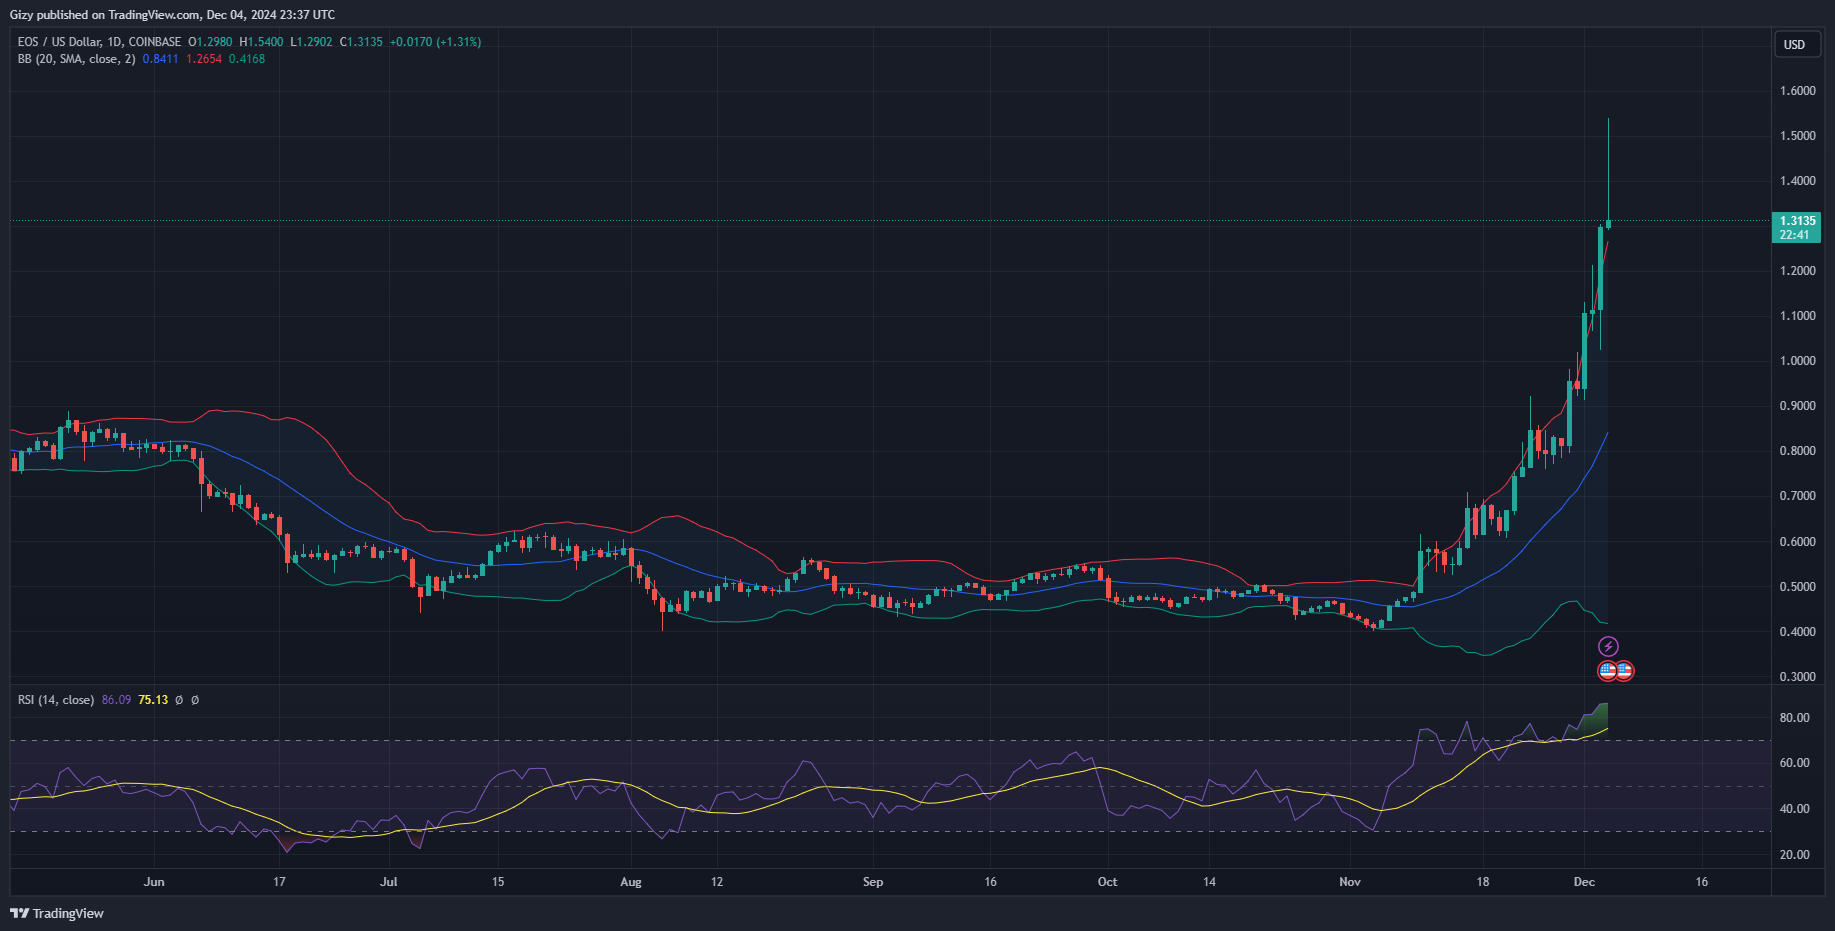
EOS resumed its surge barely a day after Arthur Hayes accused it of vanishing in one of his articles. The one-day chart shows it has been on a steady climb. It had a short burst during the previous intraday session, recovering from a dip to $1 and surging above $1.20. The asset peaked at $1.30 and closed with gains exceeding 16%.
The altcoin attempted to continue the trend during the current intraday session with notable success. It shot up as the bulls continued the buying pressure, pushing prices above $1.35 for the first time since 2022. It continued upward, breaking $1.50 and peaking at $1.54.

EOS is on a downtrend after breaking the critical level. It experienced a massive increase in selling volume that resulted from traders taking profit. It is closer to its opening price as the bulls failed to halt the downtrend. The Bollinger bands are at their widest in more than a year as the asset sees massive price swings. The metric maintains the trend, indicating further swings.
RSI hints at the asset seeing a possible correction in the coming days. It is at 86 at the time of writing, the highest level this year. Currently overbought, it is due for massive corrections. The average directional index continues upward despite unfolding trends, hinting at a higher chance of the cryptocurrency surging higher.
