SUI had massive increases during the previous week as it crushed several resistance levels, hitting a new high. The massive increase resulted in many drawing a parallel between its current price trend and Solana’s 2023 run.
A close look at crypto top 100 shows that the highlighted cryptocurrency is not the only beneficiary from the significant bullish sentiment in the market. The ranking was almost completely green on the weekly scales as other assets surged. The global cryptocurrency market cap hit $2.23 trillion in reaction to the trend.
The rate cut last week set the perfect tone for the massive uptrends many traders anticipated. Several key events are slated for this week, including the release of the former Binance CEO from prison.
Will the fireworks continue over the next six days?
Top Five Cryptocurrencies
BTC/USD
Bitcoin experienced significant increases during the previous week. It registered gains exceeding 7% on the weekly scale and several levels to the bull’s delight. A bearish start saw many lose hope, but not for a long time, as news of the impending rate cut brought positivity to the market.
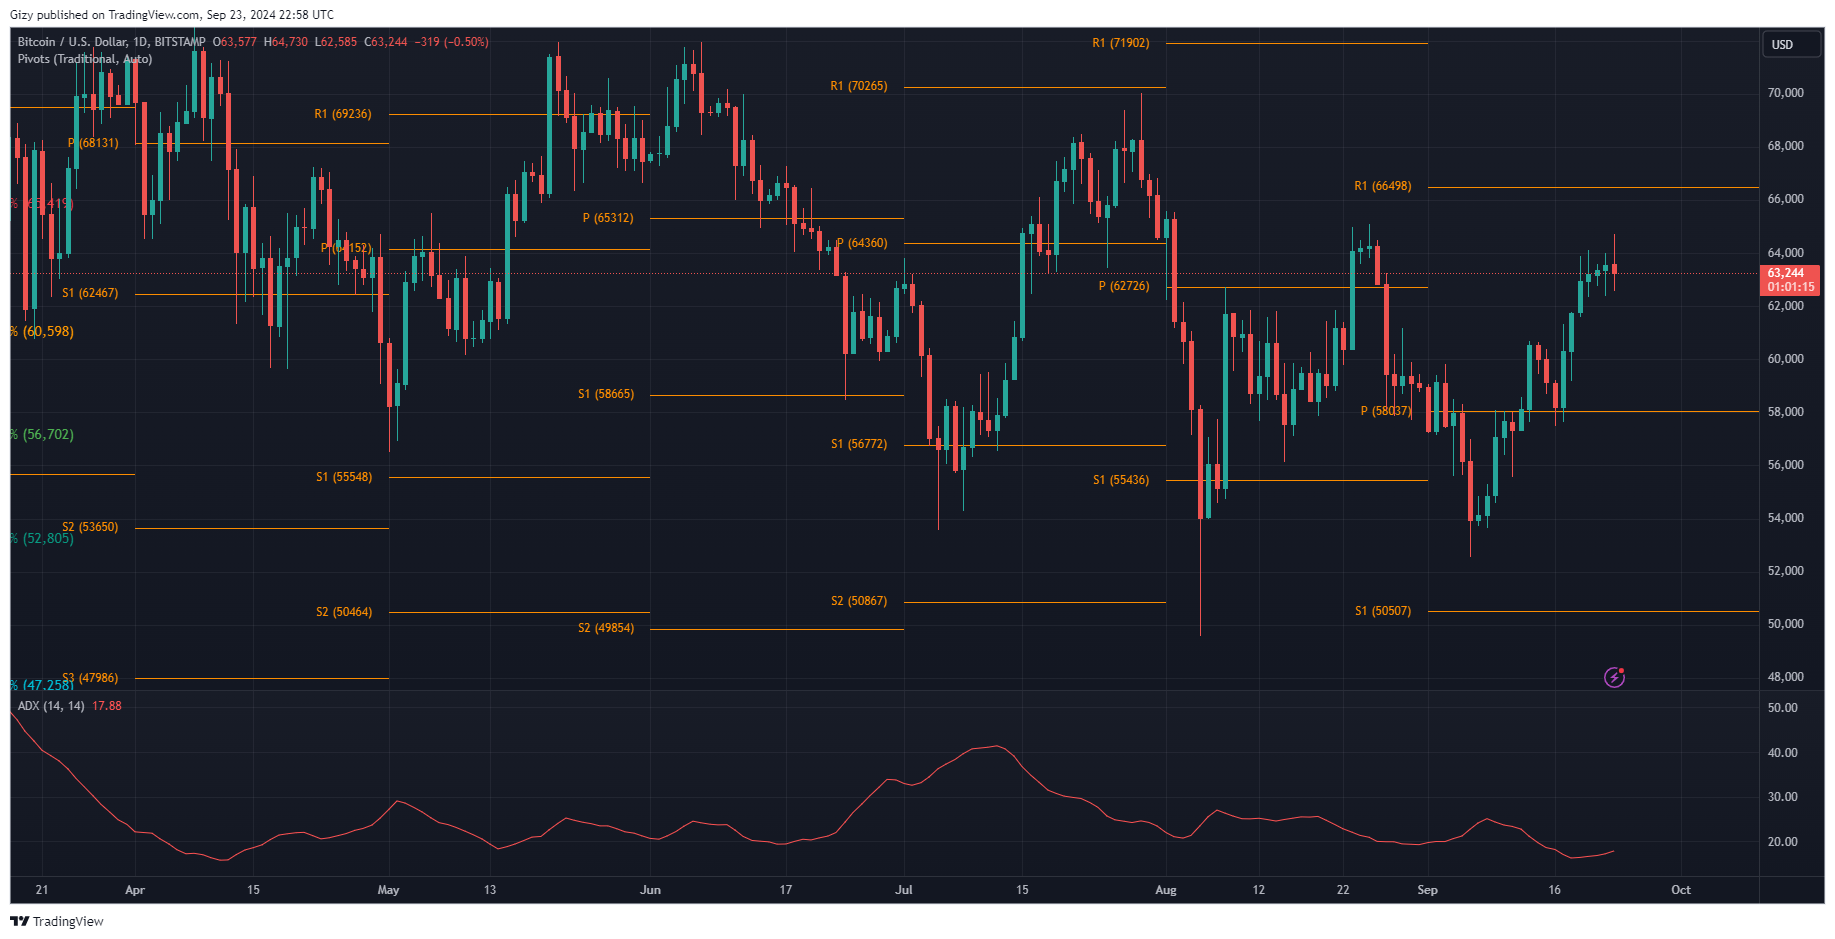
The apex coin retook $60k and continued upwards, breaking $62k. It briefly broke $64k for teh first time since August on Friday. However, it failed to sustain the surge, resulting in further retracement and close at the opening price.
The same trend is present today. BTC was off to a good start in the early hours of the morning UTC, retaking the highlight mark and surging. It sparked hopes of a return to $65k as it peaked at $64,700 but retraced to a low of $62,500. At the time of writing, it is still struggling to balance price in this region.
Currently printing a red candle, fears of further retracement looms. The momentum indicator is on the decline as it shows less bullish power from the bulls to continue the uptrend. This is also the same reading on the ADX. The asset may fall as low as $60k.
While both metrics point to an impending decline, it is important to bear in mind the bullish event lined up for this week. BTC may resume its uptrend like it did last week. These catalysts may send it to $60k.
XRP/USD
XRP failed to surge last week. Many blame the previous gains it had two weeks ago that saw it register positive changes of over 7%. This may be the case as the bulls are exhausted. Nonetheless, it gained almost 3%.
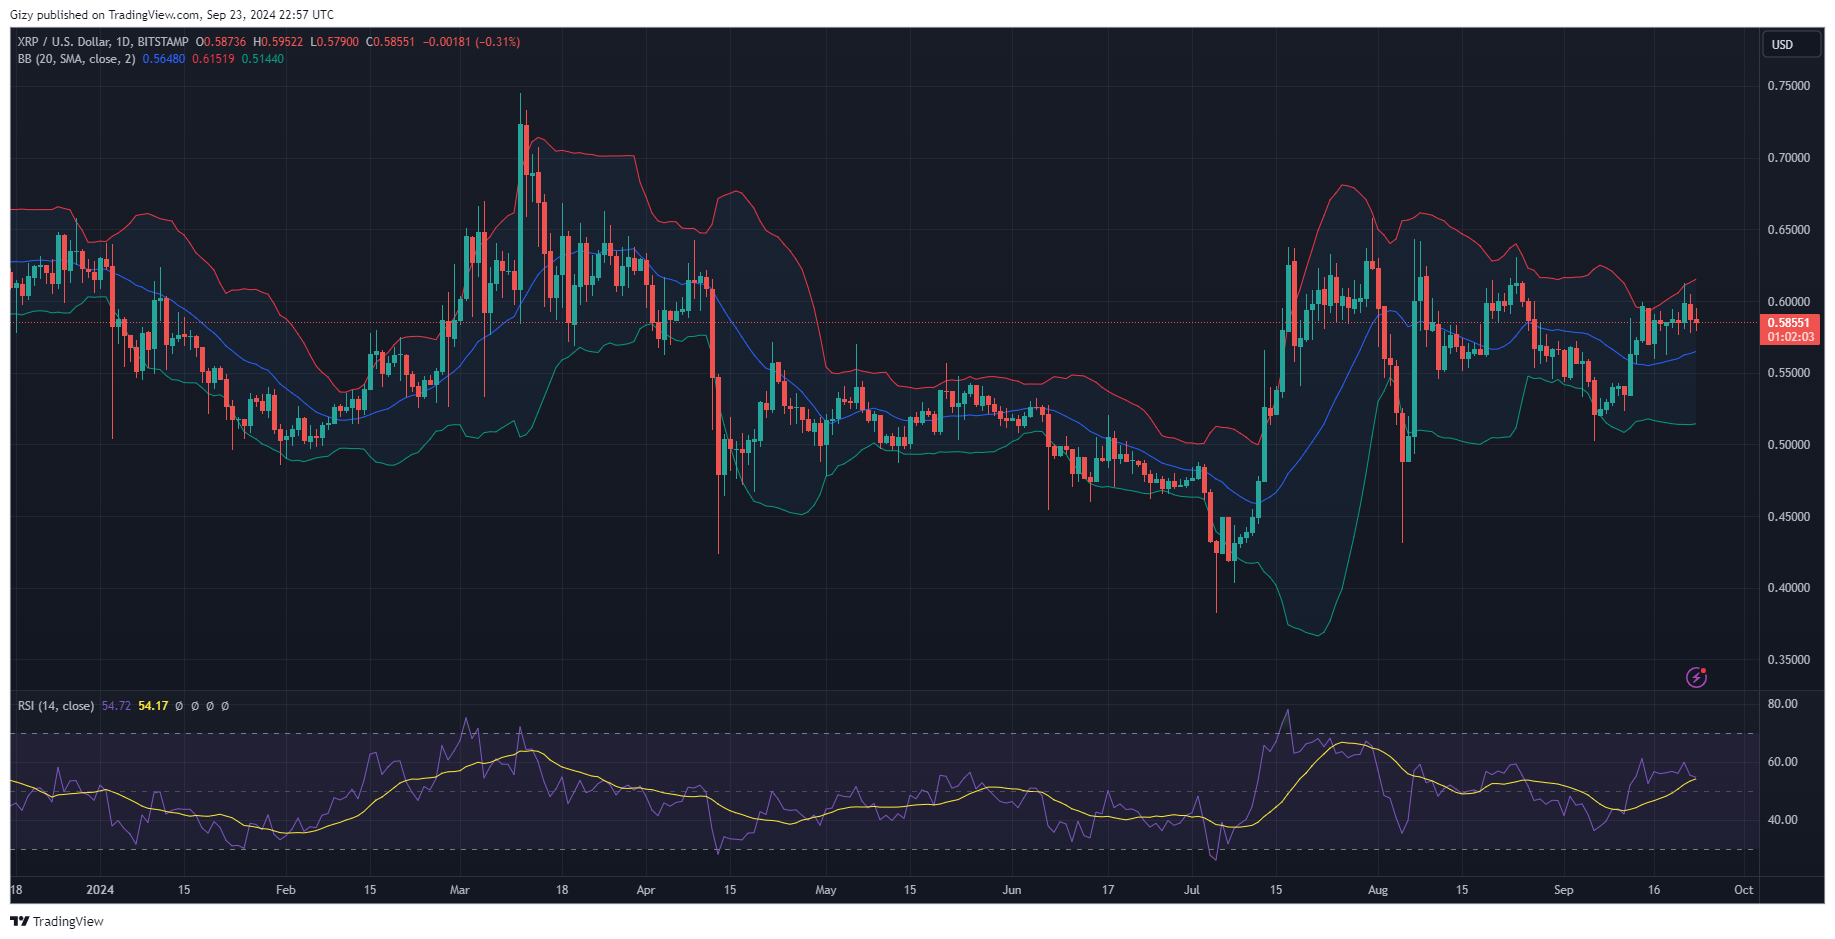
A key highlight of the session was on Saturday when the asset started trading at $0.58 but experienced massive buying pressure, resulting in a surge to flip the $0.60 resistance. It’s flipping this critical level for the first time since August. Additionally, it peaked at $0.61.
XRP has been bearish since this price action and printed red candle during the previous intraday session. Currently doing the same today, the momentum indicator suggests that the decline may continue. The relative strength index is also stagnant, indicating no significant pressure from the bulls.
The altcoin will retrace, losing the $0.58 support of the bulls fail to resume the uptrend. Such slip may result in the asset retracing as low as $0.56. Nonetheless, the Bollinger bands suggest a rebound around this mark.
The highlighted metric also suggests that the altcoin may resume its uptrend. It may react to fundamentals and surge. The bulls will look to push prices closer to the first pivot resistance at $0.66.
NEAR/USD
Near protocol saw significant increases last week. The asset closed the previous intraweek session with gains exceeding 12% as it edged closer to its first pivot resistance. It reclaimed its pivot point and continued upward, ending the session at $4.52.
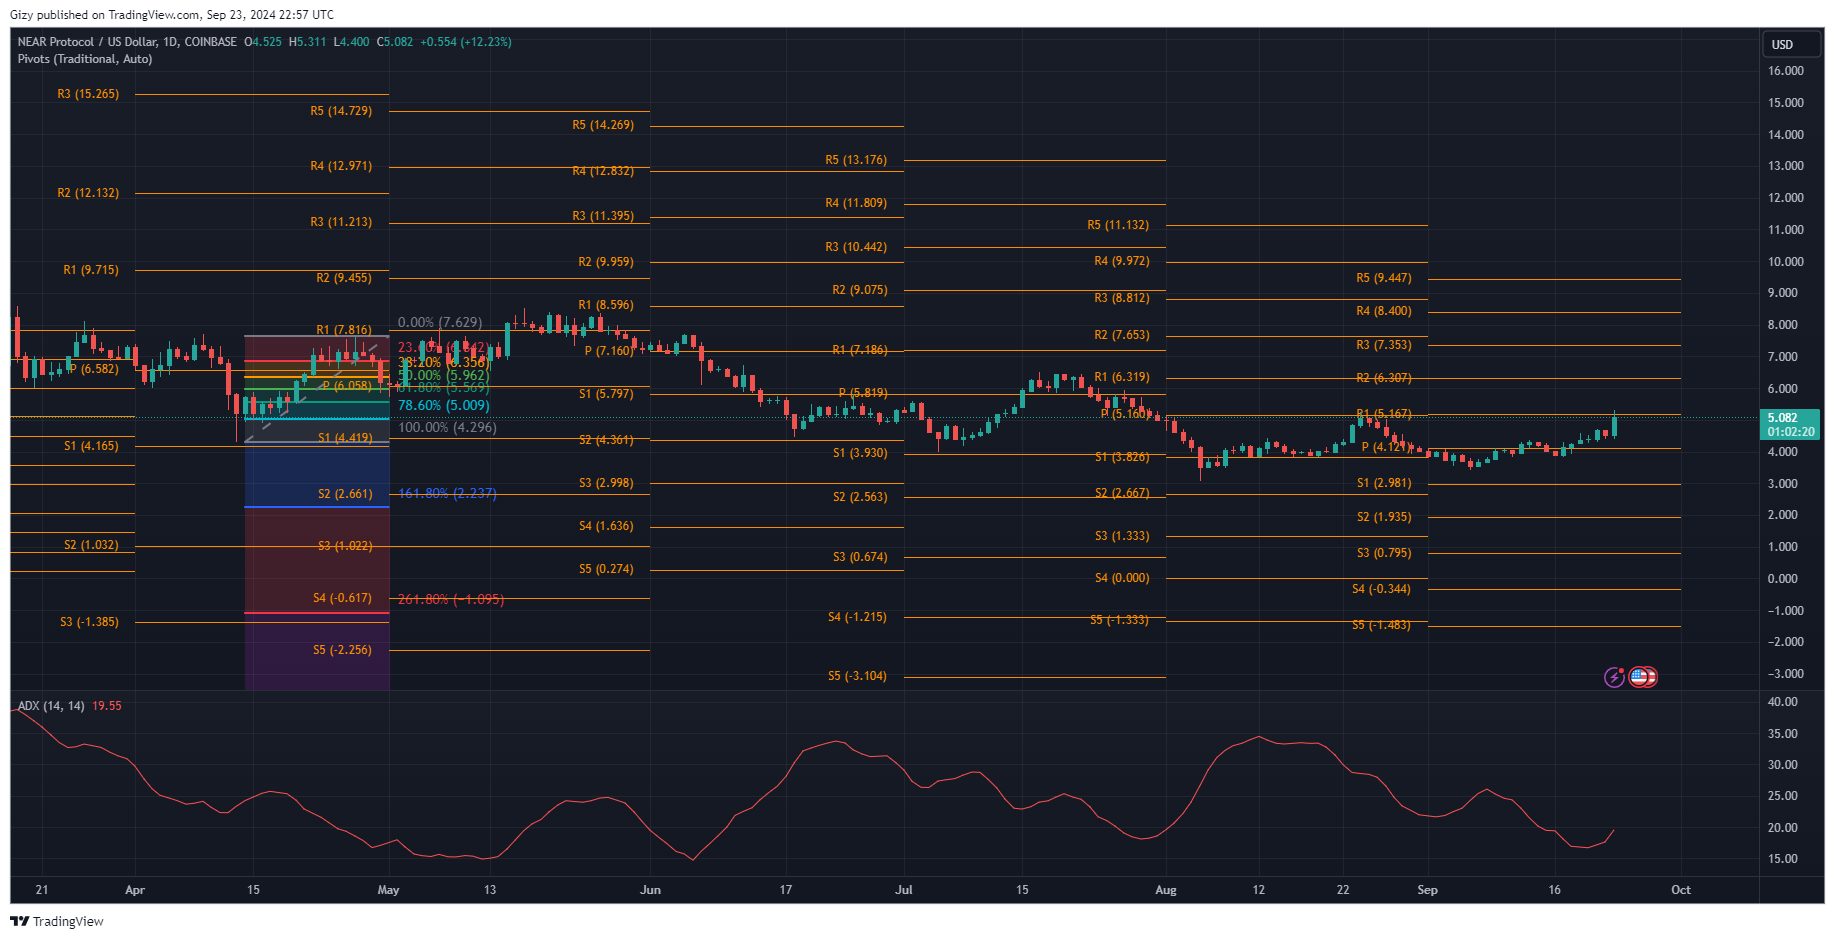
The altcoin has resumed its uptrend and gained all of what it recorded last week in a single day. It opened trading at $4.52 but saw significant price increases that saw the price surge. As a result, it broke the $5 mark and continued, peaking at $5.13. Currently up by over 13%, the cryptocurrency is exchanging close to its R1.
Based on price movements, NEAR may see significant declines this week. A closer look at the previous movement shows a possible change in price trajectory after such a massive single-day hike. The dominant feature of this pattern is that the asset sees another notable surge after the first before the downtrend starts.
If that happens this week, the asset may retrace as low as $0.47. It remains to be seen if the downhill movement will end there. The bulls must defend this critical mark or risk further drop to $4.30. On the other hand, there are chances that the asset may see further uptrends. It may retest $6.
SUI/USD
SUI is printing its first red candle in over a week. The decline started after a failed attempt at $1.70. Nonetheless, it peaked at $1.64 before retracing. It is currently trading at 3% lower than it started the day.
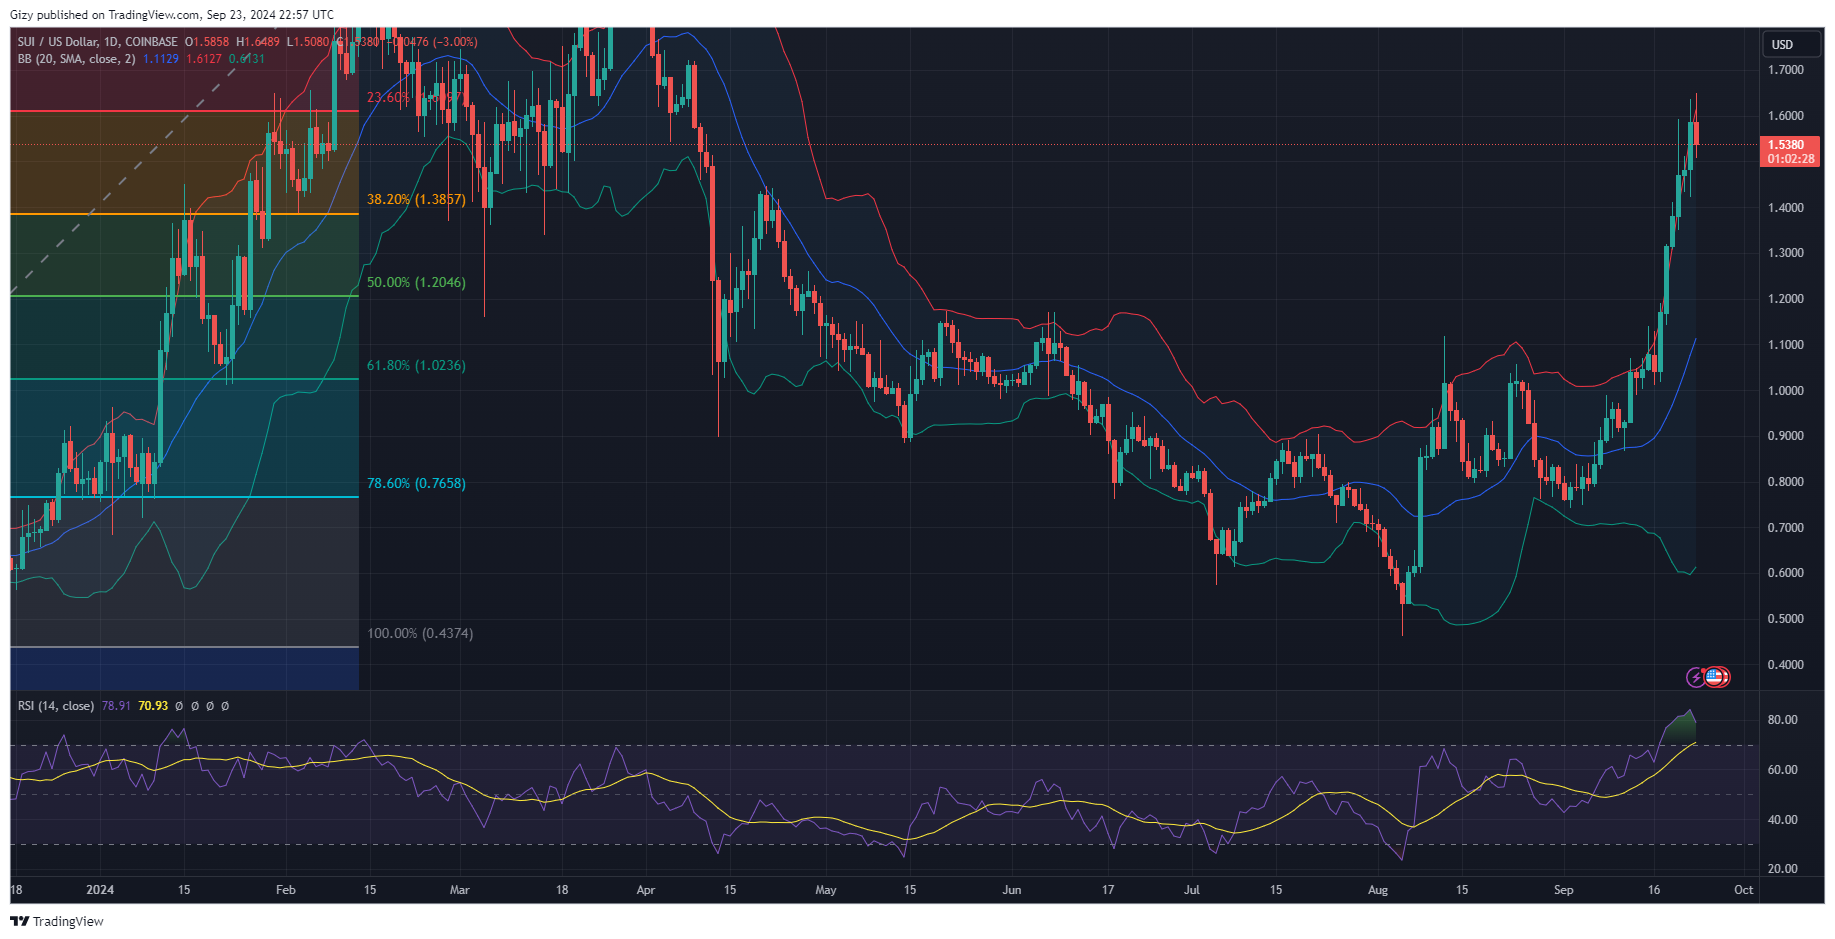
The analysis of the one-day chart shows a few bearish signals. One of these relates to the Relative Strength Index (RSI), which is at 79—an obvious overbought level since downtrends end at about 75, and overbought is initially set at 70 at the onset.
A lower time frame analysis over the last 24 hours shows that the bulls appear to be losing patency. Note that prices did not cross back above $1.70, and each time an attempt to break out was made, the asset recorded a lower low than the previous day.
SUI may attempt to target the $1.70 resistance; however, this is still far from stone as it is highly uncertain. On the contrary a further drop is probably what the market will favor as Fibonacci levels extend their time span and big buyers appear around the 38% which is $1.38.
