AXS bulls are pushing back against the massive declines that ravaged the asset over the last four days. It remains to be seen if the effort will yield results. However, the trend mirrors what most cryptocurrencies are experiencing.
One such is DOGE. It may close the day with significant changes following a significantly bullish performance. It opened trading at $0.151 but surged after a slight decline. Currently exchanging at $0.159, it is up by over 5% and may flip $0.160.
Raydium saw a similar push by the bulls, surging to a high of $3.33. The buyers failed to sustain the momentum, resulting in the asset retracing to a low of $3.28. Amidst the growing bullish effort, it prints a red candle.
The crypto market saw a 10% increase in trading volume over the last 24 hours. However, this did not reflect in its valuation, as it lost almost 3%, dipping to $2.22 trillion.
The fundamental scenes are filled with fresh accumulations and traders becoming millionaires. One such news is the surge of the memecoin Pnut, which soared to over $120 million in market cap. Onchain data shows that some traders took profit and made millions.
Top Four Cryptocurrencies
BTC/USD
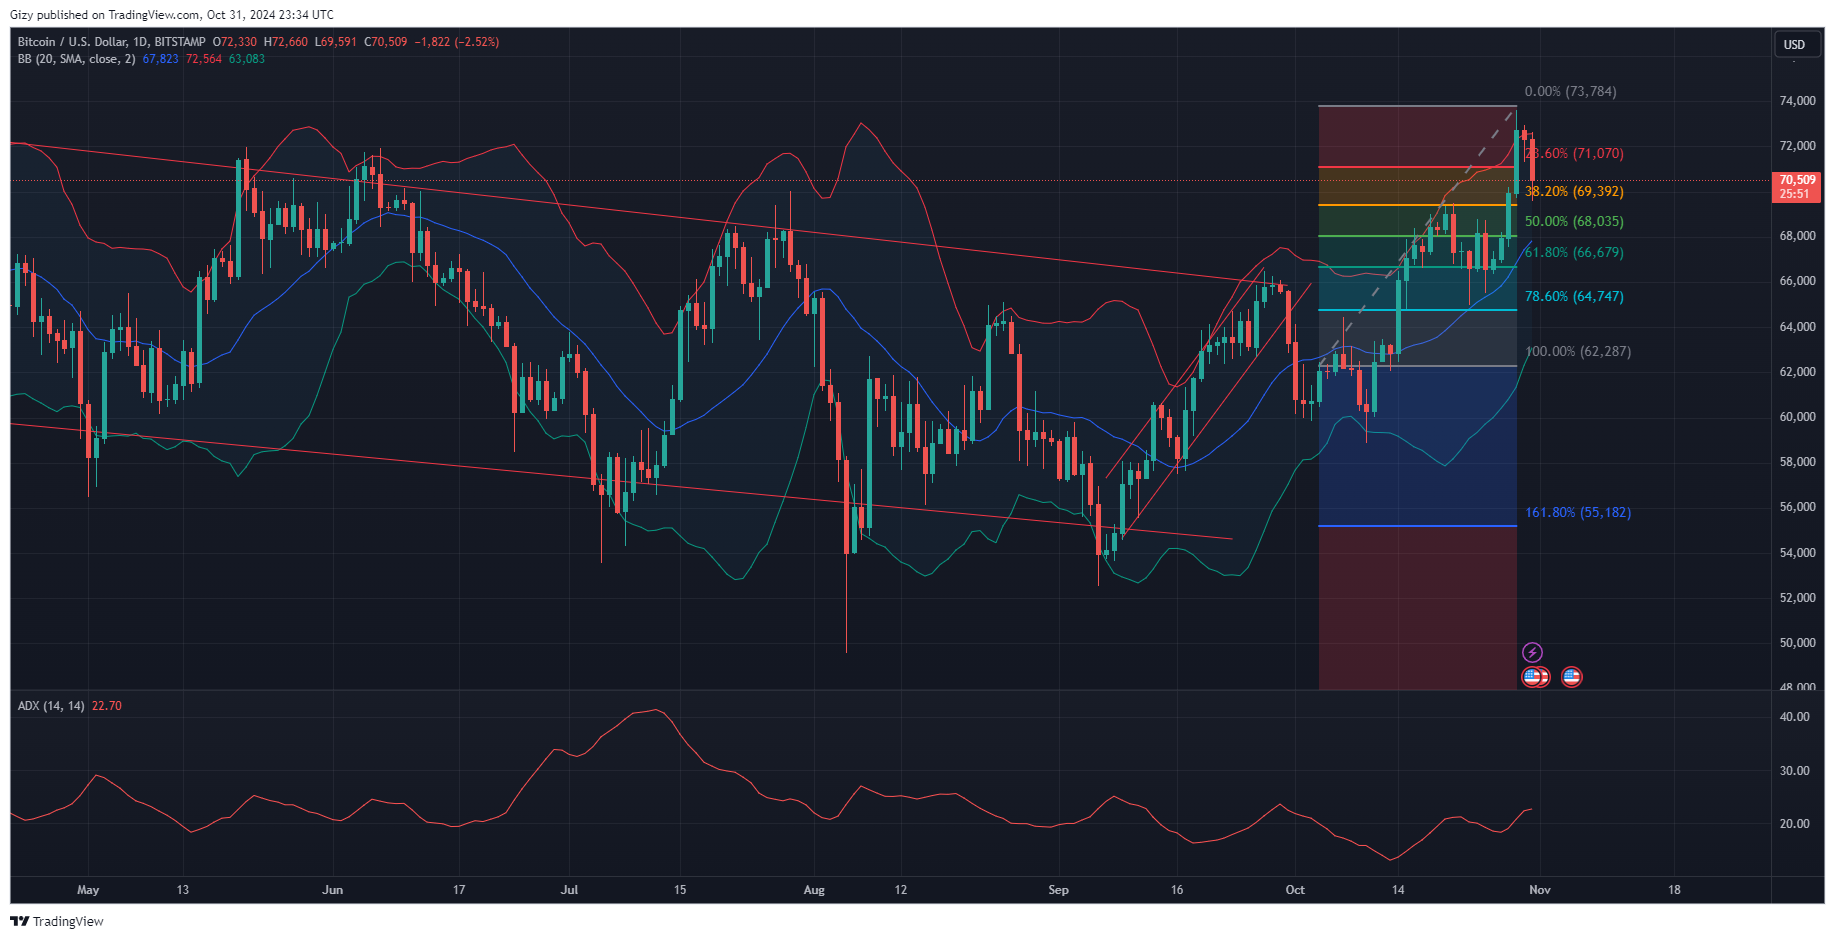
Bitcoin has been accumulating over the last four days. Despite declining value, some whales bought over $197 million worth of the asset. These traders’ optimistic outlook may not be far from realization, as current prices suggest possible surges this week.

BTC started the day at $68,738 and reclaimed $69k, peaking at $69,400. Due to massive rejections, it retraced, reaching a low of $67,208. It is down by almost 8% amidst attempts at recovery.
The apex coin remains locked in a downtrend that started five days ago after it edged closer to its ATH but failed to flip it on the BTC/USD pair. It hit a high of $73,600 before corrections. However, the one-day chart shows it has not registered a green candle since then.
Bitcoin lost almost 8% over the last six days, and indicators point to possible rebounds. The moving average convergence divergence displayed a bearish divergence during the previous intraday session, which may mean further decline.
Traders have yet to stage a comeback as selling pressure mounts. The relative strength index dropped to 49 due to the massive decline in buying volume. The accumulation/distribution chart mirrors this move, showing excess supply.
However, previous price movements hint at an impending change in trajectory. The Fibonacci retracement level shows the apex coin trading at the 61%. It previously rebounded off the $66k support more than once and may do so again.
On the other, it may dip to $64k if the bulls fail to defend the critical barrier.
ETH/USD
Ethereum will receive several upgrades in the coming days. It saw fresh integration over the weekend. UBS will utilize the blockchain to tokenize some assets, making them more accessible.

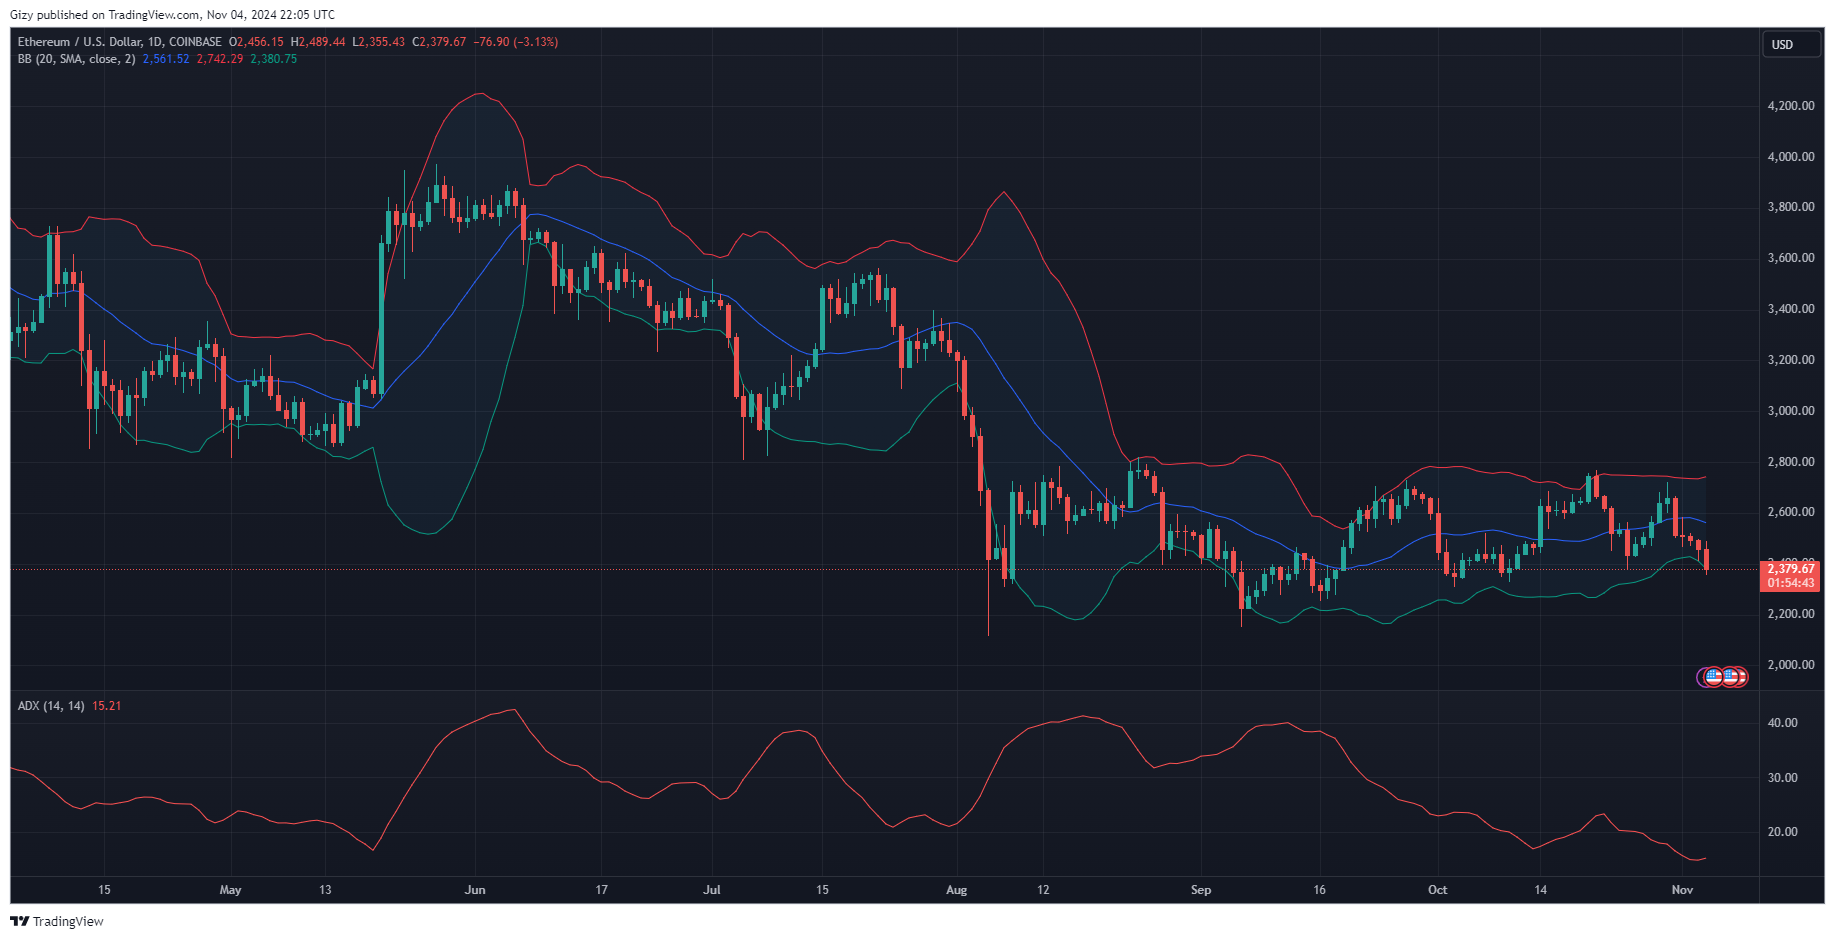
However, the latest development failed to impact prices as the market continued its downtrend. It had one of its biggest days on Friday when it opened trading at $2,658 but dropped and rebounded off the $2,500 support. Due to its failure to recover, it lost over 5%.
The decline is ongoing, and ETH has since lost almost 10%. It’s currently declining and has hit a fresh low. It dropped to its lowest in the last ten days after starting the day at $2,456 but dipped to $2,404. It rebounded off the $2,400 support. However, indicators point to further declines before the uptrend resumes.
MACD displayed a bearish divergence a few days ago. The bearish signal continues as the 12-day EMA hits fresh lows and the histogram’s bars increase in length. RSI is declining due to intense selling pressure.
Nonetheless, the Bollinger band shows a trend reversal may be at hand. The apex altcoin is trading above the lower band and may break out if the downtrend continues. Such action will result in the asset resuming its uptrend. ETH may retrace below $2,400 before this happens.
ENA/USD
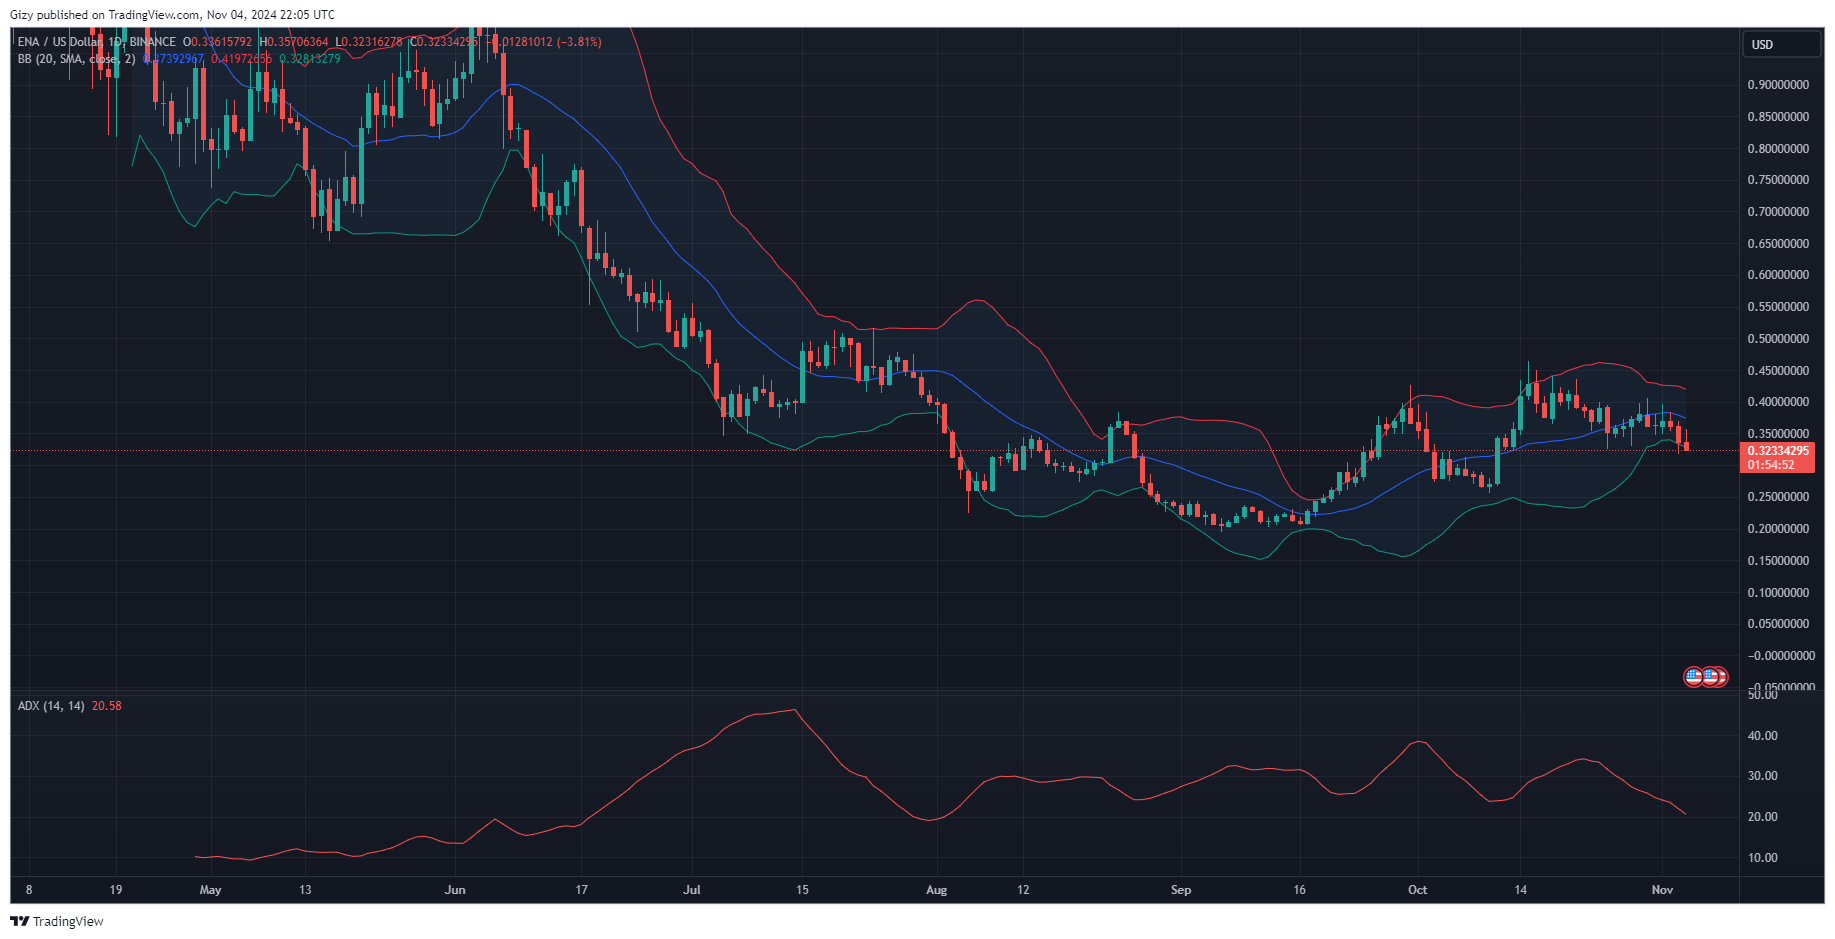
Ethena was bullish in the short term but failed to sustain the surge. It started the day at $0.33 and surged to a high of $0.35. It faced massive rejections, retracing to its opening price. Currently down by almost 2%, it may conclude another day with significant losses.

It reclaimed the $0.40 barrier on Tuesday but has since registered notable declines. The first hit the next day, with ENA losing over 4%. Despite small attempts at recovery, it has since lost over 11%.
Indicators do not show signs of a change in trajectory. The moving average convergence divergence continues its descent. The relative strength index is at its lowest in almost a month. It dropped to 42 and may continue downward if trading conditions do not improve.
Nonetheless, the Bollinger band point to an impending change in price trajectory. ENA is trading a little above the lower band after it dropped below it during the previous intraday session. Previous price movement suggests that the asset is due for a rebound.
Ethena may retest the $0.32 barrier and slip further to $0.30 in the next six days. There is a chance it may surge, breaking above $0.36.
AXS/USD
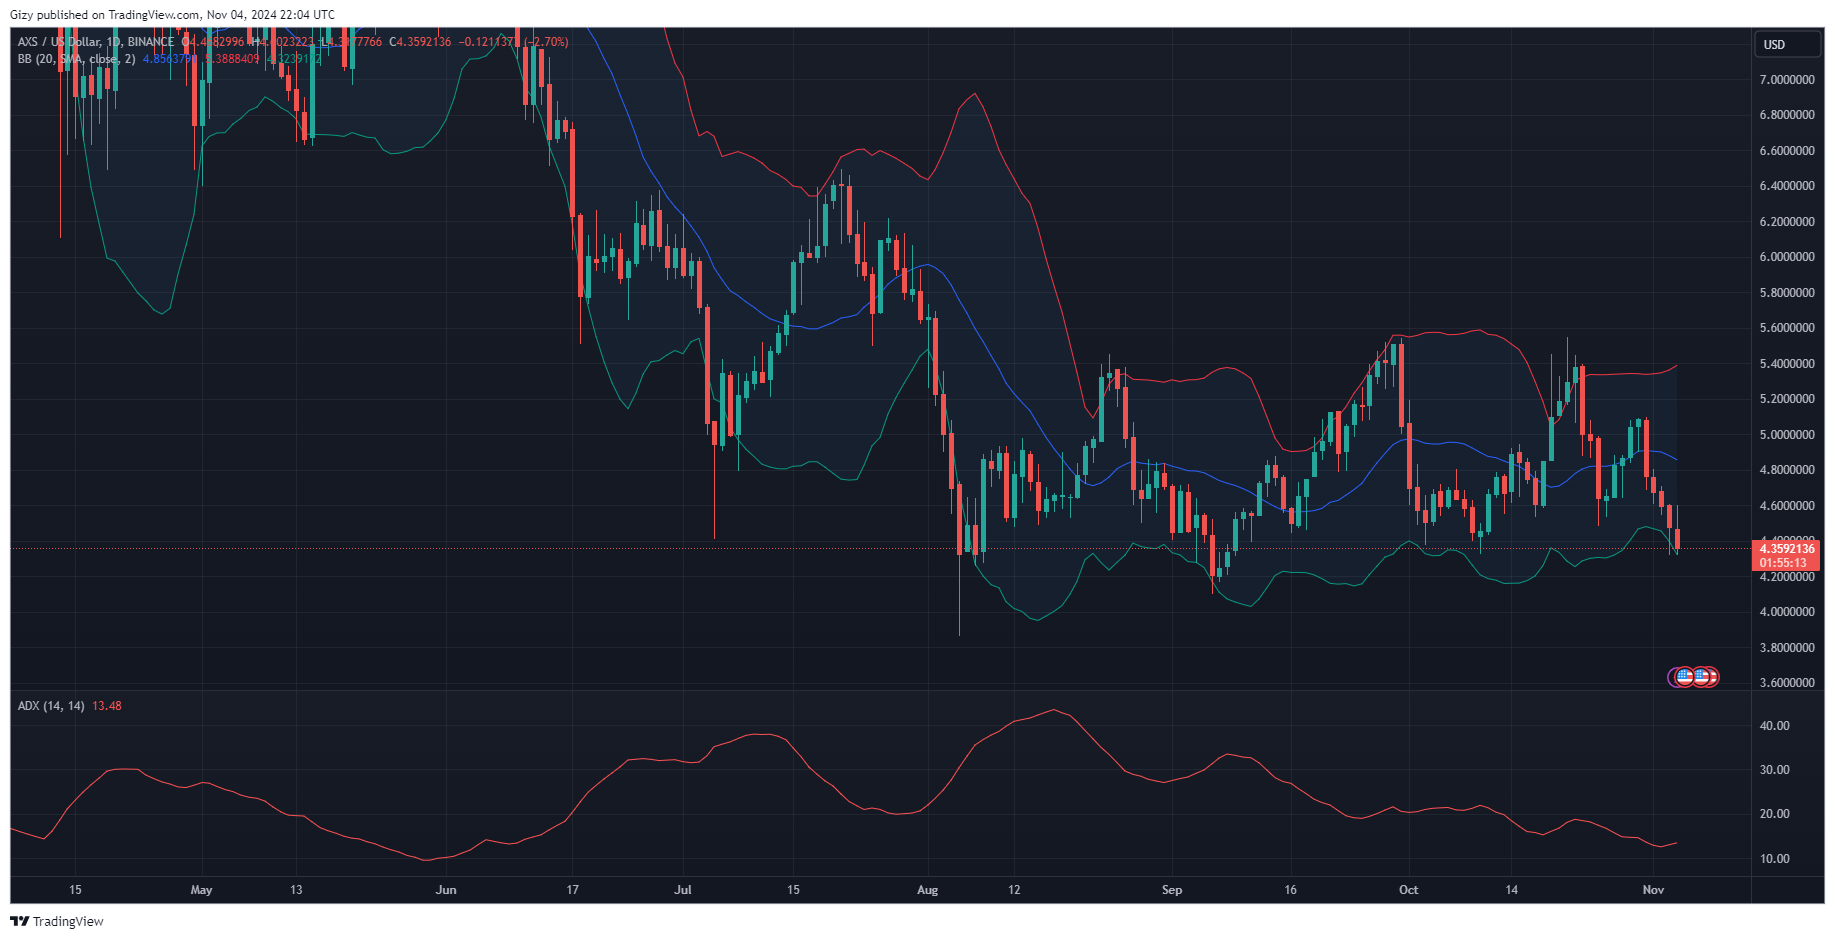
Axie Infinity ended its five-day surge on Wednesday after it peaked at $5.10. The bullish period ended with almost 10%. However, it lost all the gains following several declines. One such happened on Thursday when it dropped from $5.08 to a low of $4.68. It closed with losses exceeding 6% after small attempts at recovery.

The downtrend is ongoing, and AXS is down by almost 3%. It revisited the previous day’s low after it surged to a high of $4.60 earlier.
The consistent decline significantly impacted indicators. MACD continues printing sell signals after its divergence on Friday. Its histogram bars are nearing October lows. The relative strength index is also bearish as selling pressure mounts. It’s at 36 (the lowest since September). The accumulation/distribution chart shows massive supply and the bulls’ failure to soak it up.
The bollinger sheds a ray of hope amidst the selloffs. AXS is trading a little above the lower band after it dropped below it during the previous intraday session. Previous price movement suggests that the asset is due for a rebound.
Axie Infinity may retrace to $4 if it loses the $4.20 barrier. Nonetheless, it may rebound and hit $4.80 in six days.
