SUI may end the day as a top loser. The asset failed to surge despite positive fundamentals, one of which comes from the US.
The American soccer league, Major League Soccer (MLS), has declared its intention to enter the non-fungible token (NFT) market. It introduced the MLS QUEST on the layer-1 Sui blockchain in partnership with the Major League Soccer Players’ Association (MLSPA) and the sport-focused NFT platform Sweet.
Nonetheless, other altcoins see significant increases. One such is RUNE. It is up by almost 7% over the last 24 hours, surging from $5.31 and retesting its thirty-day high at $5.75. The candle shows the bulls struggling to contain the growing bearish actions.
AAVE and Bitcoin cash are up by over 3%. Aave succumbed to the selling pressure that started after it peaked at $160. The failed attempt at its seven-day high resulted in a massive decline that saw the asset drop to its opening price. BCH maintained its momentum as it edged closer to retesting a critical barrier.
A look at the moving average convergence divergence of most cryptocurrencies in the top 100 shows an ongoing bullish convergence. How will these assets perform this week?
Top Four Cryptocurrencies
BTC/USD
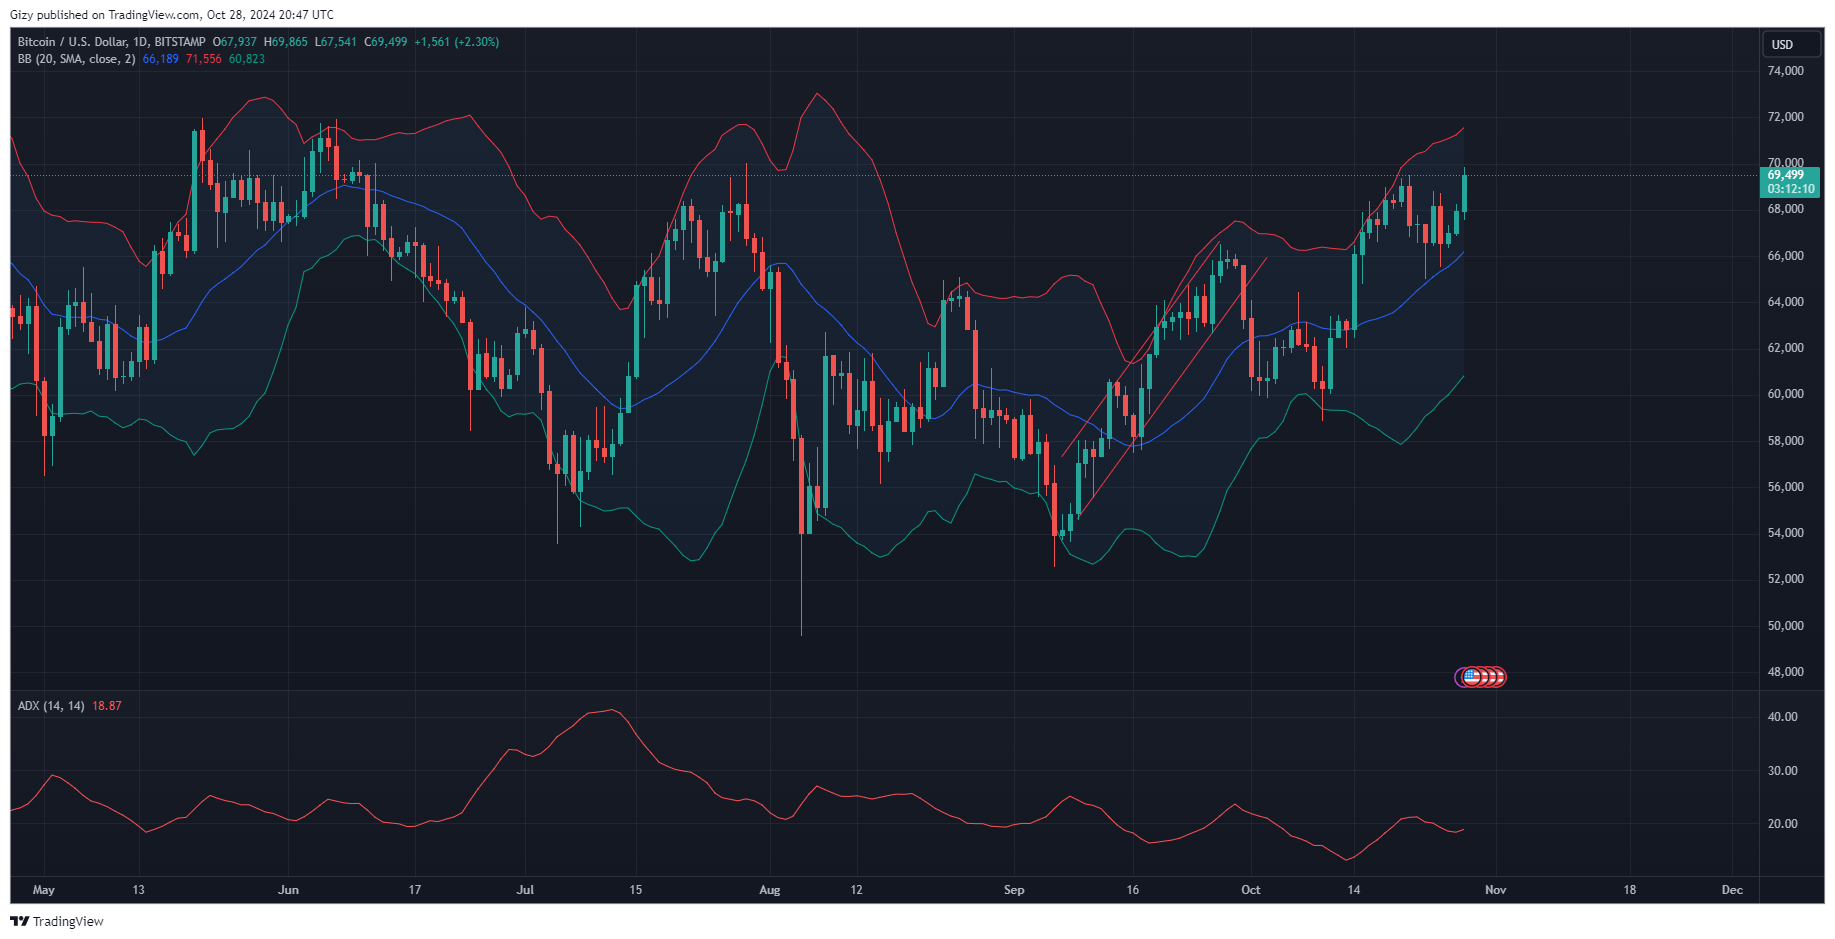
Bitcoin resumed its uptrend following last week’s slight decline. It lost almost 2% during that session after recovering from a dip to a low of $65k. The ongoing bullish action continues the trading actions over the last two days of that seven-day session.

BTC is gradually edging closer to retesting $70k, trading at $69,800 at the time of writing. Current price trends suggest that a flip is almost inevitable. The apex coin may close the day with gains of nearly 3% following the most recent flip of the $69k barrier.
Indicators like the average directional index and relative strength index are positive. The ADX rises as the bulls sustain buying pressure for three days straight. The RSI prints a similar reading: It’s at 65 after hitting a low of 55 last week.
The moving average convergence divergence is also positive, printing buy signals. A few hours after the 12-day EMA intercepted the 26-day EMA, the price trajectory moved upward. The Bollinger band shows the price edging closer to the upper band.
Whether the bulls can sustain the ongoing bullish trend remains to be seen. However, onchain data show massive positivities. One such is the declining exchange reserve, which indicates more buying. The Coinbase Premium is also positive, as traders in the US are flooding the crypto market.
ETC/USD
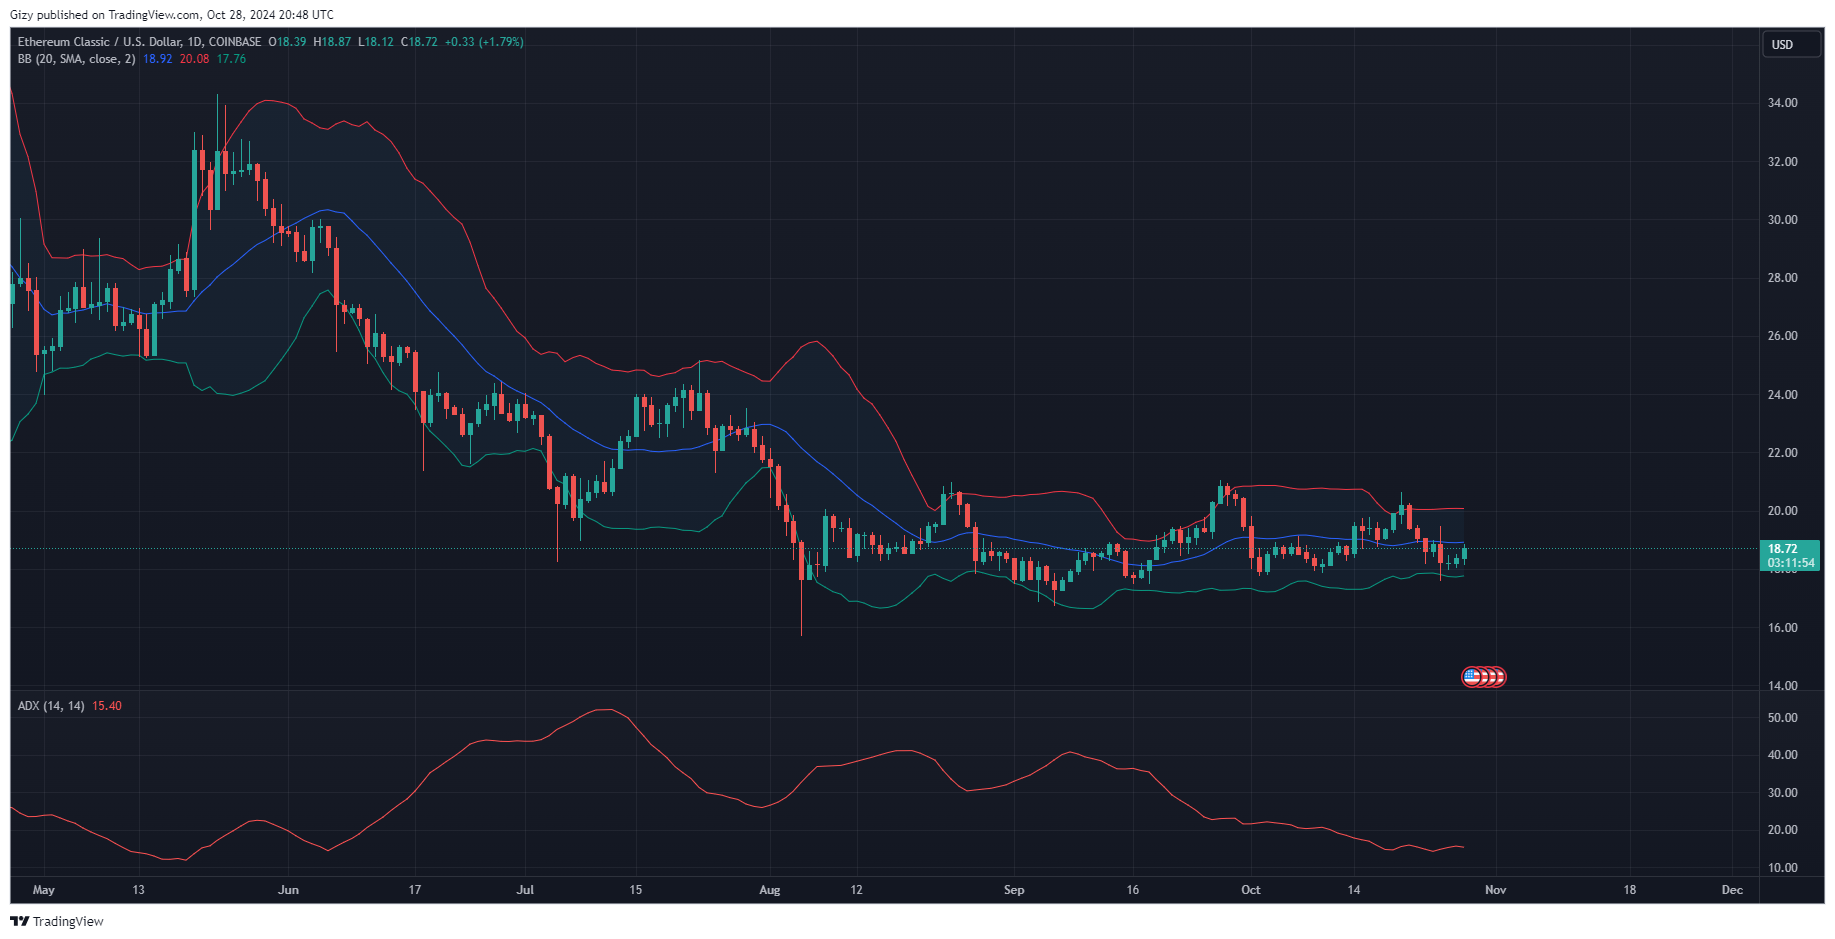
Ethereum Classic is on the uptrend following a massive decline during the seven-day session. The one-week chart shows that it lost over 8%, erasing gains it had during two weeks ago. The one-day chart shows the bears going on a rampage.

Trading actions on Friday show that the asset lost over 3% after it retraced from its peak at $19.4. ETC retraced to a low of $17.6 before rebounding. The last two days of the week were marked with significant increases as the buyer started a buyback.
The current day continues the bullish attempt, surging from a low of $18.1. Currently trading at $18.8, it will look to flip $19 before the week ends and indicators point to further price increases over the next six days.
The moving average convergence divergence is slightly positive due to the ongoing bullish sentiment. A closer look shows the 12-day EMA halting its downhill movement. If the buying pressure remains, it may start a convergence.
The relative strength index is also on an uptrend in response to the ongoing buyback attempt, resurfacing above 60. Nonetheless, the Bollinger shows room for more price surges.
ETC will look to reclaim $20 within the next six days. If the bulls sustain the ongoing trend, it may also attempt to retest the $22 barrier.
SUI/USD
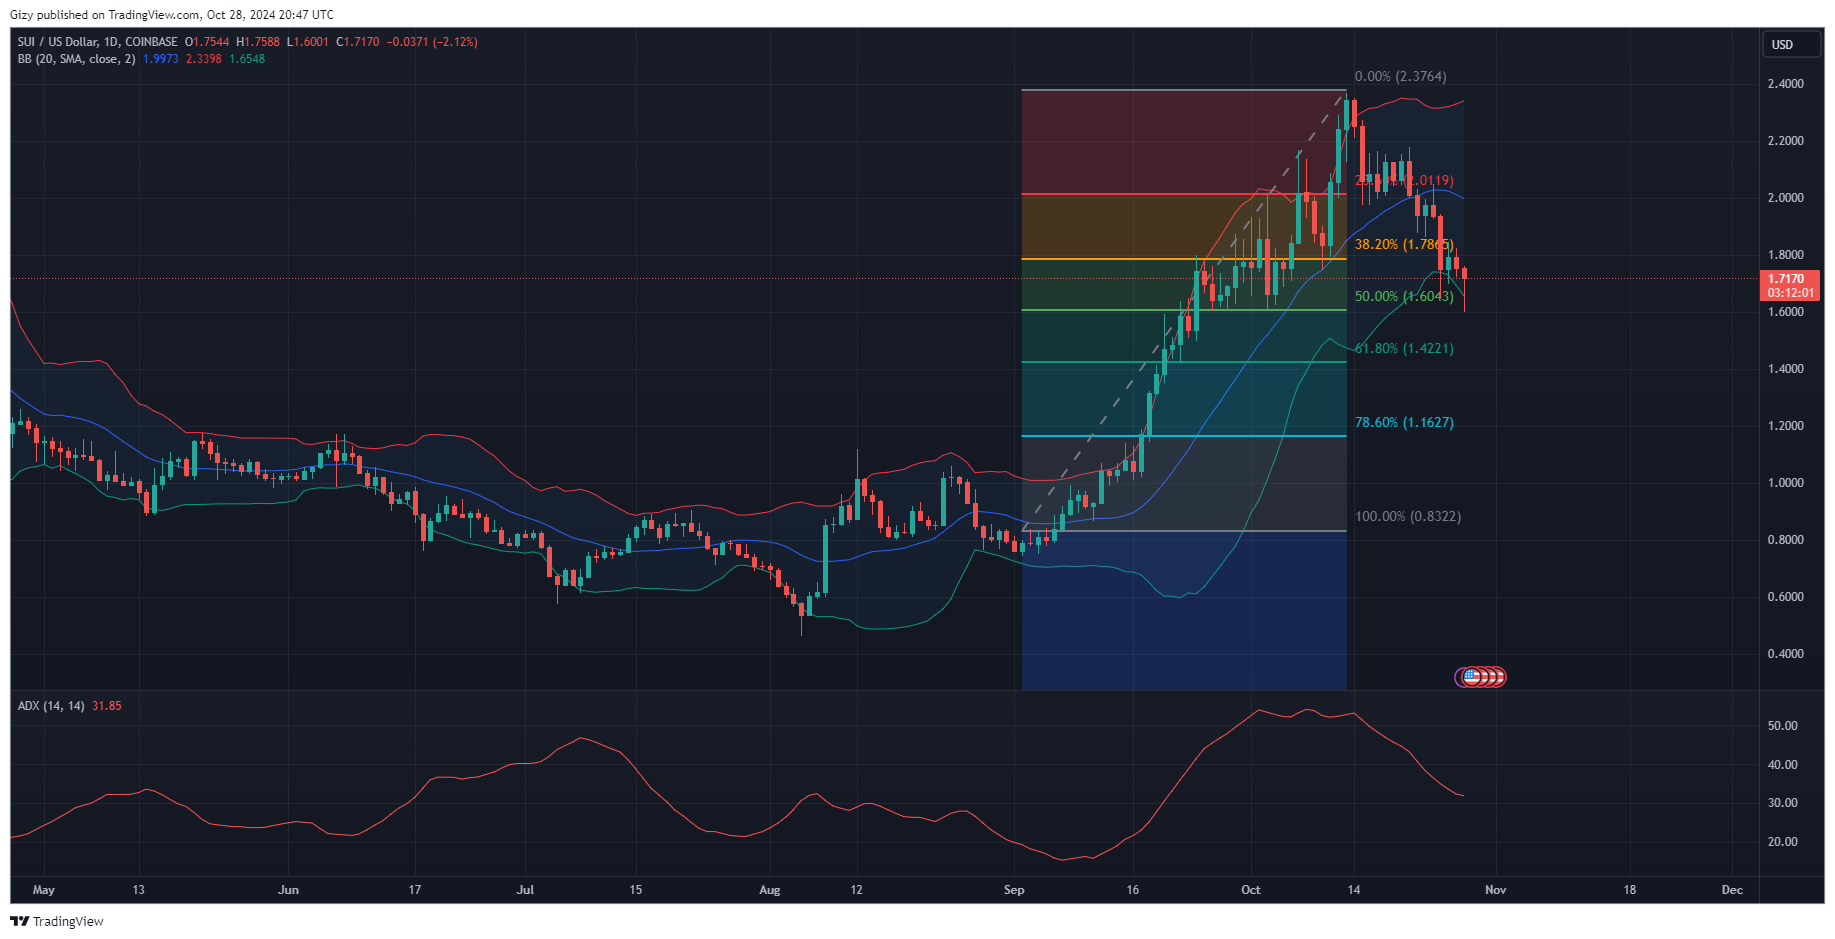
The previous week marked Sui’s second consecutive loss. It has lost all the gains it accumulated this month and is down by over 4%. It was one of the worst hit by the bearish sentiment on Friday. It opened trading at $1.93 but dipped to a low of $1.65. Although it rebounded, it lost almost 10%.

It has since failed to recover from the declines. Sunday closed with losses exceeding 2%, erasing Saturday’s effort.
The downtrend is ongoing, and SUI dropped to its lowest point in over thirty days. It rebounded at $1.60 as the bulls rallied the market. It is down by over 3% amidst the ongoing buyback.
However, indicators on the one-day chart show no sign of a trajectory change on the horizon. MACD is still on the decline, with both EMAs hitting new lows. RSI is at 40 as selling pressure continues to pile up, and the bulls have yet to stage strong buybacks.
SUI may become oversold if the downtrend continues. The Fibonacci retracement levels show that the asset rebounded off the 50% mark. It may continue the downhill movement, testing the 61% level before the week runs out. Nonetheless, a change in sentiment may send the price as high as $2.
BSV/USD
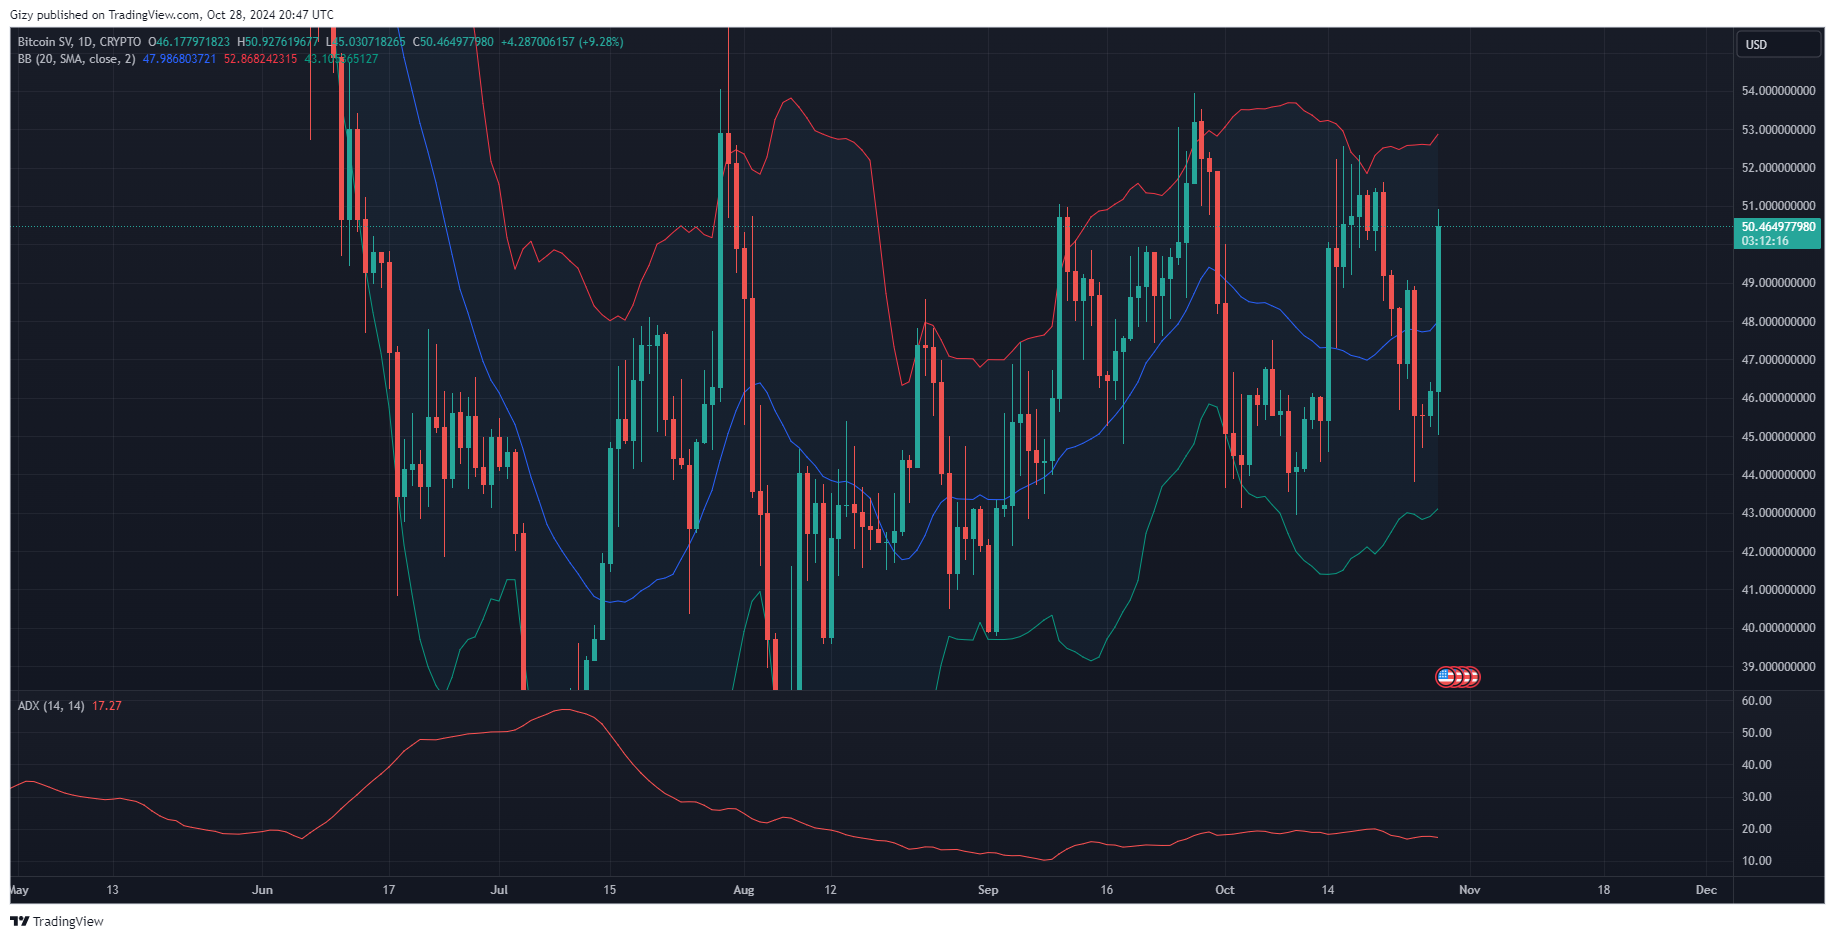
Bitcoin SV is printing one of its most extended green candles after a week of massive declines. The one-week chart shows it lost over 10% during the previous seven-day session. One of the biggest losses happened on Friday, opening trading at $48 and declining to a low of $43. It closed with losses of almost 7%

Currently trading at $50, the altcoin is over 9% higher than its opening price of $46. Trading volume increased by over 141% over the last 24 hours. Price action suggests that most of it is from bullish traders as they stock up.
The community is also very bullish about following price action as the climb above the critical mark bolsters confidence in more increases.
The moving average convergence divergence is positive due to the ongoing bullish sentiment. A closer look shows that the 12-day EMA has halted its downhill movement and is rising. If the buying pressure remains, it may start a convergence, intercepting the 26-day EMA.
The relative strength index is also on an uptrend in response to the ongoing buyback attempt, resurfacing above 60. Nonetheless, the Bollinger bands show room for more price surges.
BSV will look to reclaim $55 within the next six days. If the bulls sustain the ongoing trend, it may also attempt to retest the $60 barrier.
