BTC and the rest of the crypto market are seeing significant declines. The apex coin is down by a few percent and will continue the trend in the coming days.
The global cryptocurrency market cap is down by almost 3% in the last 24 hours as the bears took over. Traders are increasingly losing faith in the possibility of more uptrends as some take profit. The fear and greed indicator points to this change in sentiment, dropping to 56 after its recent spell above 60, which showed greed.
Assets like SHIB and WLD are among the top losers in the top 100, losing over 5% each. Many analysts warned about the pullback following the massive gains the crypto market reeled in last week.
Will the selloffs continue throughout the next six days?
Top Four Cryptocurrencies
BTC/USD
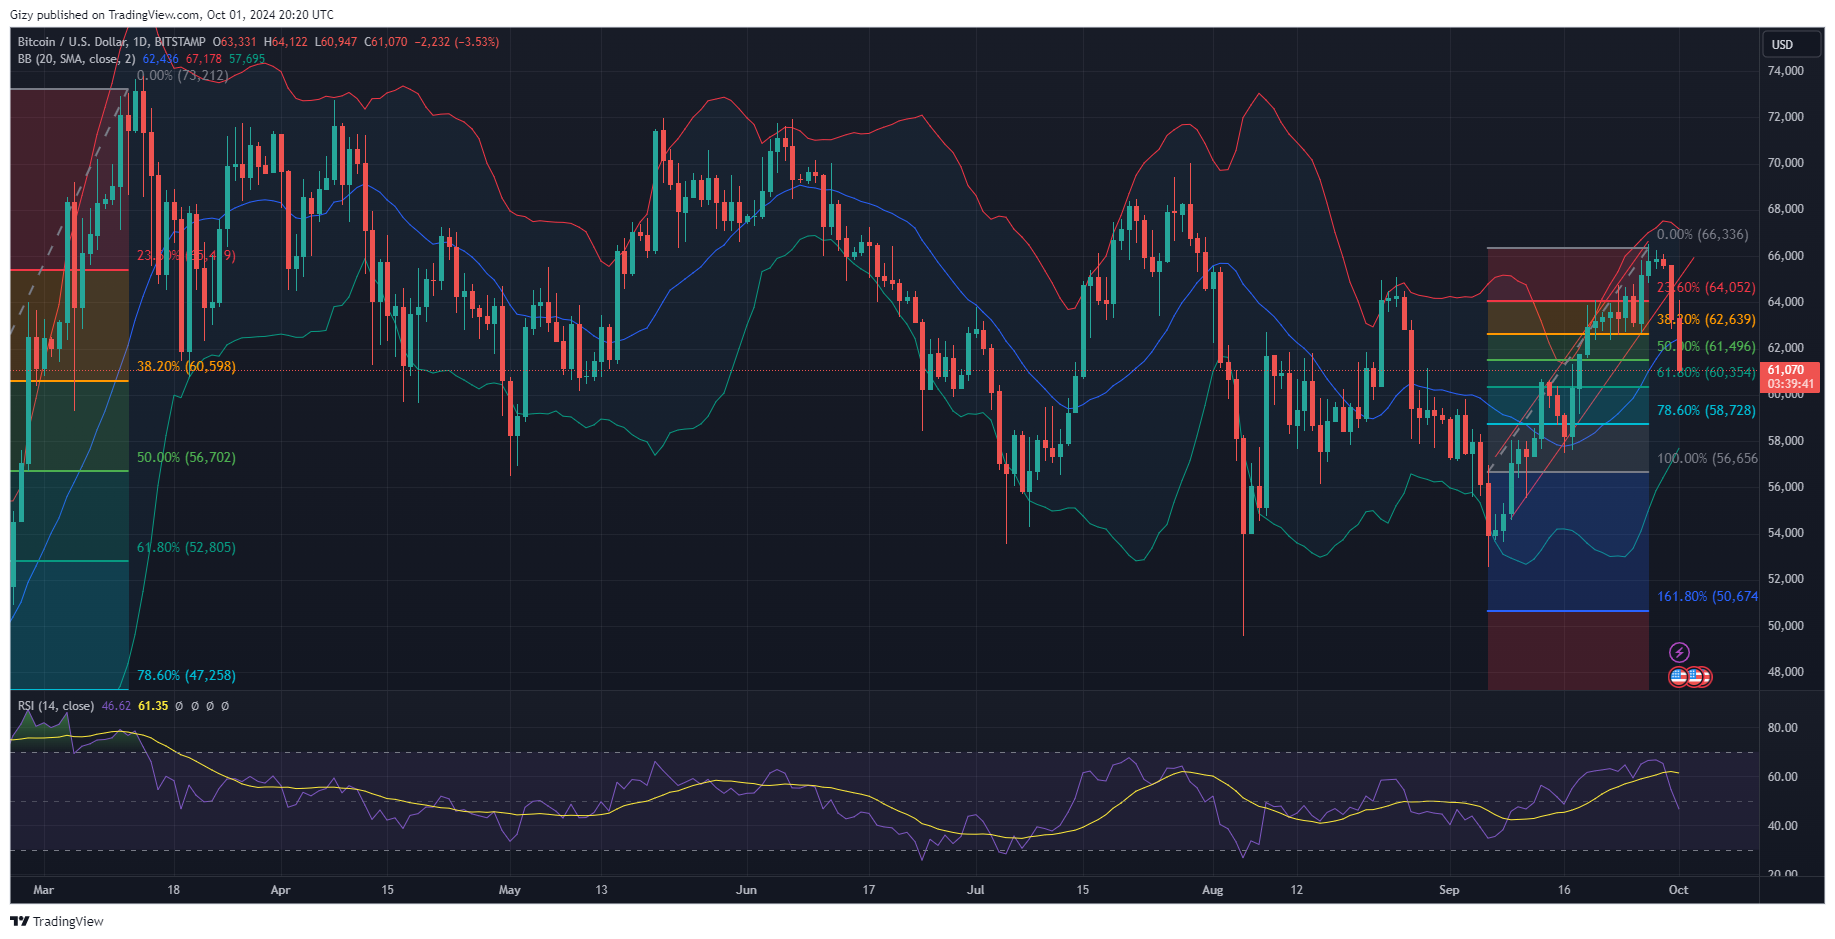
Bitcoin is currently printing its most extended red candle over the last three weeks. It started the day at $65,602 but failed to surge due to a spike in selling pressure. It succumbed to the immense pressure as prices plunged, flipping several levels. One such is the $64k support. The apex coin is trading at $63,500, an over 3% decline in the last 24 hours.

The previous intraday candle warned of what is unfolding today. On-chain data suggests that the reason for the current decline is low buying on ETFs. It also points to a drop in funding rates from two major regions, the US and Korea. The Coinbase premium and the Korea premium are negative.
However, spot traders remain moderately bullish as exchanges continue to see a significant decline in reserves. Exchange flow is also negative as traders move fewer assets to trading platforms. While this reading shines a ray of hope, the relative strength index remains overbought and blares warnings of an impending selloff.
The on-chart RSI is also declining in reaction to the bears’ latest moves. It dropped from 65 to 55 in less than 24 hours as the selling volume increased. The accumulation and distribution chart is declining as the bulls failed to soak up the excess supply.
With most indicators bearish, the apex coin may see more declines. Having lost the 23% Fib level, the buyers will look to defend the 38% Fib level at $62,600. There is also a considerable chance of further retracements that may send the cryptocurrency as low as $61k. It is also worth noting that prices may rebound if trading conditions improve. BTC may reclaim $65 before the week runs out.
BNB/USD
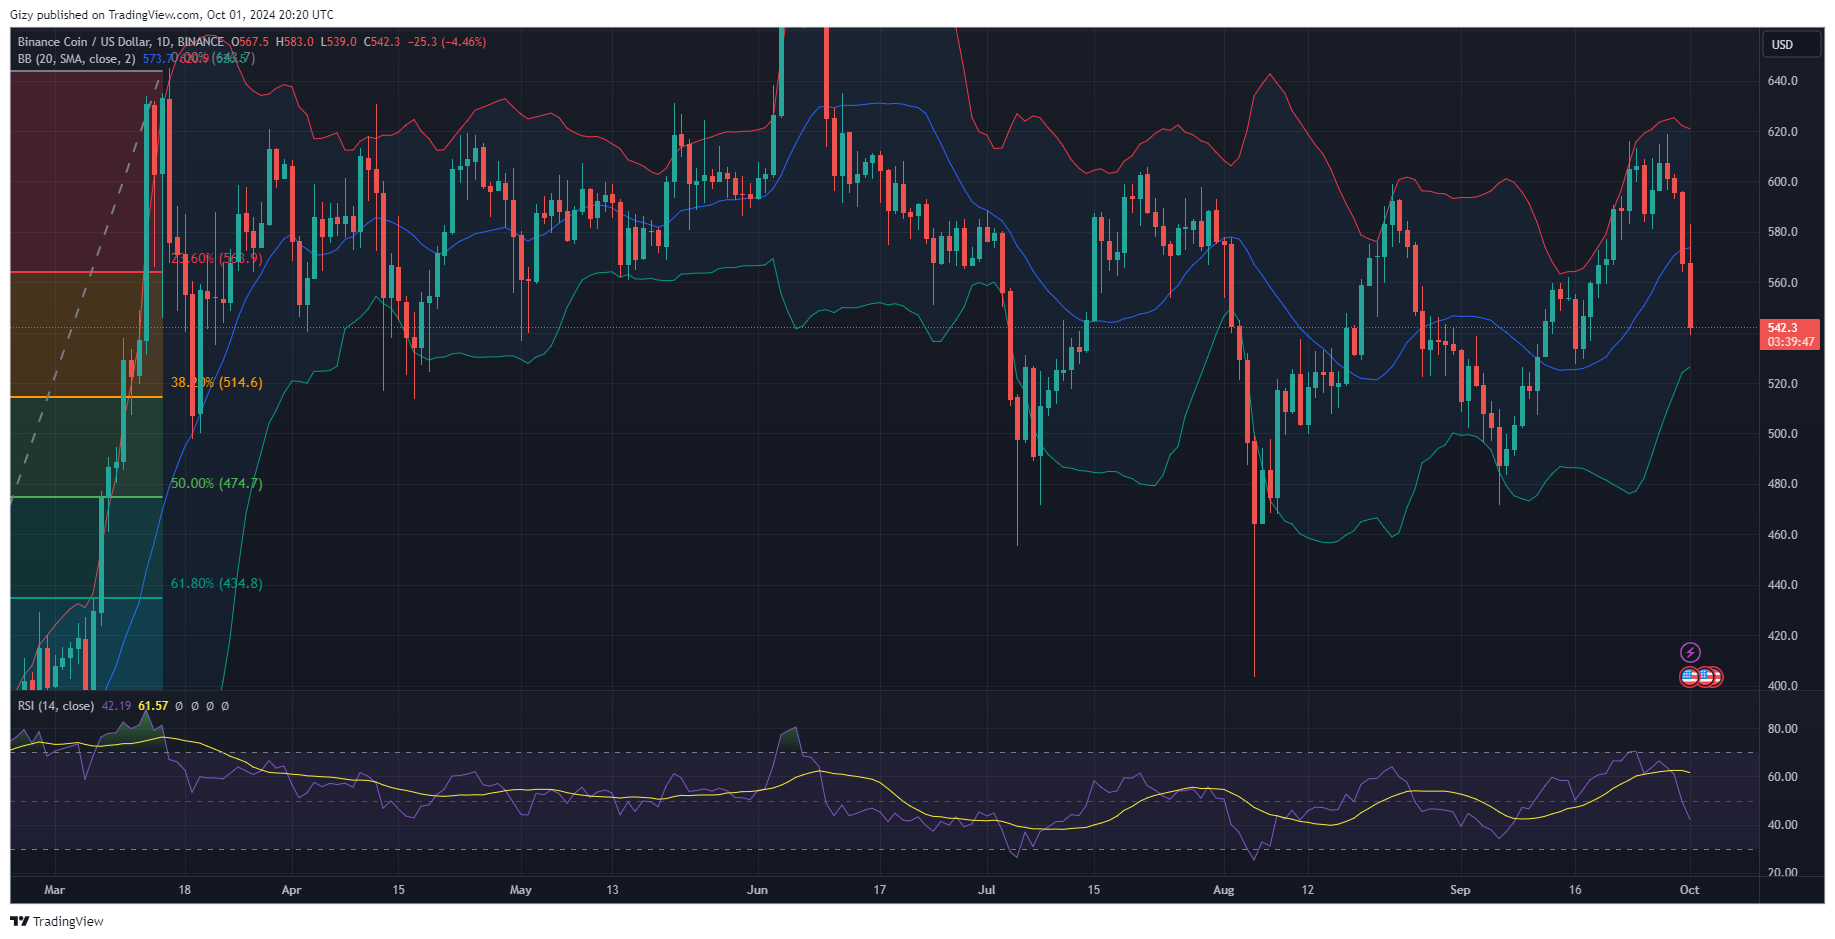
Binance coin is struggling above Bollinger band’s middle SMA. It is currently on its third day of massive significant decline. The downtrend, which started on Saturday, was subtle, with the asset seeing a very small price change. It retested the $620 barrier but failed and retraced below $600. The decline deepened during the previous intraday session as the asset lower.

The current-day may be the largest loss in the last two weeks as the asset is seeing massive selling pressure. It started the day at $596 but retraced due to massive selling concentration. Prices plunged, breaking the $580 support. The decline continued until it rebounded at $568. Although it is seeing a slight increase, the asset is down by over 4%.
RSI dropped further due to current trading action and at 50. Nonetheless, the Bollinger bands show the reason for the ongoing. BNB surged above the metric on Monday, which may traditionally spell the end of the uptrend. However, the asset did not see the corrections as it resumed the uptrend. The decline was due to this trend.
Trading action since Saturday suggested the growing exhaustion in the bulls. The most recent decline reaffirms it. The buyers will look to rally the coin in the coming days following the most recent rebound. Prices may edge closer to lost levels as massive buyback may send BNB as high as $600.
On the other hand, if trading conditions worsen, the altcoins may sink lower. The asset may retest the $550 support. Previous price movement suggests that prices may hover around this mark before breakout.
WIF/USD
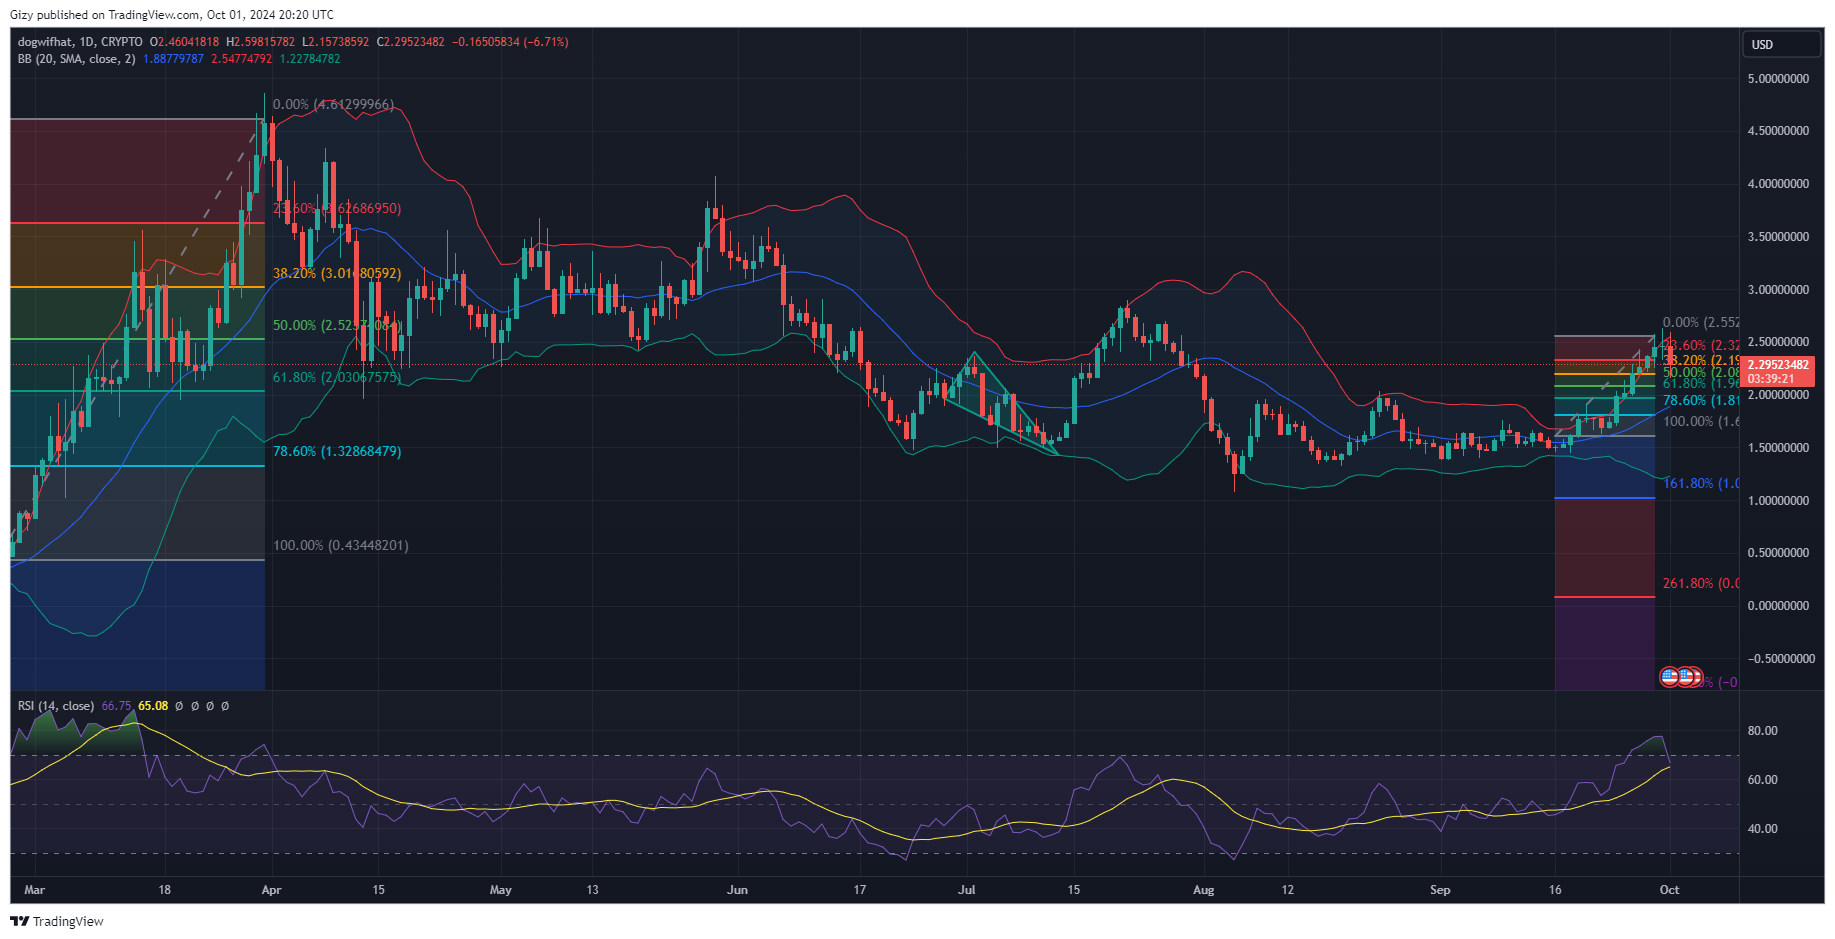
Dogwifhat continues its surge amidst mounting pressure from the bears. It retraced to a low of $2.33 after it started the day at $2.45. However, it rebounded and is exchanging above it opening price. Although not significantly up, the bears may look to capitalize on it.

The same struggle between buyers and sellers took place during the previous intraday session. The asset started the day bearishly, dropping to $2.25 after opening at $2.36. It soon rebounded and surged to a high of $2.57 as it failed to flipped the $2.60 barrier.
The asset continue to trade above the Bollinger band. It broke above it on Tuesday and has since traded above it. Many expected a trend reversal following the breakout, but it never happened. Current trading actions suggest that the correction may start this week. The momentum indicator also reflects this, as it is no longer on the uptrend.
Despite the significant gains, other indicators are turning bearish. The relative strength index (RSI) is currently at 78, marking the fifth consecutive day above 70, which suggests the asset is overbought and due for a correction.
It might begin within the next 24 hours as all indicators point to further downtrends. The asset may retest the 23% Fib level at $2.32. Failure to keep prices above this mark may send as low as the 38% level. Although the asset previous price movement suggests that the downtrend may halt at this mark, WIF will sink below $2 if it breaks.
ENA/USD
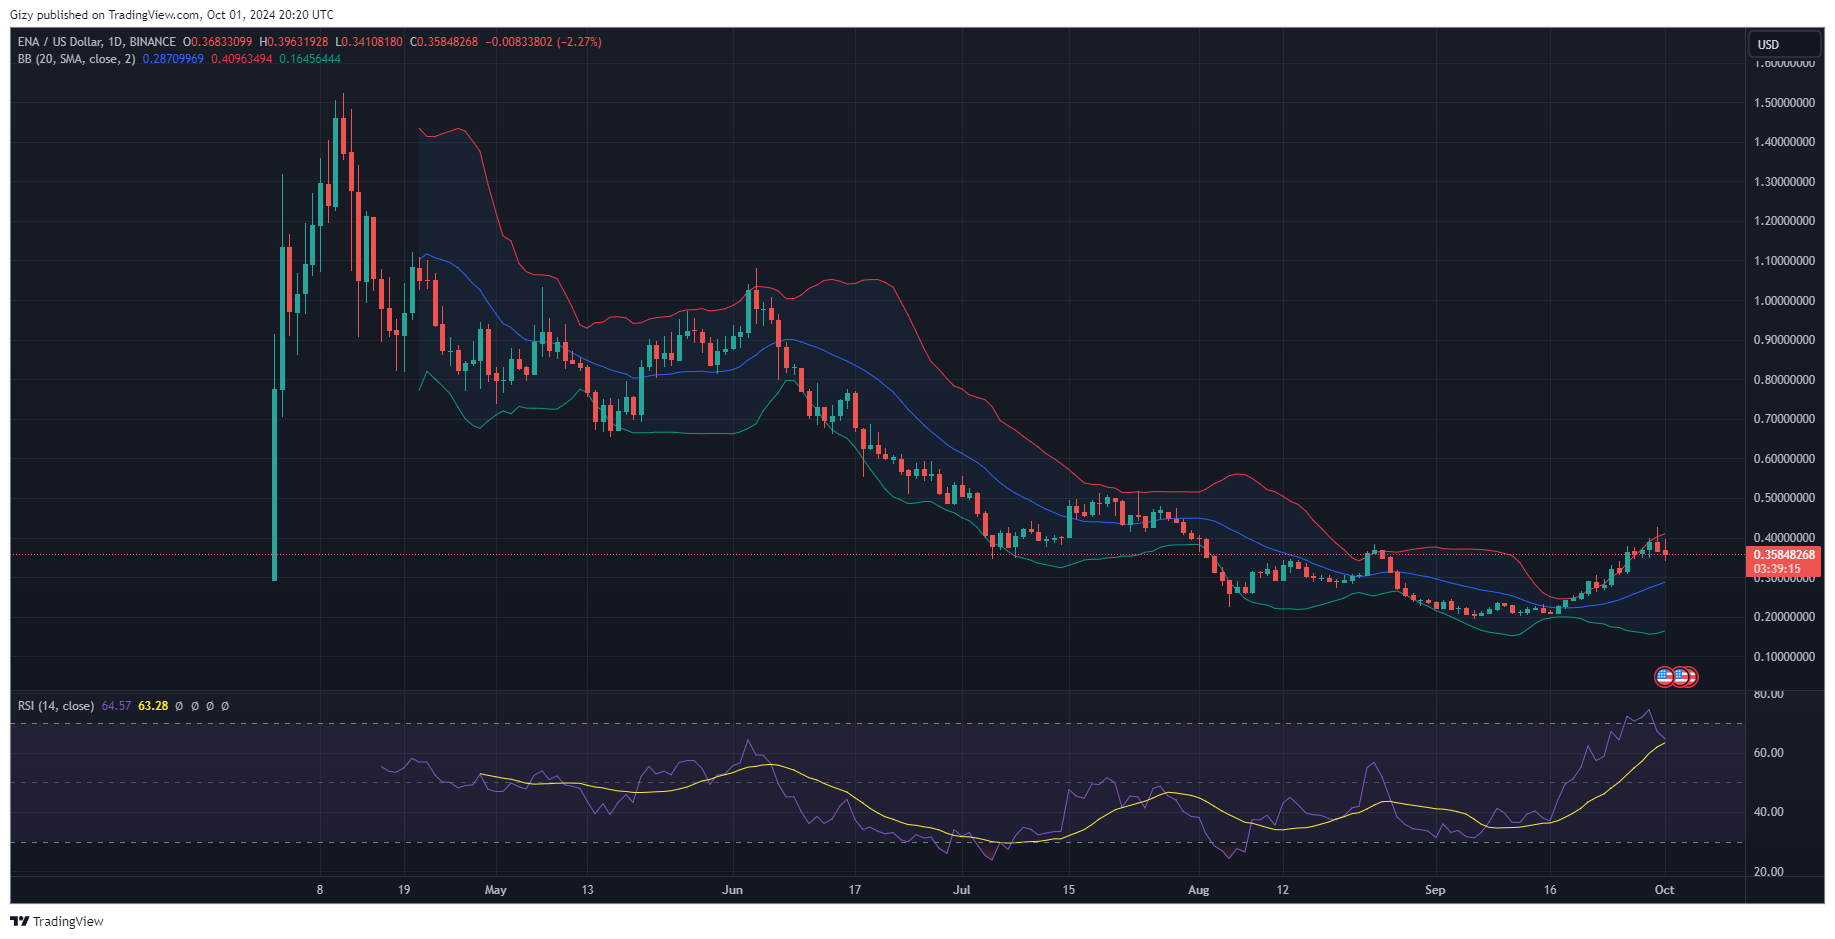
Ethena is seeing massive corrections after it broke above $4. The asset recently broke above its two-month high due to massive buying pressure that shot prices up. It peaked at $0.427 before it lost momentum and fell due to a massive selloff.

Trading action points to the continuation of the selloff this week. For example, ENA is trading within the bollinger band after previously breaking above it. Its breakout indicates a potential trend reversal and other indicators agree with this.
The relative strength index is above 70, indicating that the asset is overbought and due for corrections. The altcoin may drop to $0.35. However, it will slip below it and retest the $0.30 support. On the other hand, there are chances that it may surge higher, retesting $0.45.
