
RAY made the rounds a few hours ago due to its sudden price decline. The token saw massive declines earlier due to a significant shift in fundamentals.
Pump.fun announced that it is testing an automated market maker. The AMM will see less traffic into Raydium, resulting in a price decline.
Nonetheless, the general market sentiment across the crypto market remains negative. The fear and greed index slipped lower, hitting 40, as fear and uncertainty spread among traders.
The global cryptocurrency market cap dipped by 2% over the last 24 hours. It had a more than 20% increase in trading volume. However, valuations indicate that the sector saw a spike in selling pressure as several cryptocurrencies saw notable declines.
Hyperliquiid was one of the top losers in the last 24 hours, retracing from $23.2 to a low of $20.6. It is down by over 10% in the previous 24 hours. BONK closes in with losses exceeding 9%.
Solana slipped further. It opened Monday at $167 but plunged, breaking the $160 support. It slipped below $150, hitting a low of $147, but it trades at $151 at the time of writing. Due to massive selling pressure, the coin lost over 9% in the last 24 hours.
Many investors are bearish on the coin because they fear the impending unlock. Nonetheless, with the negative sentiment spreading across the market, let’s look at how some assets may perform this week.
Top Five Cryptocurrencies
BTC/USD
Bitcoin is off to a slow start. It slipped lower on Monday, retracing from $96,264 to a low of $93,607. Although it saw a slight buyback, it was down by over 2%.
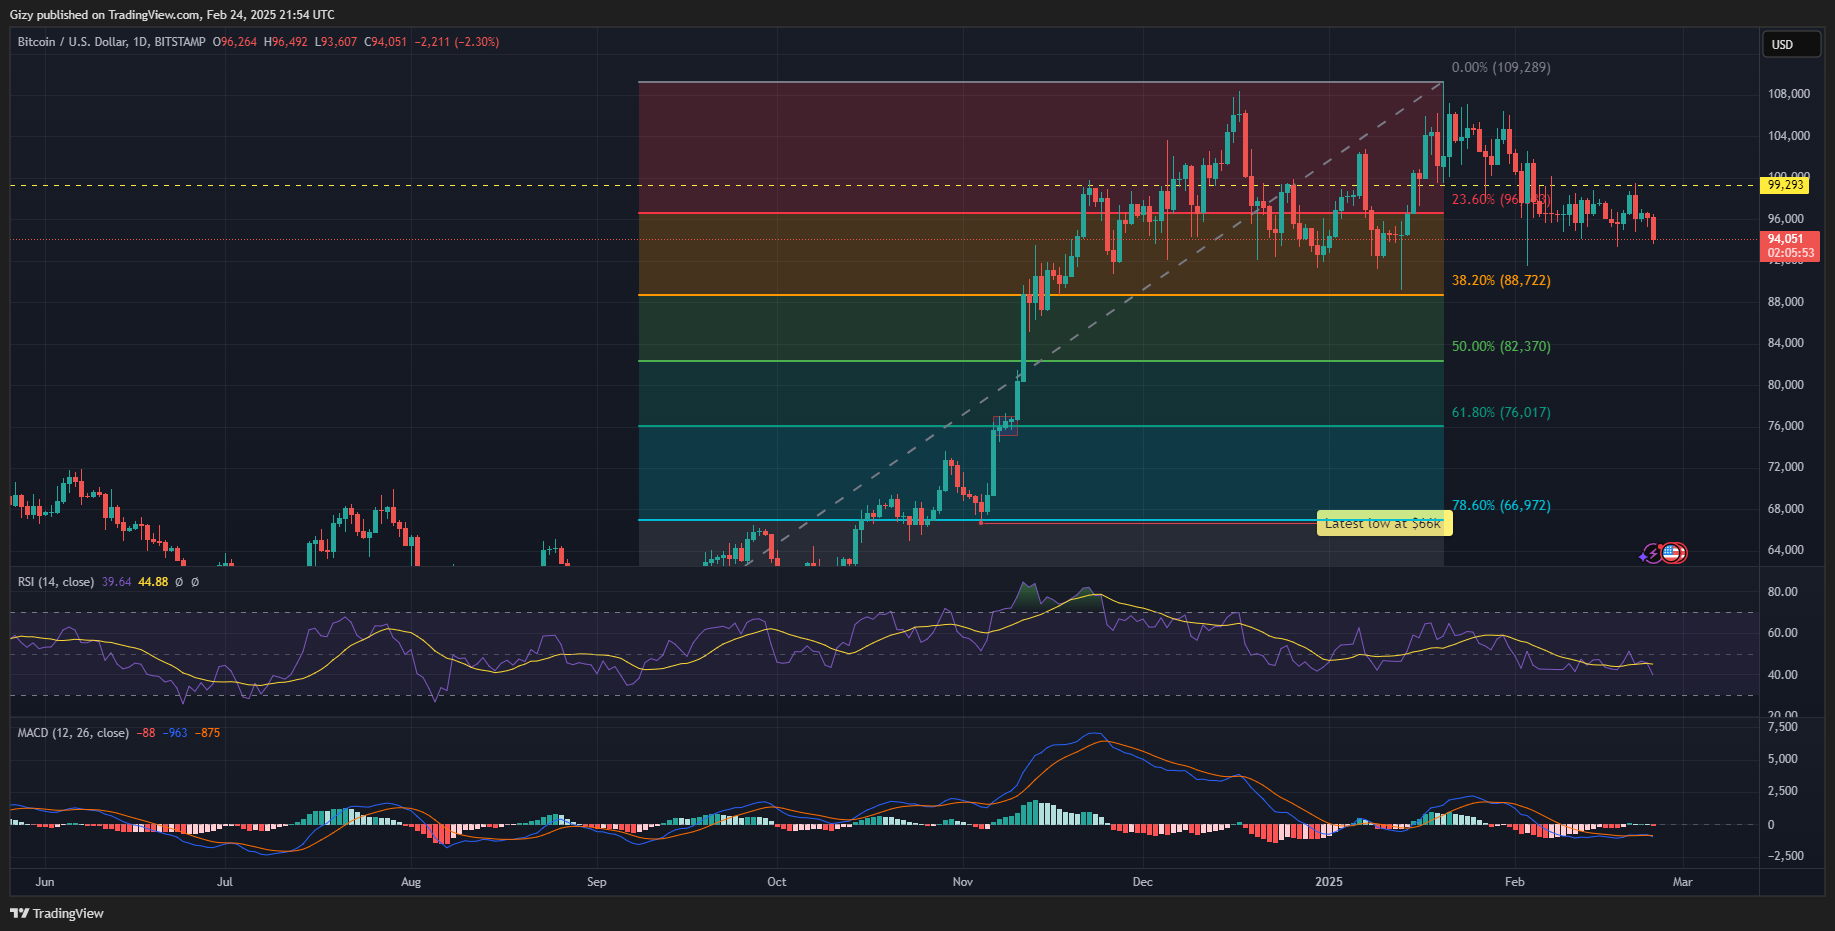
The coin edges closer to testing its fourteen-day low at $93,340. However, indicators suggest it may slip lower this time. The moving average convergence divergence flipped bearish due to the price declines. The 12-day EMA intercepted the 26-day EMA a few hours ago, and negative divergence is ongoing.
Readings from MACD coincide with the relative strength index. The metric is heading downhill, indicating notable selling pressure. It is at its lowest since October.
Traders fear further dips. Data from CryptoQuant points to a sudden spike in exchange reserves due to a selling frenzy. More traders are dumping their assets into these trading platforms. The exchange netflow is +1052%, indicating growing selling pressure.
The derivatives market sees more activity as funding rates slightly increase. Open interest grew by almost 5%, and the bulls were the top losers.
Bitcoin risks further decline. Previous price movement points to significant demand concentration at $93,300. A slip below this mark may see the coin dip as low as $90k. The Fibonacci retracement levels point to a possible dip to $88k.
Conversely, a shift in fundamentals may alter the current trend. However, there is a low chance of breaking above $100k this week.
HBAR/USD
Hedera was on the verge of breaking above its seven-day but faced massive rejection at $0.227. The asset retraced as traders took profit, dipping to a low of $0.200 before rebounding.
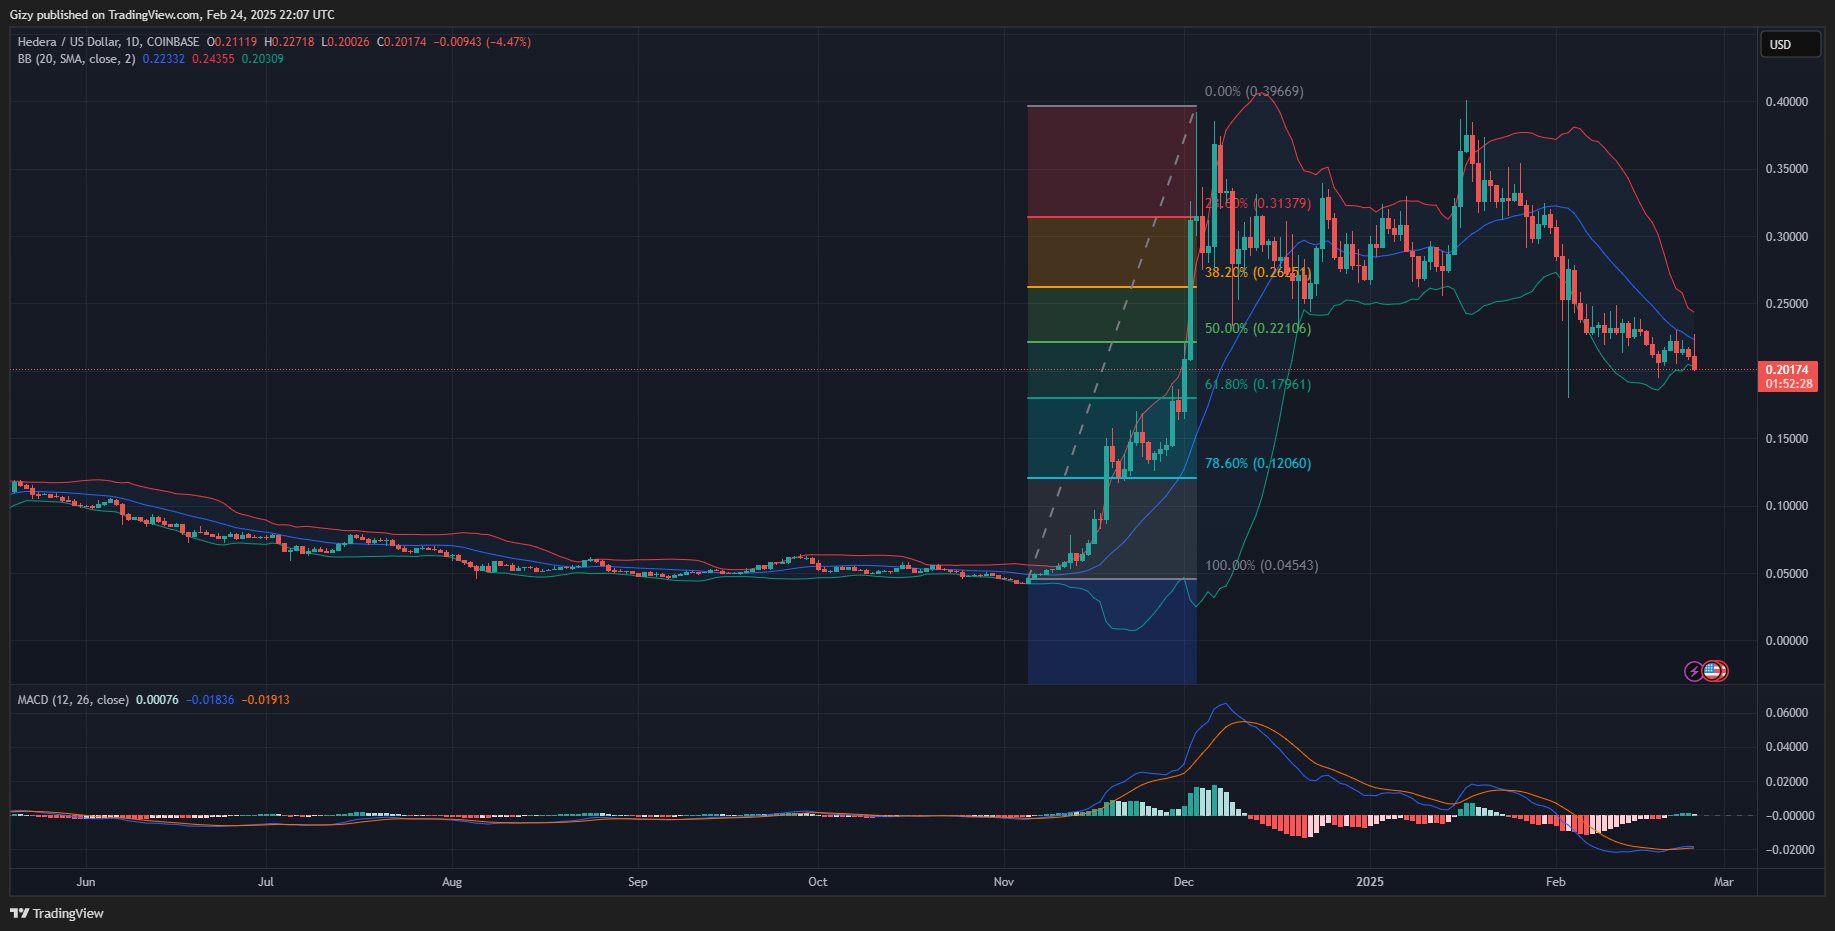
The cryptocurrency rebounded a few percent shy of its seven-day low. However, its decline enters day 2, with the altcoin losing over 2%.
MACD is unaffected by the latest price dips. A few days ago, the metric displayed a bullish divergence. The histogram associated with the indicator shows a longer green bar. Nonetheless, RSI dips lower, indicating notable selling pressure.
Previous price movement shows it may slip below $0.200. However, it risks dipping to the 61% fib level at $0.180. On the other hand, it may recover and retest the $0.23 resistance.
Nonetheless, the Bollinger band shows the asset is gearing up for a breakout. The band is tightening due to lesser volatility. The cryptocurrency also trades below the lower band.
SEI/USD
SEI recently broke out. It surged from $0.23 on Thursday to a high of $0.27. Two days later, it edged closer to $0.30 but peaked at $0.29. Nonetheless, the asset created a new short-term support level.
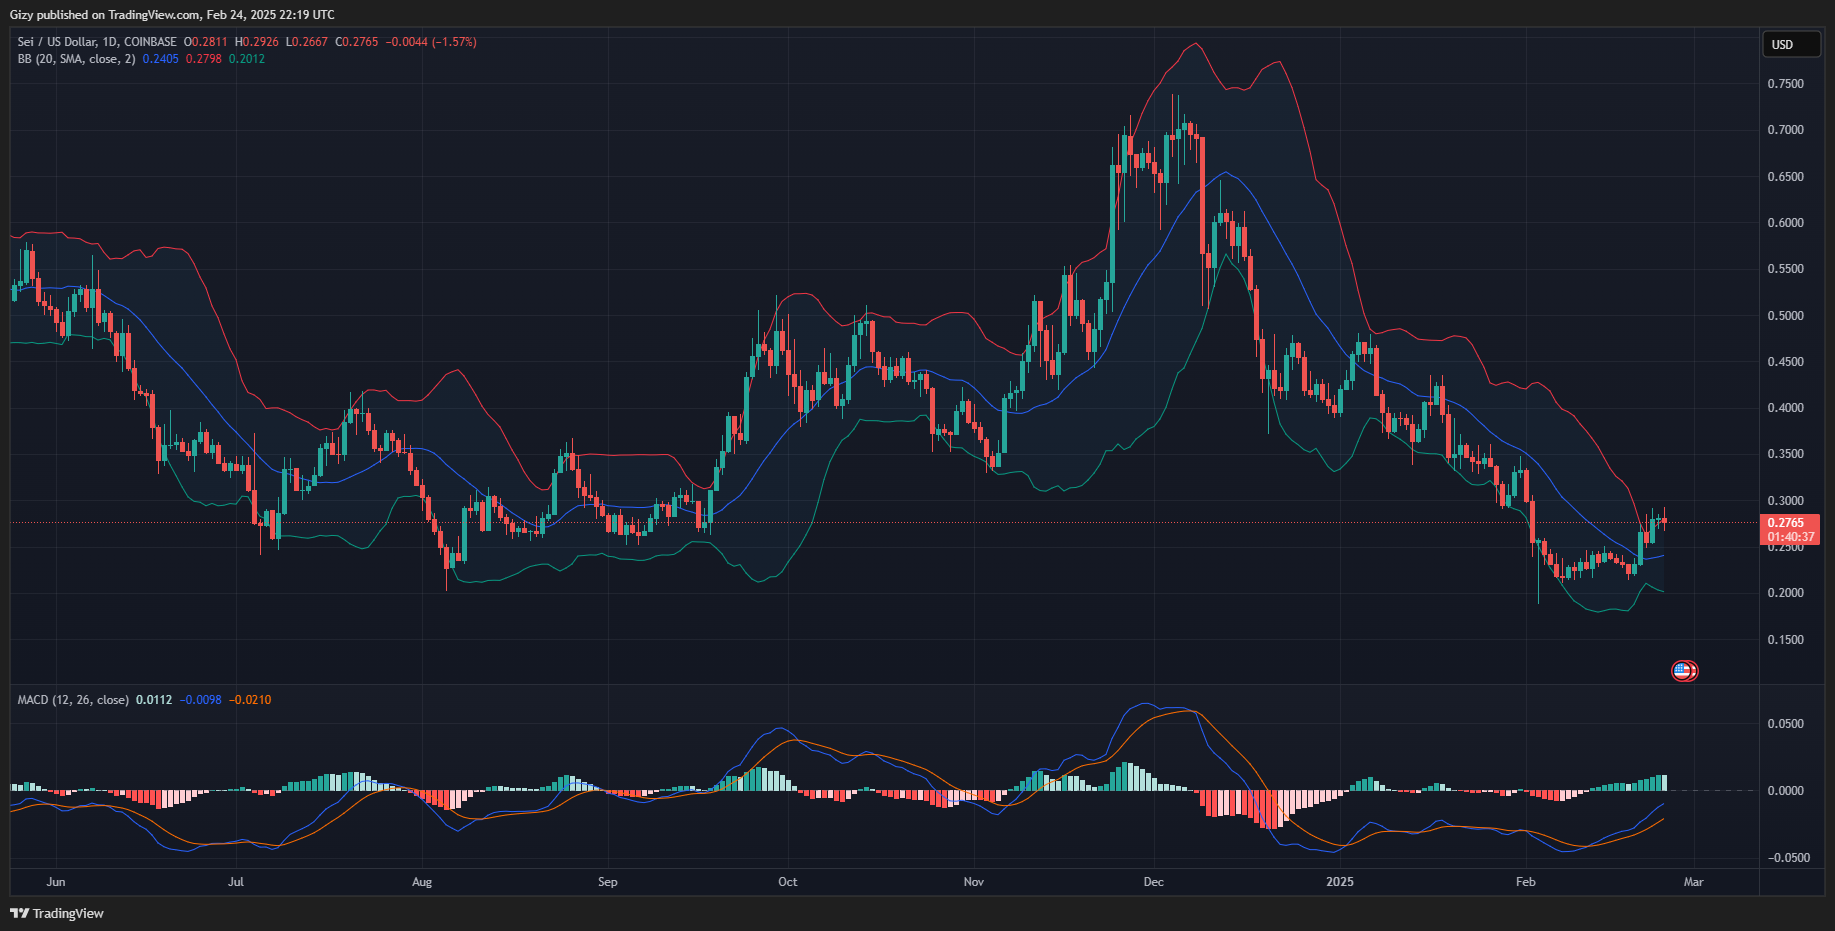
Although recent price movement shows that the asset may slip below $0.26, trading actions in September 2024 suggest it may hold. MACD also supports this claim, pointing at further price increases. The metric shows the 12-day EMA and 26-day EMA on the uptrend.
Nonetheless, the Bollinger bands suggest an impending decline. The asset broke above the upper SMA on Friday and continues to trade above it. The indicators suggest that the cryptocurrency is due for a trend reversal.
It is worth noting that there is a high chance of further surge as the Bollinger band was tightening a few days before the breakout. The metric may continue to expand as volatility increases, guaranteeing a flip of the $0.30 barrier. Nonetheless, it risks declining to $0.25 before the week runs out.
ENA/USD
ENA has been one of the top gainers in the last 24 hours. It opened trading at $0.44 but dipped to a low of $0.37 as it lost the $0.40 support.
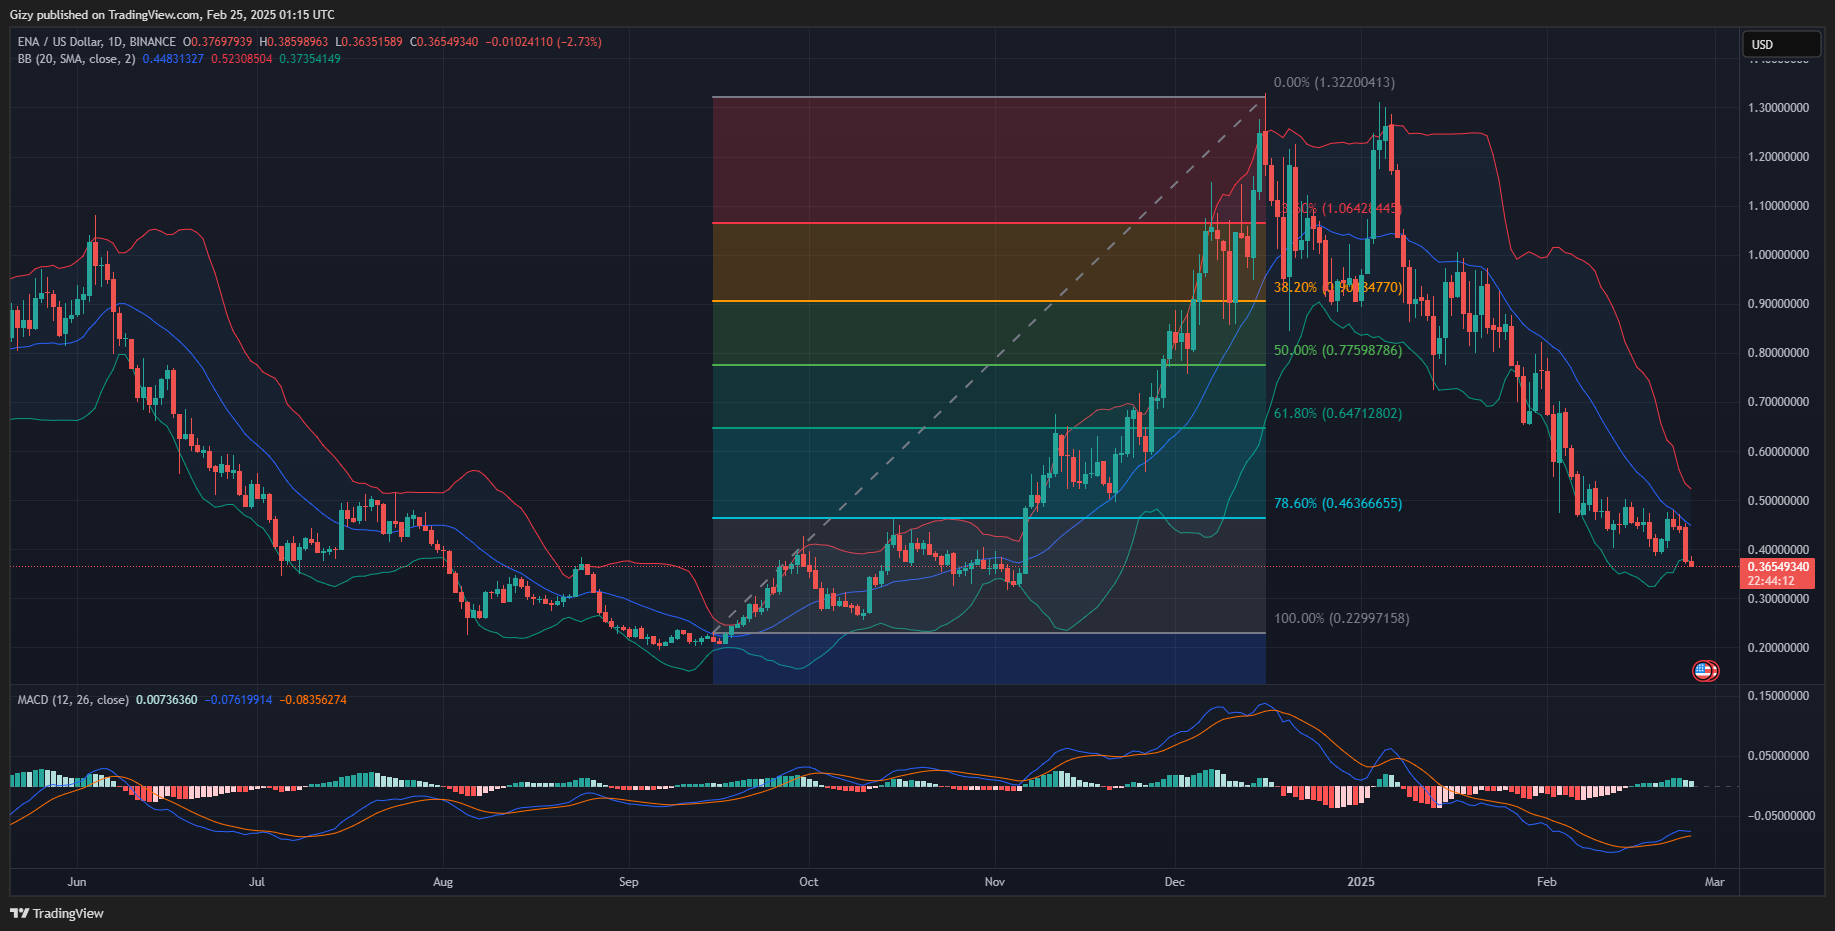
The decline is ongoing, as no notable wick is sticking out of the candle. The asset broke below its seven-day low a few hours ago. It may continue downward, as the Fibonacci retracement level points to no notable support level until $0.22. Nonetheless, previous price movement points to notable demand concentrations at $0.30.
Nonetheless, the Bollinger band suggests the asset may rebound. It is trading below the lower SMA, indicating it is due for a trend reversal. This may see it break above the middle band at $0.46 this week.
RAY/USD
Raydium was one of the worst-hit assets by the ongoing declines. It opened trading at $4.19 but retraced, breaking the $3 support and hitting a low of $2.90. It shows signs of recovery. However, MACD points to more declines.
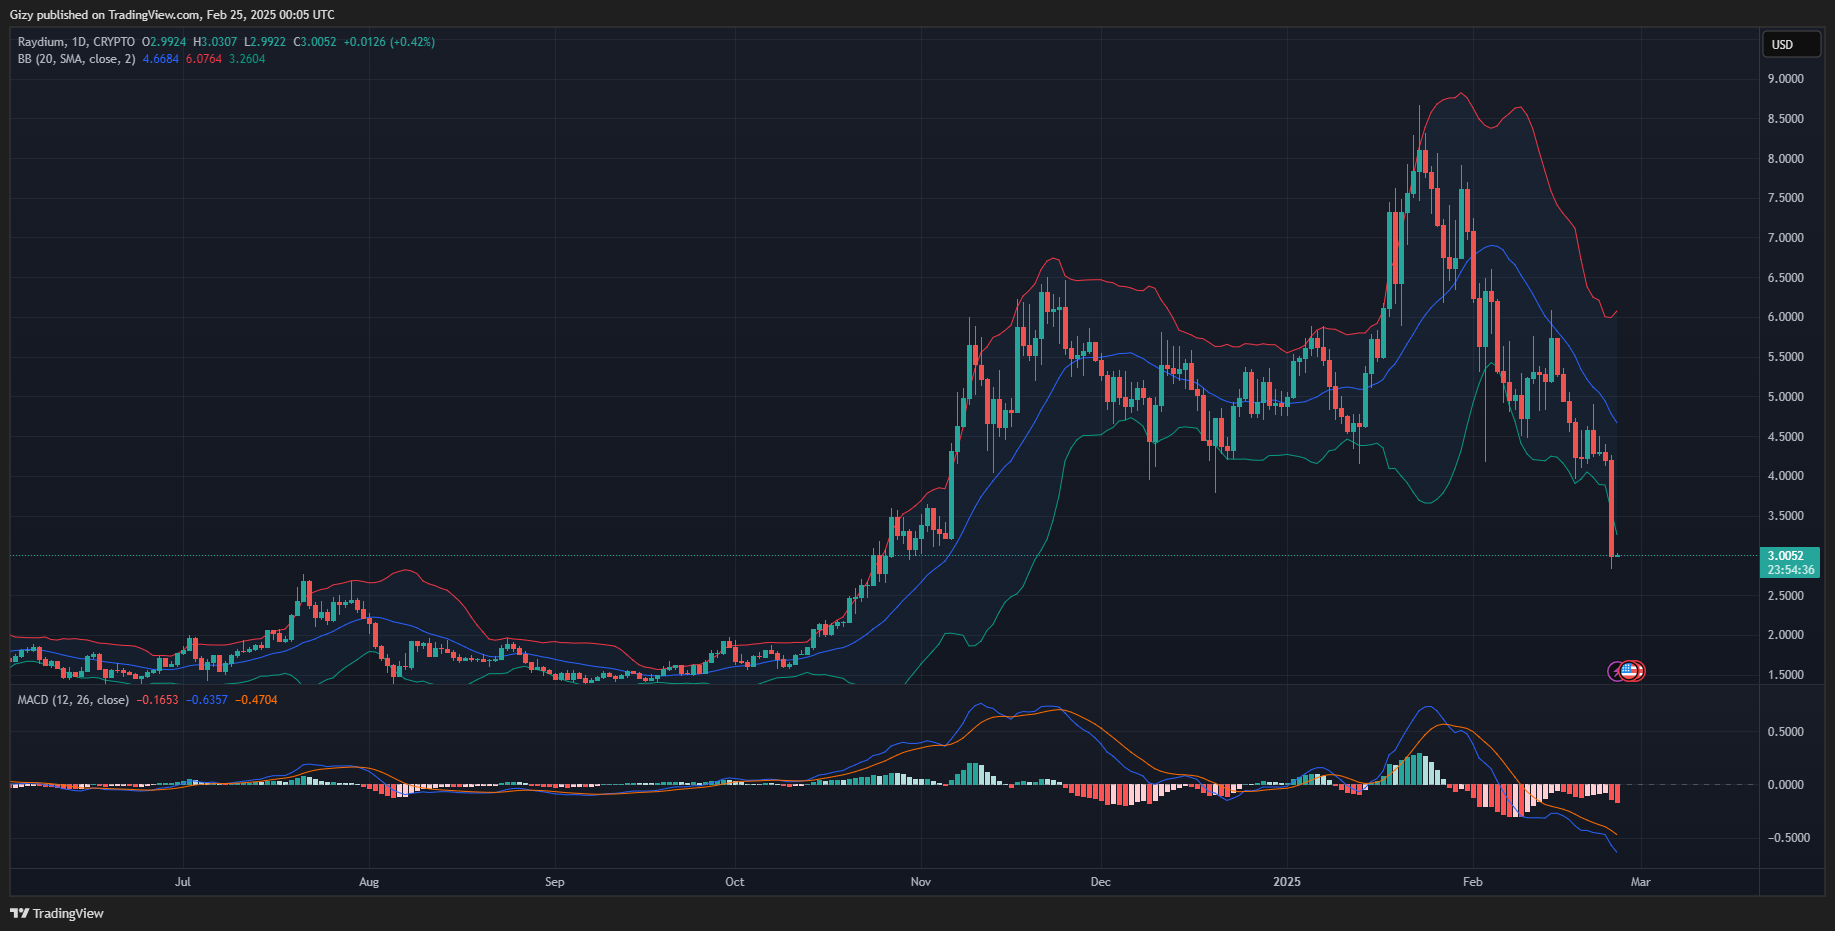
The moving average convergence divergence continues downward following the latest price declines. Previous price movement suggests that failure to reclaim $3 may result in further declines. RAY will retest the $2.50 support
Nonetheless, the Bollinger band suggests the asset may rebound. It is trading below the lower SMA, indicating it is due for a trend reversal. This may see it edge closer to the middle band at $4.70 this week.
