Most traders anticipate what will happen to BTC in the coming days—the news of Mt. Gox asset movements. In the early hours of May 28, on-chain data pointed to the move of over $9 billion worth of BTC from several wallets controlled by the exchange.
The fund accumulation is in anticipation of the upcoming payout to creditors who lost their money during the hack. It remains to be seen if the payout will be in crypto or cash. A cash payout will spell more price decline for the apex coin.
In reaction to the news, the global cryptocurrency market cap dropped by over 2%. The chart representing the last seven days is parallel, depicting very little volatility.
With so many uncertainties, how will the crypto market respond this week?
Top Five Cryptocurrencies to Watch
BTC/USD
Bitcoin is printing a doji on a weekly scale, illustrating that it has yet to register any significant increases in the last 48 hours. A close with the red doji will mean an end to the two-week uptrend as it gained over 3% and surged to $72k during the previous intraweek session.
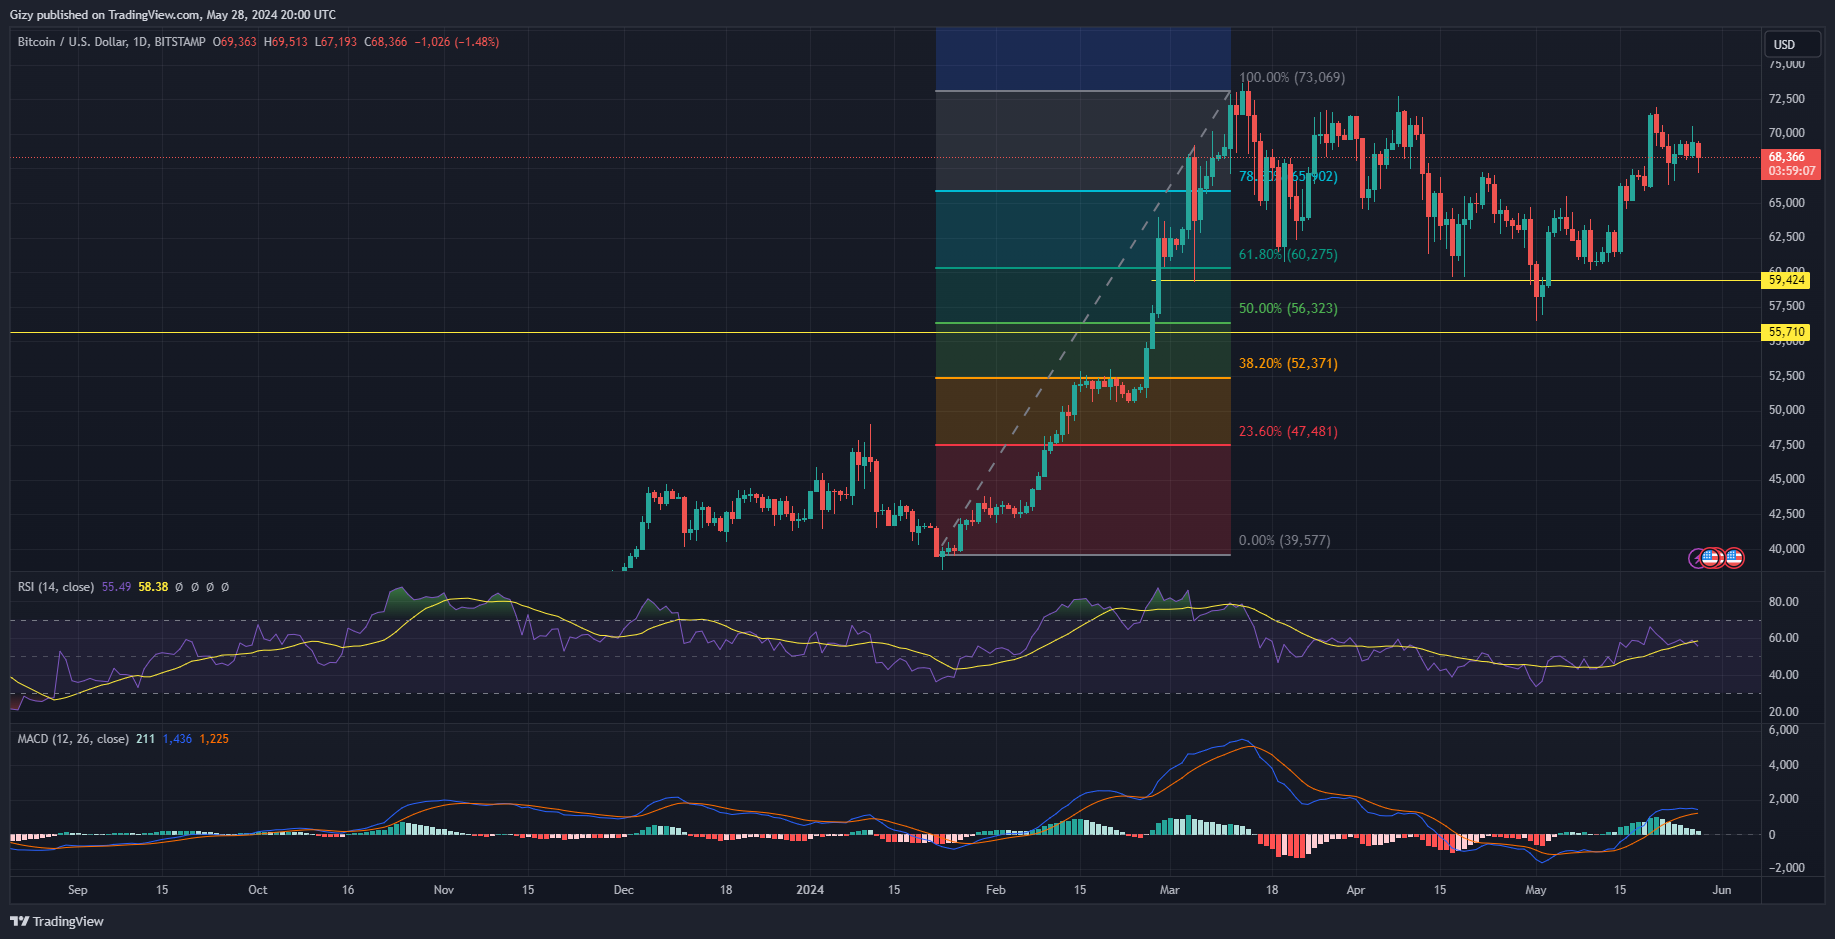
The previous intraday session saw the apex coin climb as high as $70,600 but closed below it. Nonetheless, it ended the day with gains of almost 2%. The opposite is taking place during the current session as the asset lost all of the accumulated profits.
It dropped to a low of $67k and is currently trading at $68,200. Currently down by almost 2%, indicators hint at further price decline.
The moving average convergence divergence is printing sell signals at this time. The 12-day EMA is edging close to intercepting the 26-day EMA. With the bearish convergence underway, the divergence will start following the interception.
RSI is also declining, indicating a significant increase in selling volume. Continuing this trend will result in a possible decline to the 23% Fibonacci retracement level at $66k. Further slip may result in a retest of the pivot point at $64k.
ETH/USD
Ethereum gained a whopping 24% during the previous seven-day period. It surged from $3,000 and peaked above $3,900.
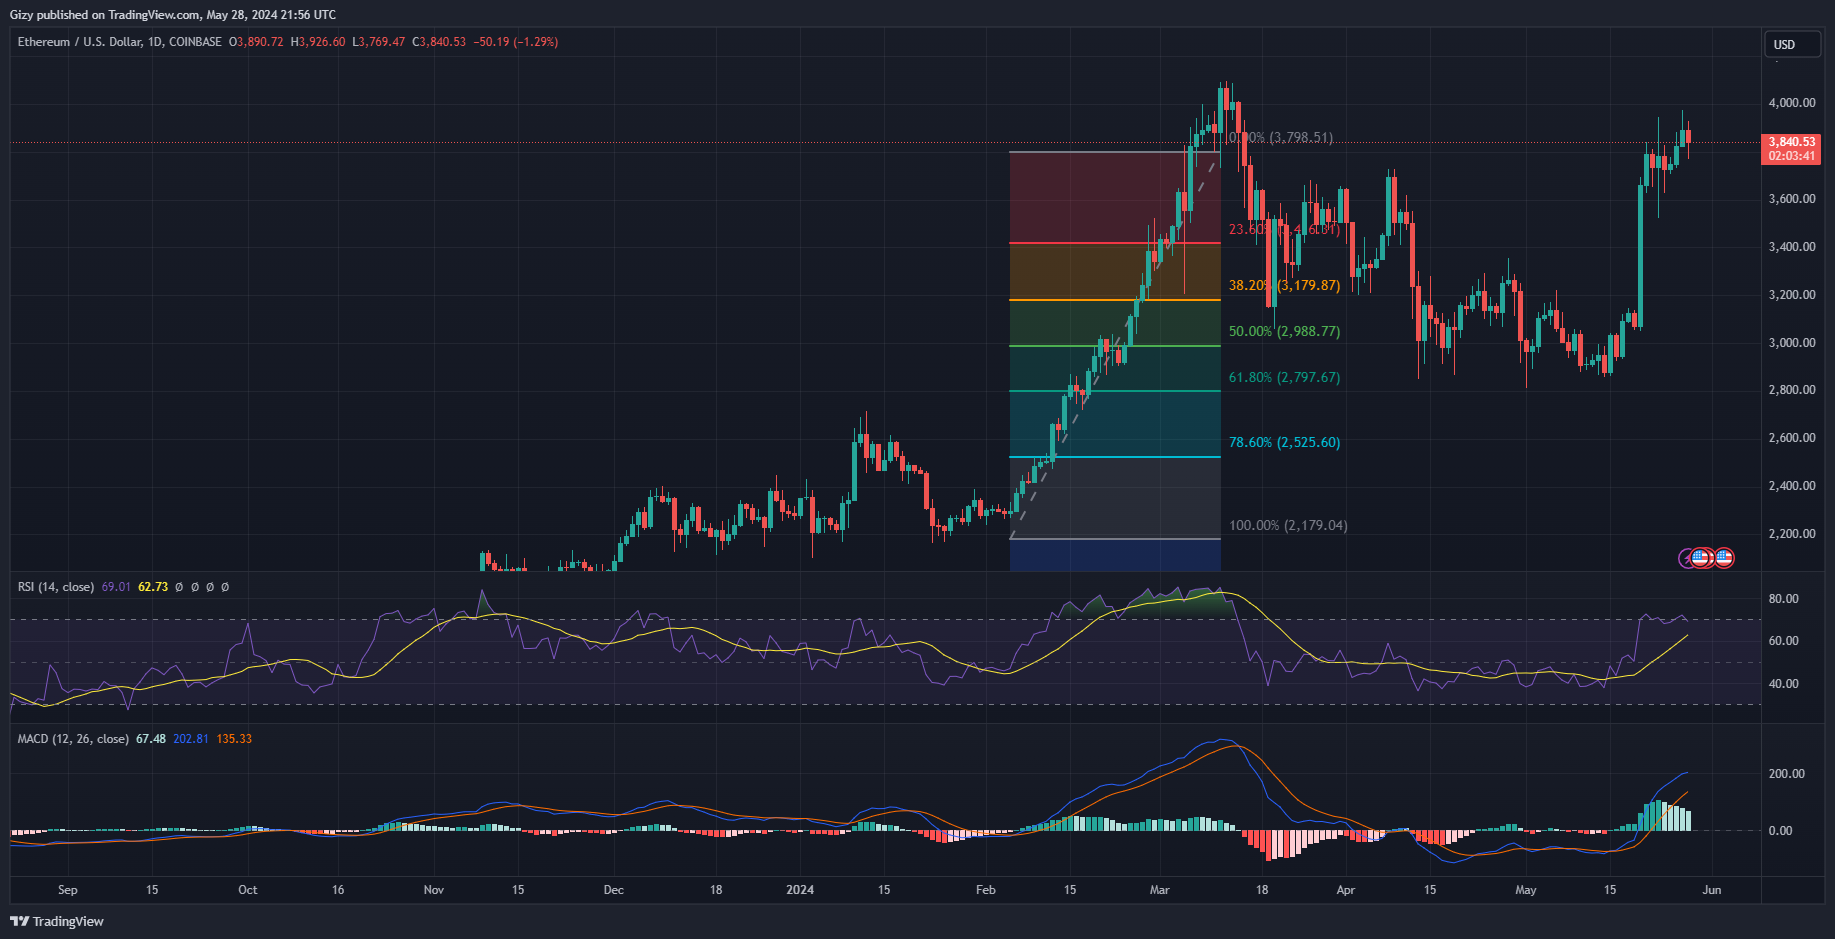
The bulls are struggling to continue the bullish trend, and a massive selloff looms. Nonetheless, they tried to reignite the uptrend during the previous intraday session and registered brief success, as it peaked at $3,973.
ETH is printing a red candle in response to trim losses. According to Coinmarketcap, it is seeing less trading volume. This is due to the negative market sentiment affecting significant crypto assets. However, RSI dropped from 70 to 68 in response to the slight increase in selling volume.
The relative strength index also points to further decline. Since May 20, the metric has trended close to 70, which means Ethereum is overbought and due for correction. The start of the week suggests that the corrections may occur within the next five days.
In reaction to the most recent dip, the 12-day EMA halted its ascent. If the downtrend continues, the metric will start the bearish convergence, sealing the descent.
The first critical level to watch is the $3,600 support. If it fails, the asset may fall back to the 23% Fib level at $3,400. Nonetheless, the bulls may attempt $4k before the week ends.
BNB/USD
Binance coin remain range-bound for the last five days. It failed to register any notable price changes during this period. Nonetheless, it shot up to $625 on one occasion but retraced to $600 to continue the trend.
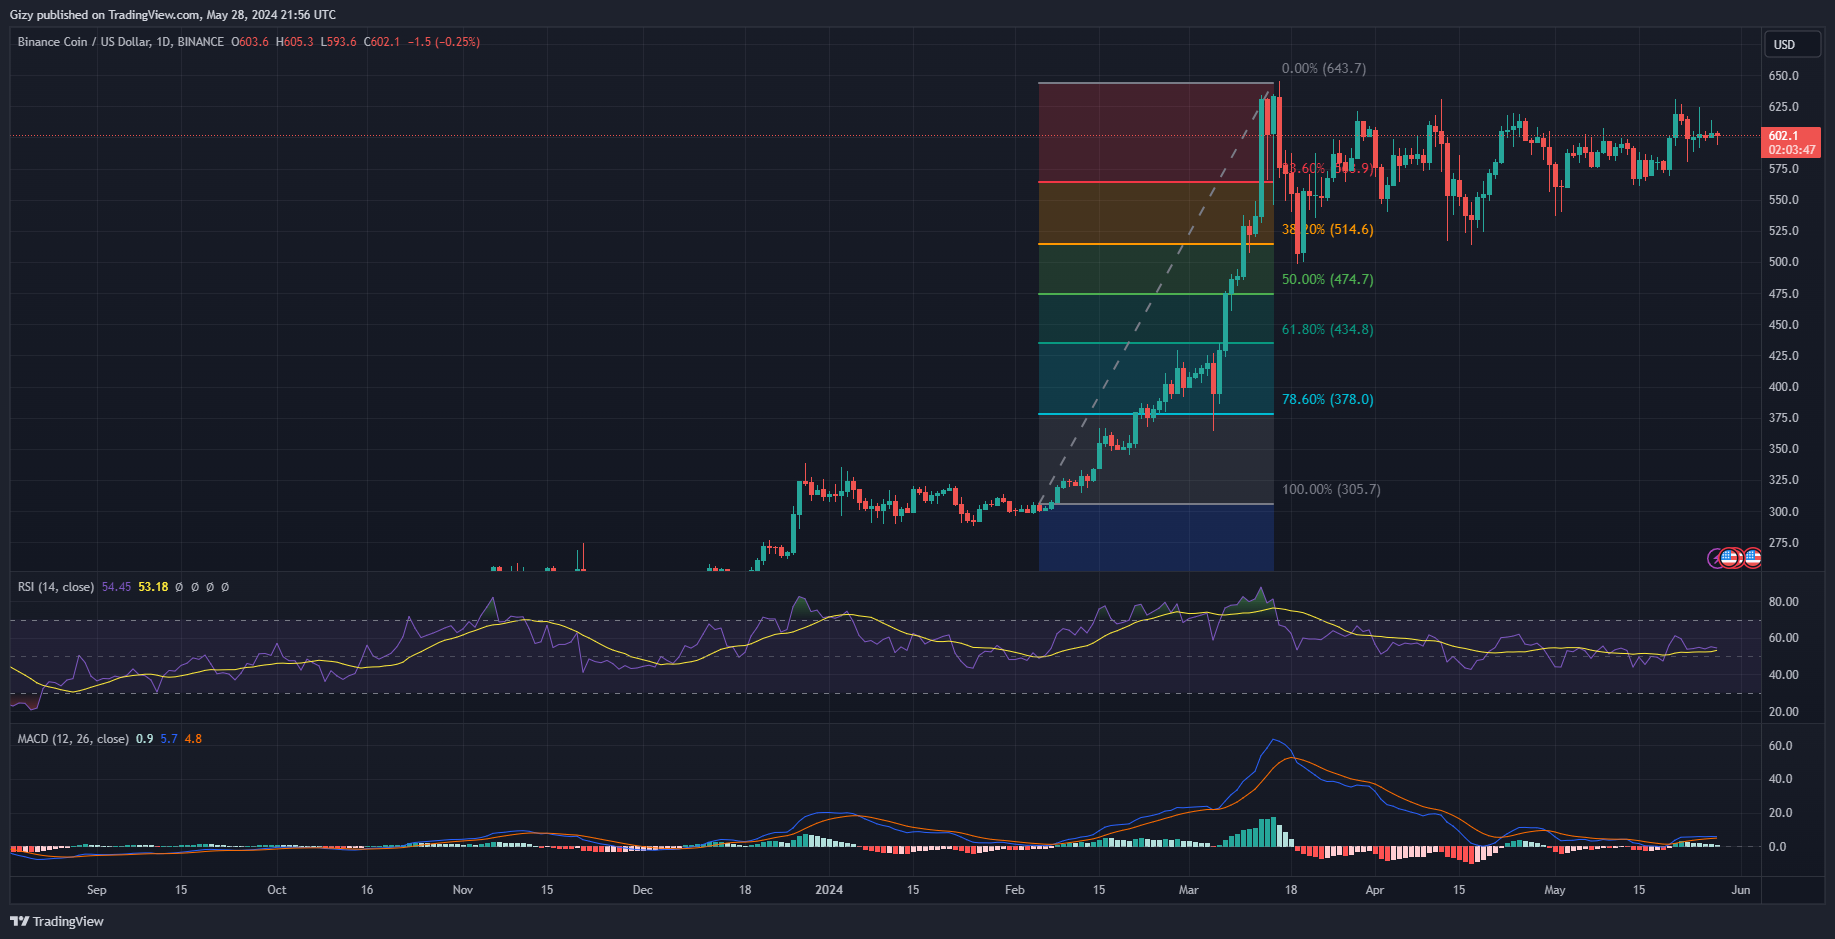
BNB is printing a doji on the weekly scale. This is due to a massive decline in volatility. In the last 48 hours, the coin peaked at $613 and dropped to a low of $573. However, it has yet to register any significant price improvement.
The relative strength index remained above 50 in response to the most recent price pattern, which gives the bulls an advantage. Nonetheless, the range-bound movement indicates an impending breakout. The question of its direction looms.
MACD histogram has been declining in the last seven days. The metric shows a descending trend, which points to the narrowing of the space between the 12-day and 26-day EMA. It is also an indication of the bearish convergence the asset is undergoing.
This means the likely direction of a decline will be downwards. If that happens, BNB will retest the 23% Fib level at $565. Nonetheless, there is a significant demand concentration at $575, and the bulls will attempt to defend it.
SOL/USD
Solana ended the previous week with losses of almost 4%. It surged to a high of $188 as it fell $2 short of flipping $190.
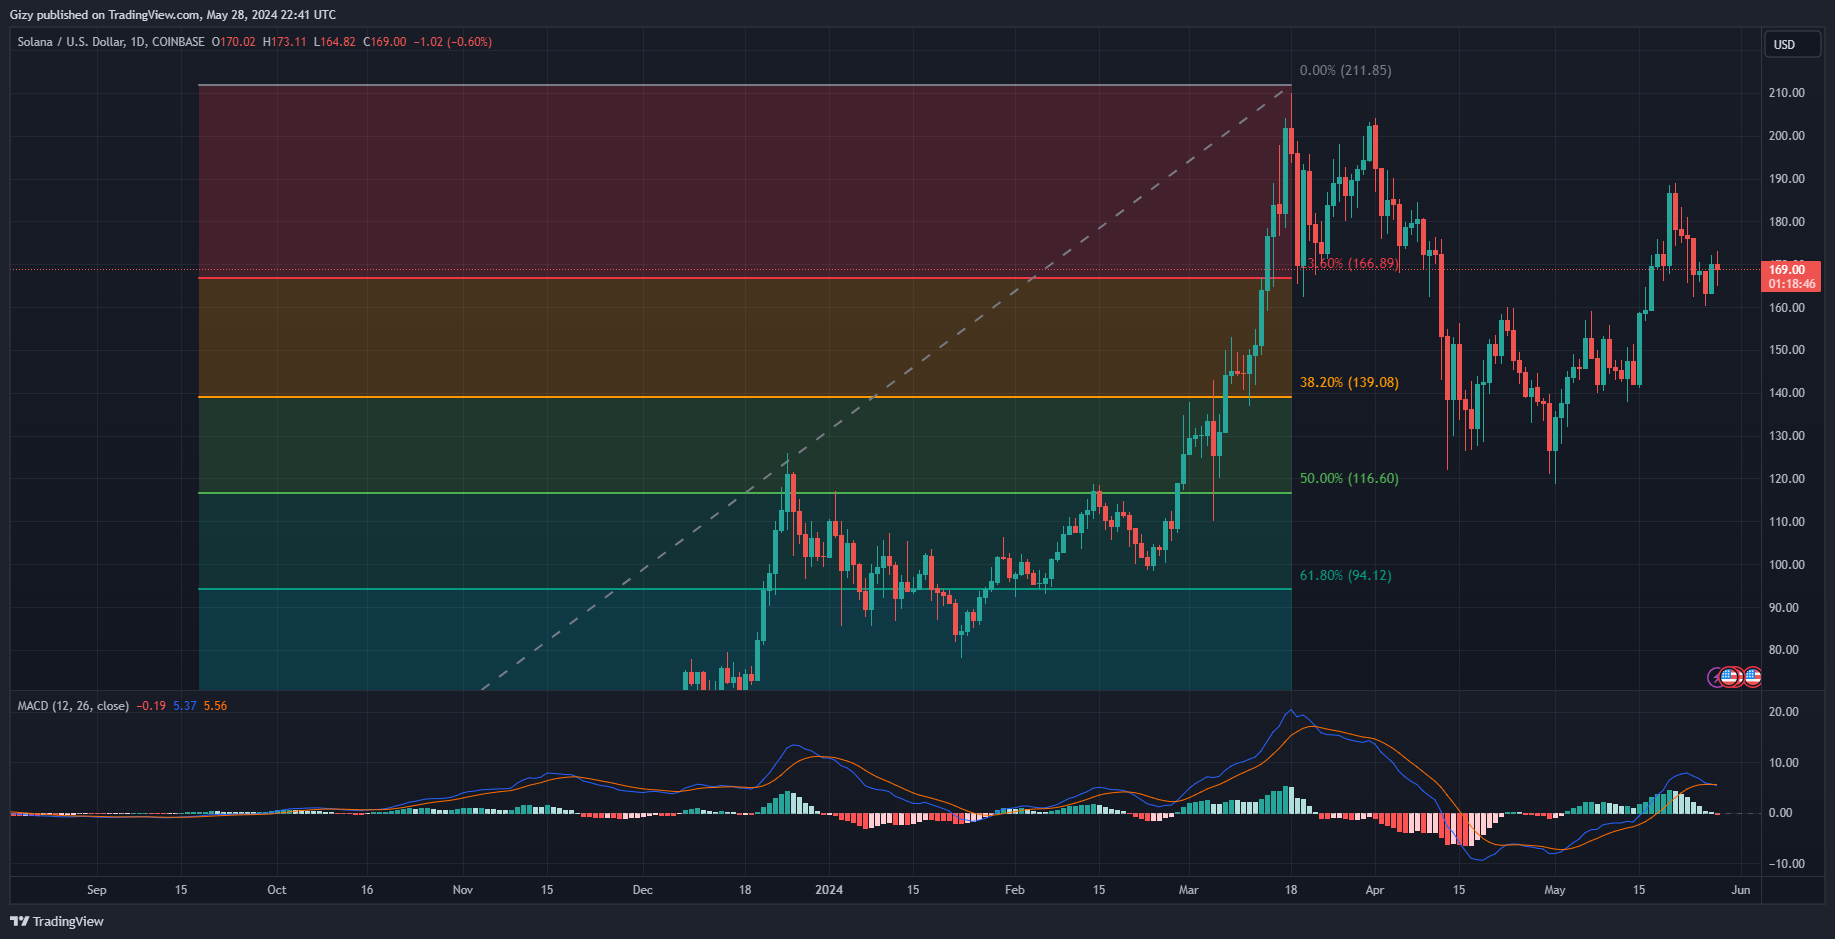
The bulls are now attempting a buyback and have reclaimed the losses incurred. During the previous intraday session, it surged from $163 to $172. It closed with gains exceeding 4%. Currently printing a doji, the coin is recovering from a drop to $164 and showing much uncertainty.
The moving average convergence divergence started printing sell signals last week. The 12-day EMA has intercepted the 26-day EMA. However, the divergence is not pronounced due to the current candle. Additionally, a change in trajectory will alter the impending event.
Nonetheless, the downtrend may be in motion as the coin is struggling to hold price above $160. The bulls will expect a rebound at the 23% Fib level at $166. This has played out twice in the last five days due to the considerable concentration of demand around it.
However, if the bulls fail to defend the mark, it will retest the $160 support. Previous price movement suggests that a slip below this critical level will result in a further decline to as low as $140. On the other hand, the asset may gain stability above $170 and attempt $180.
XRP/USD
XRP continues its range-bound movement between $0.52 and $0.54. In addition to reduced volatility, the coin failed to register notable changes in the last five days. Nonetheless, it gained over 3% during the previous seven-day period.
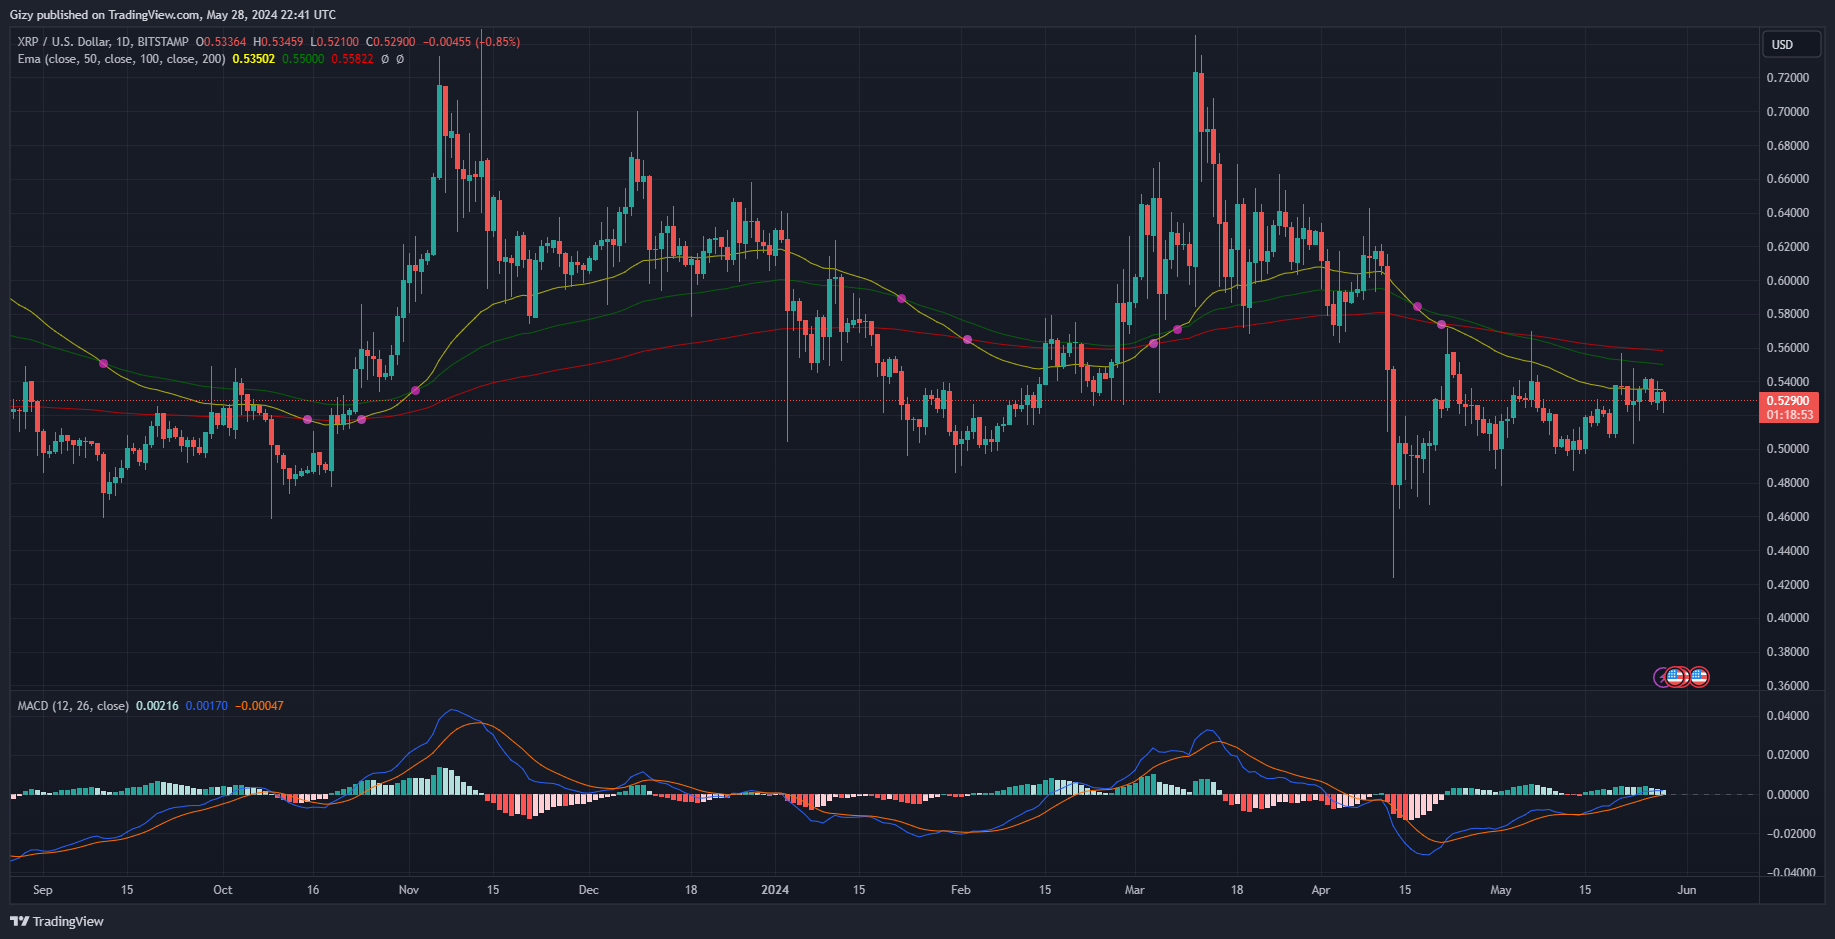
Currently printing a doji, traders expect a breakout in the coming days. It is uncertain if these expectations will become reality within the next five days. However, the indicators are hinting at further price decline.
MACD’s histogram depicts a falling pattern, a gradual narrowing of the space between the 12-day exponential moving average and the 26-day EMA. With the latter trending above its counterpart, it also indicates an ongoing bearish convergence. It is also worth noting that in reaction to the latest price movement, the 12-day EMA has halted its ascent.
With further downtrends on the horizon, XRP may retrace as low as $0.50. It remains to be seen if it will go lower this week.
Nonetheless, currently trading below the 50-day exponential moving average, the bulls may attempt to regain stability above $0.53
