
ETH and other cryptocurrencies are down by over 3% each. The massive outflow from ETFs over the last 24 hours is driving this selloff.
Nonetheless, the global cryptocurrency market cap is holding steady at $2.3 trillion despite the most recent price declines. It is also worth noting that some of these assets are recovering and reclaiming critical supports.
Cryptos like LDO and ENS were not affected by the massive market decline. They both gained 8% and 7%, respectively, with ONDO taking the third spot amongst the top gainers with gains of over 2%.
Many analysts believe that the crypto market will experience this sort of decline again, and this is the last before the bull market resumes. How will these assets perform this week?
Top Five Cryptocurrencies to Watch
BTC/USD
Bitcoin was one of the worst-hit coins in the top 10, with losses exceeding 3%. It edged closer to testing May’s low as it briefly slipped below $65k. The apex coin dropped to a low of $64,000 before rebound.
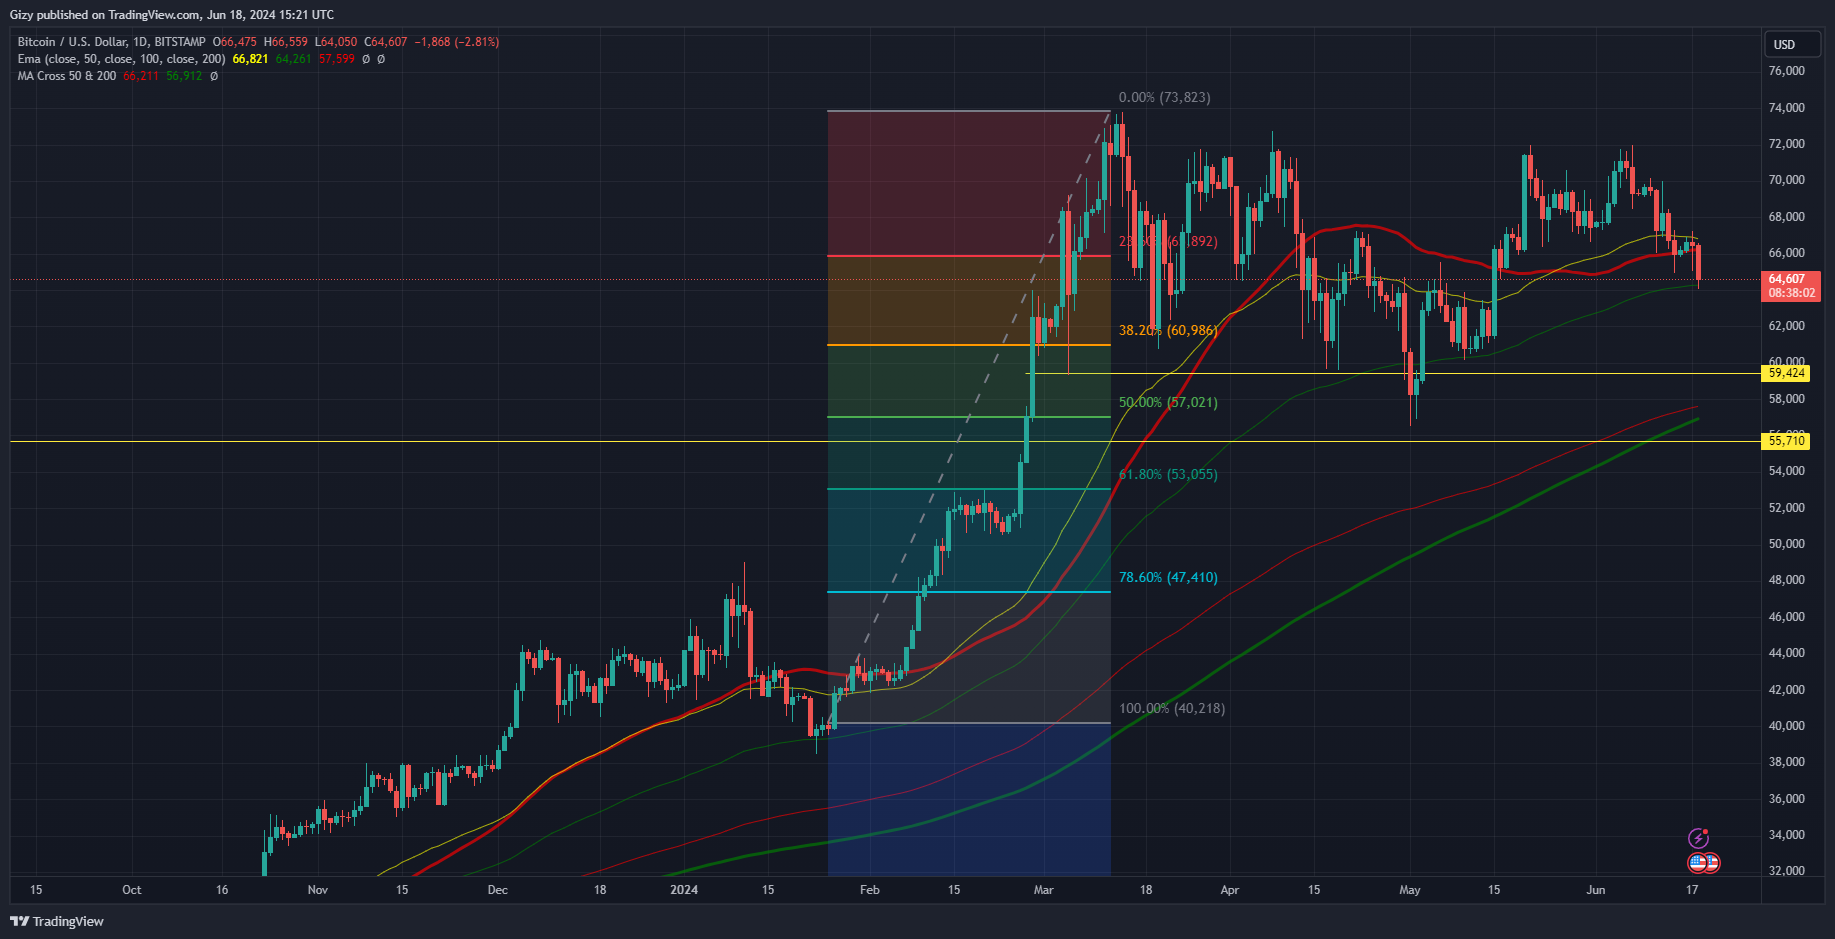
However, whales failed to react to the most recent decline. The fuel for the latest drop is exchange-traded funds. Traders withdrew over $500 million from various Bitcoin EFT providers.
A glimpse at indicators suggests that the asset rebounded at the 100-day exponential moving average. After losing the 50-day, the bears are mounting intense pressure on the 100-day EMA. If the pressure continues, the metric may crack.
Nonetheless, the relative strength index is gradually slipping below 40. The current price trend mimics May’s. If this plays out, the metric may drop as low as 36 before rebounding. Such a decline will also mean a return to the $60k support.
ETH/USD
Ethereum previously broke the $3,400 support but is trading above it at the time of writing. The assets recovered fast, and Ethereum is trading close to its opening price, having reclaimed the $3,400 mark.
It also bounced off the 100-day EMA, which traders consider a sign of bearish dominance. The fast recovery points to attempts at buyback. The current price suggests that the bulls are succeeding in this bid.
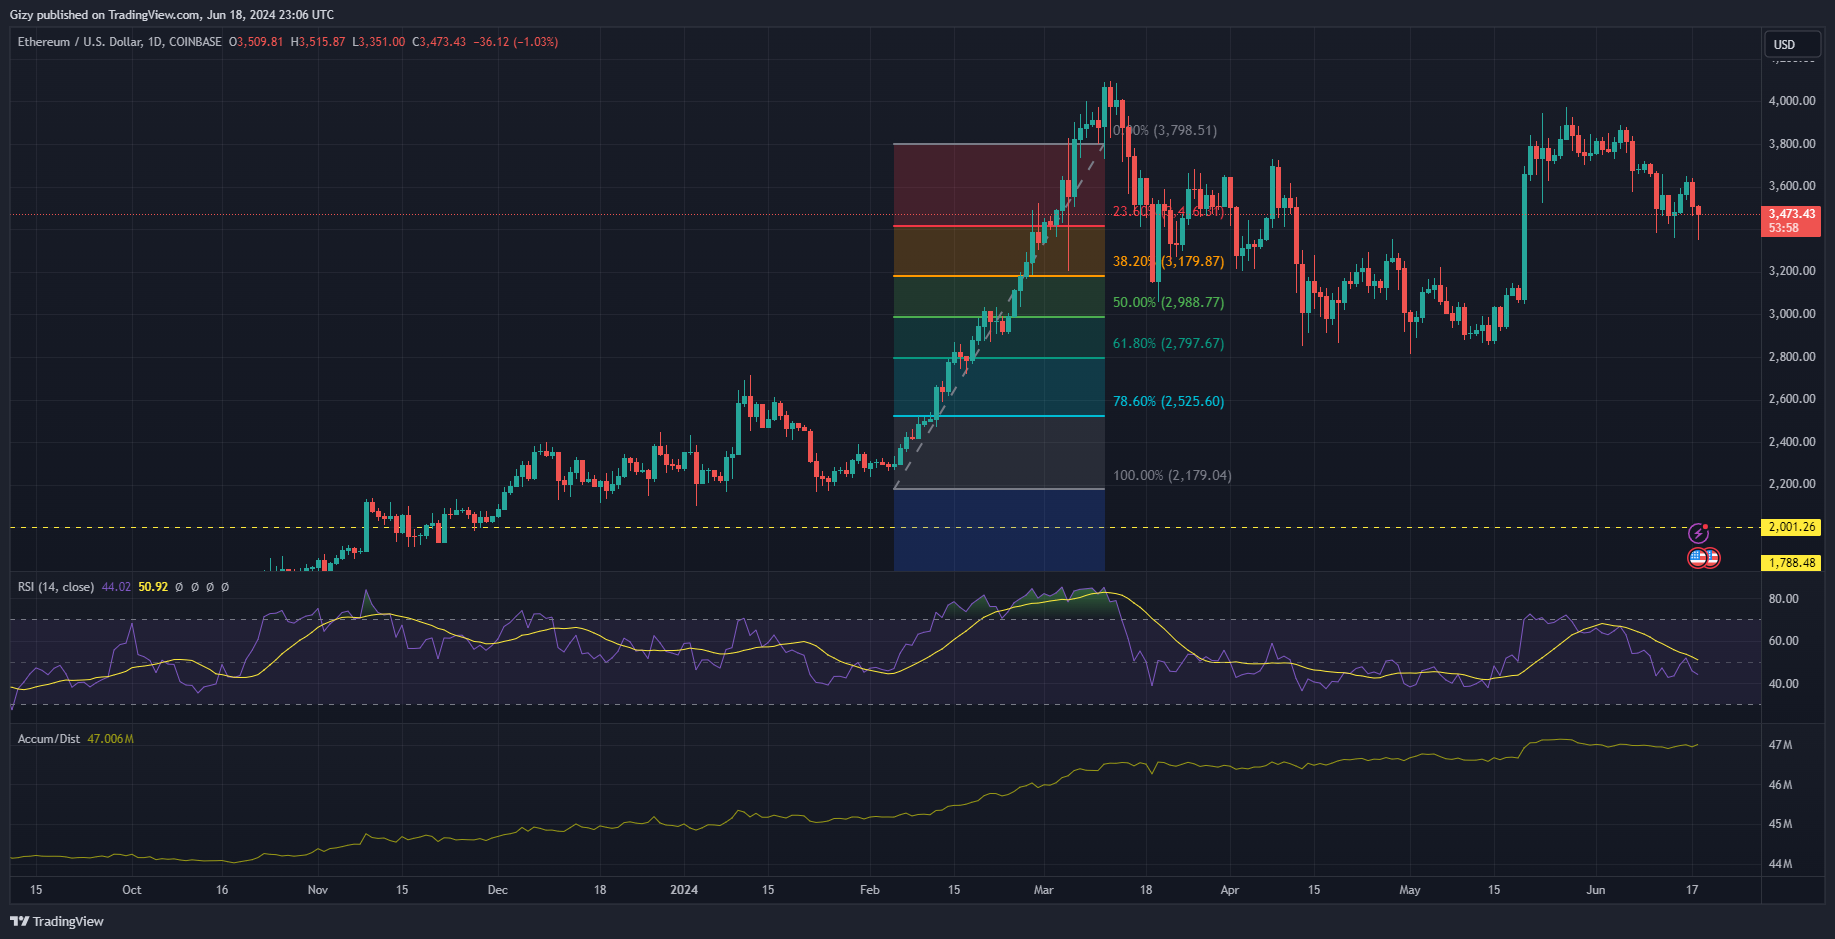
Nonetheless, the relative strength index points to the bears sustaining the selling pressure. The metric remains as low as 44 with no signs of recovery. On the other hand, the accumulation and distribution chart suggests an impending price improvement. While showing the most recent attempt by the bulls, it is also printing buy signals.
Many traders may not promptly heed these calls as they are unhappy with ETH’s performance since the spot ETF approval. The asset price has not been up to expectations. They expected a flurry of massive increases following the approval but this never happened. Iht remains to be seen when it will start.
Nonetheless, the largest altcoin is exchanging at $3,482 which means it reclaimed the key level. It is also trading above the 23% Fibonacci retracement which indicates that the asset will continue to hold this key level due to massive demand concentrations around it.
With reading form A/D suggesting an ongoing buyback, the bulls may continue this trend over the next five days. The nidcator hinted at a small amount of purchases which may not result in the “fireworks” result many expect. ETH may attempt $3,700.
BNB/USD
Binance saw rapid deceleration from $680 last week as traders took profit. Last week’s downtrend is a continuation of the previous week’s descent after the asset peaked at $720. It lost over 9% during the previous seven-day period.
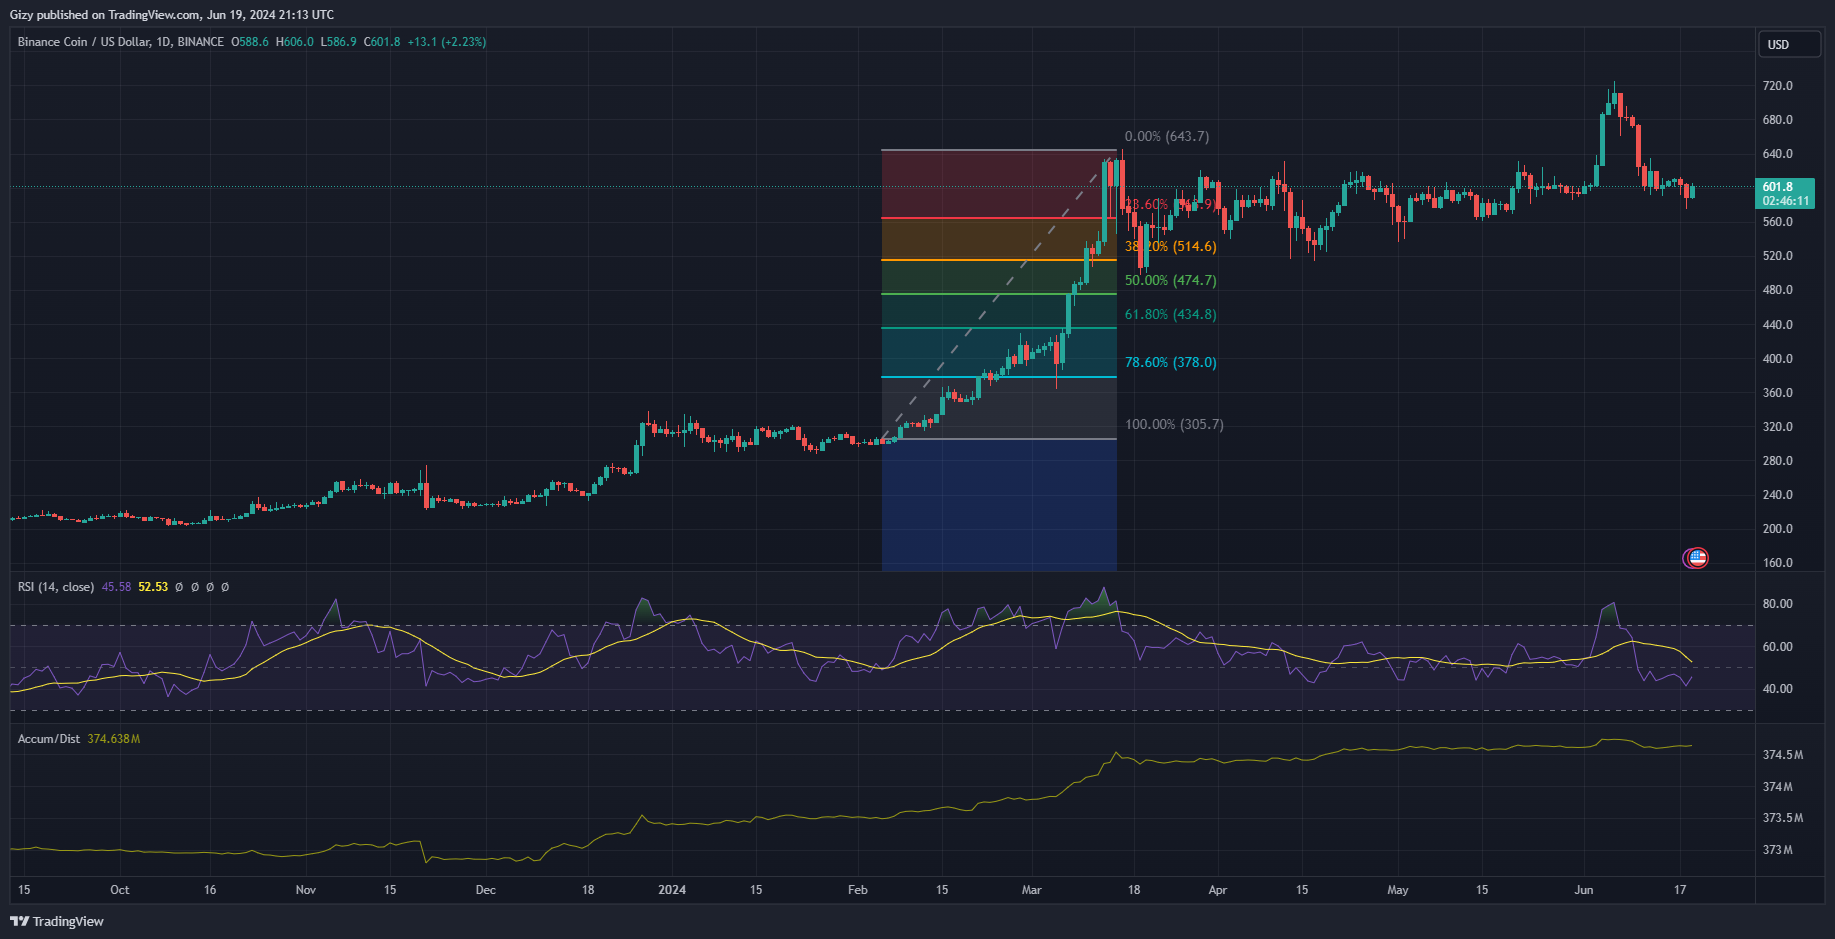
The current week is not kicking off on foot for the exchange coin as it suffered a dip below $580 for the first time in almost a month. The decline started from $605 and ended due to a rebound at $574. Currently seeing recovery, it may close the day with losses of almost 3%.
RSI is also returned to May’s low as it slips further below 50. The metric dropped to 41 as the selling pressure mounts. Nonetheless, the accumulation and distribution chart tell a more calmer story. It reveal small effort by the bulls to stop the ongoing sell off
The wick sticking out of the red candle is a clear indication of teh small results. The asset will continue to improve if the bulls continue the trend. However, the cryptocurrency will attempt to regain composure above its 50-day EMA at $606.
The hike to this mark may take place before the week ends. It is also worth noting that BNB reclaimed its pivot point. This level may serve as a critical level. It remains to be seen if it will hold for the entirety of the week.
SOL/USD
Solana is yet to recover from the downtrend that plagued it for the last three weeks. During the first two weeks of June, the asset lost over 6% and dropped to a low of $139.
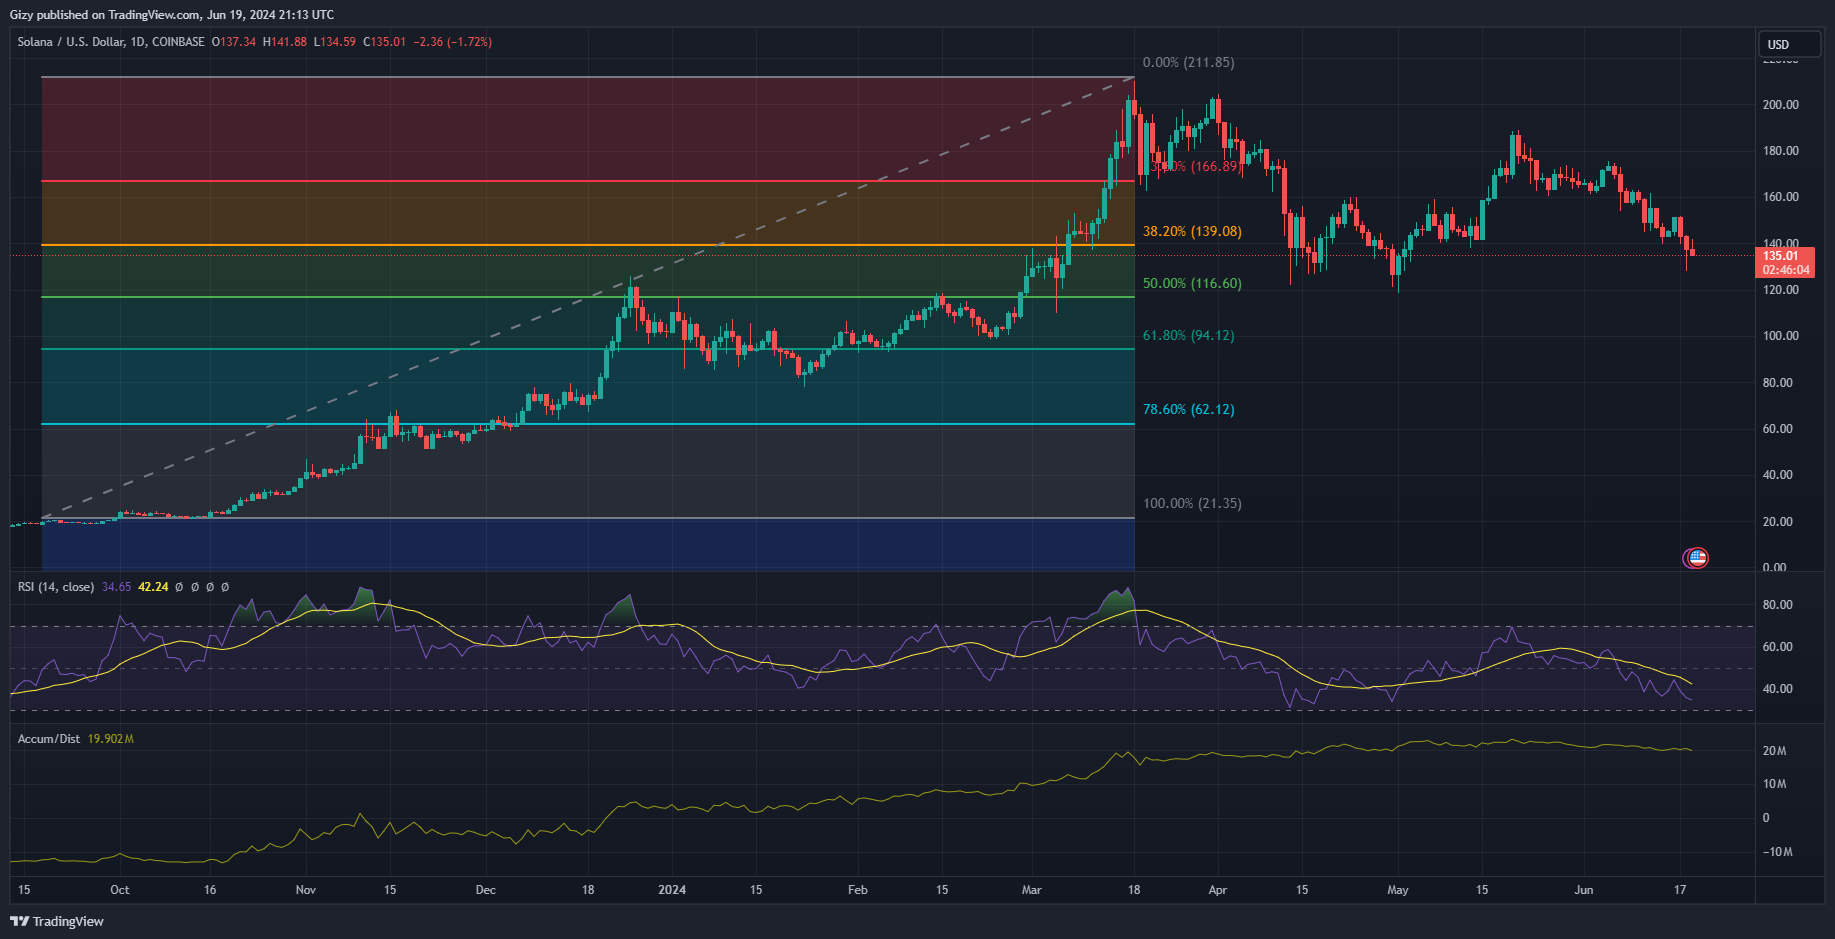
The decline continues this week as SOL sank lower. The fifth-largest cryptocurrency retraced to levels seen last on the second day of May. It started the day at $143 but faced massive corrections that result in a drop below $130. It rebounded at $128 and seen significant increases since.
It is trading at $137 as th accumulation and distribution channel shows a small shed of bullish action. With its slight upward arch, it is easy to conclude that the trend may continue. More traders may be keen on buying the dip this week. Nonetheless, the relative strength index continues decline. It is at 35 as the altcoin may be oversold if price do not improve.
Bouncing off its first pivot support, this may be the low of the week. Having seen two days of bearish action, SOL may form an horizontal channel and trade within its boundaries for the rest of the week.
