Ethereum has struggled to break above $2,800 since August 4 with no success. It appears to be groping for more demand but failing, resulting in its inability to gather momentum.
Nonetheless, the altcoin is trading within a horizontal channel as it maintains its local high and holds a critical support.
Ethereum is trading with no significant price changes as it rebounded from an earlier decline that saw it dip to a low of $2,611. The most recent low may indicate an impending momentum buildup as the asset registers a new low, higher than the previous one.
Indicators also point to an impending breakout this week. On-chain data suggests the asset is gearing up for further price movement.
Exchange Reserve Resume Downtrend
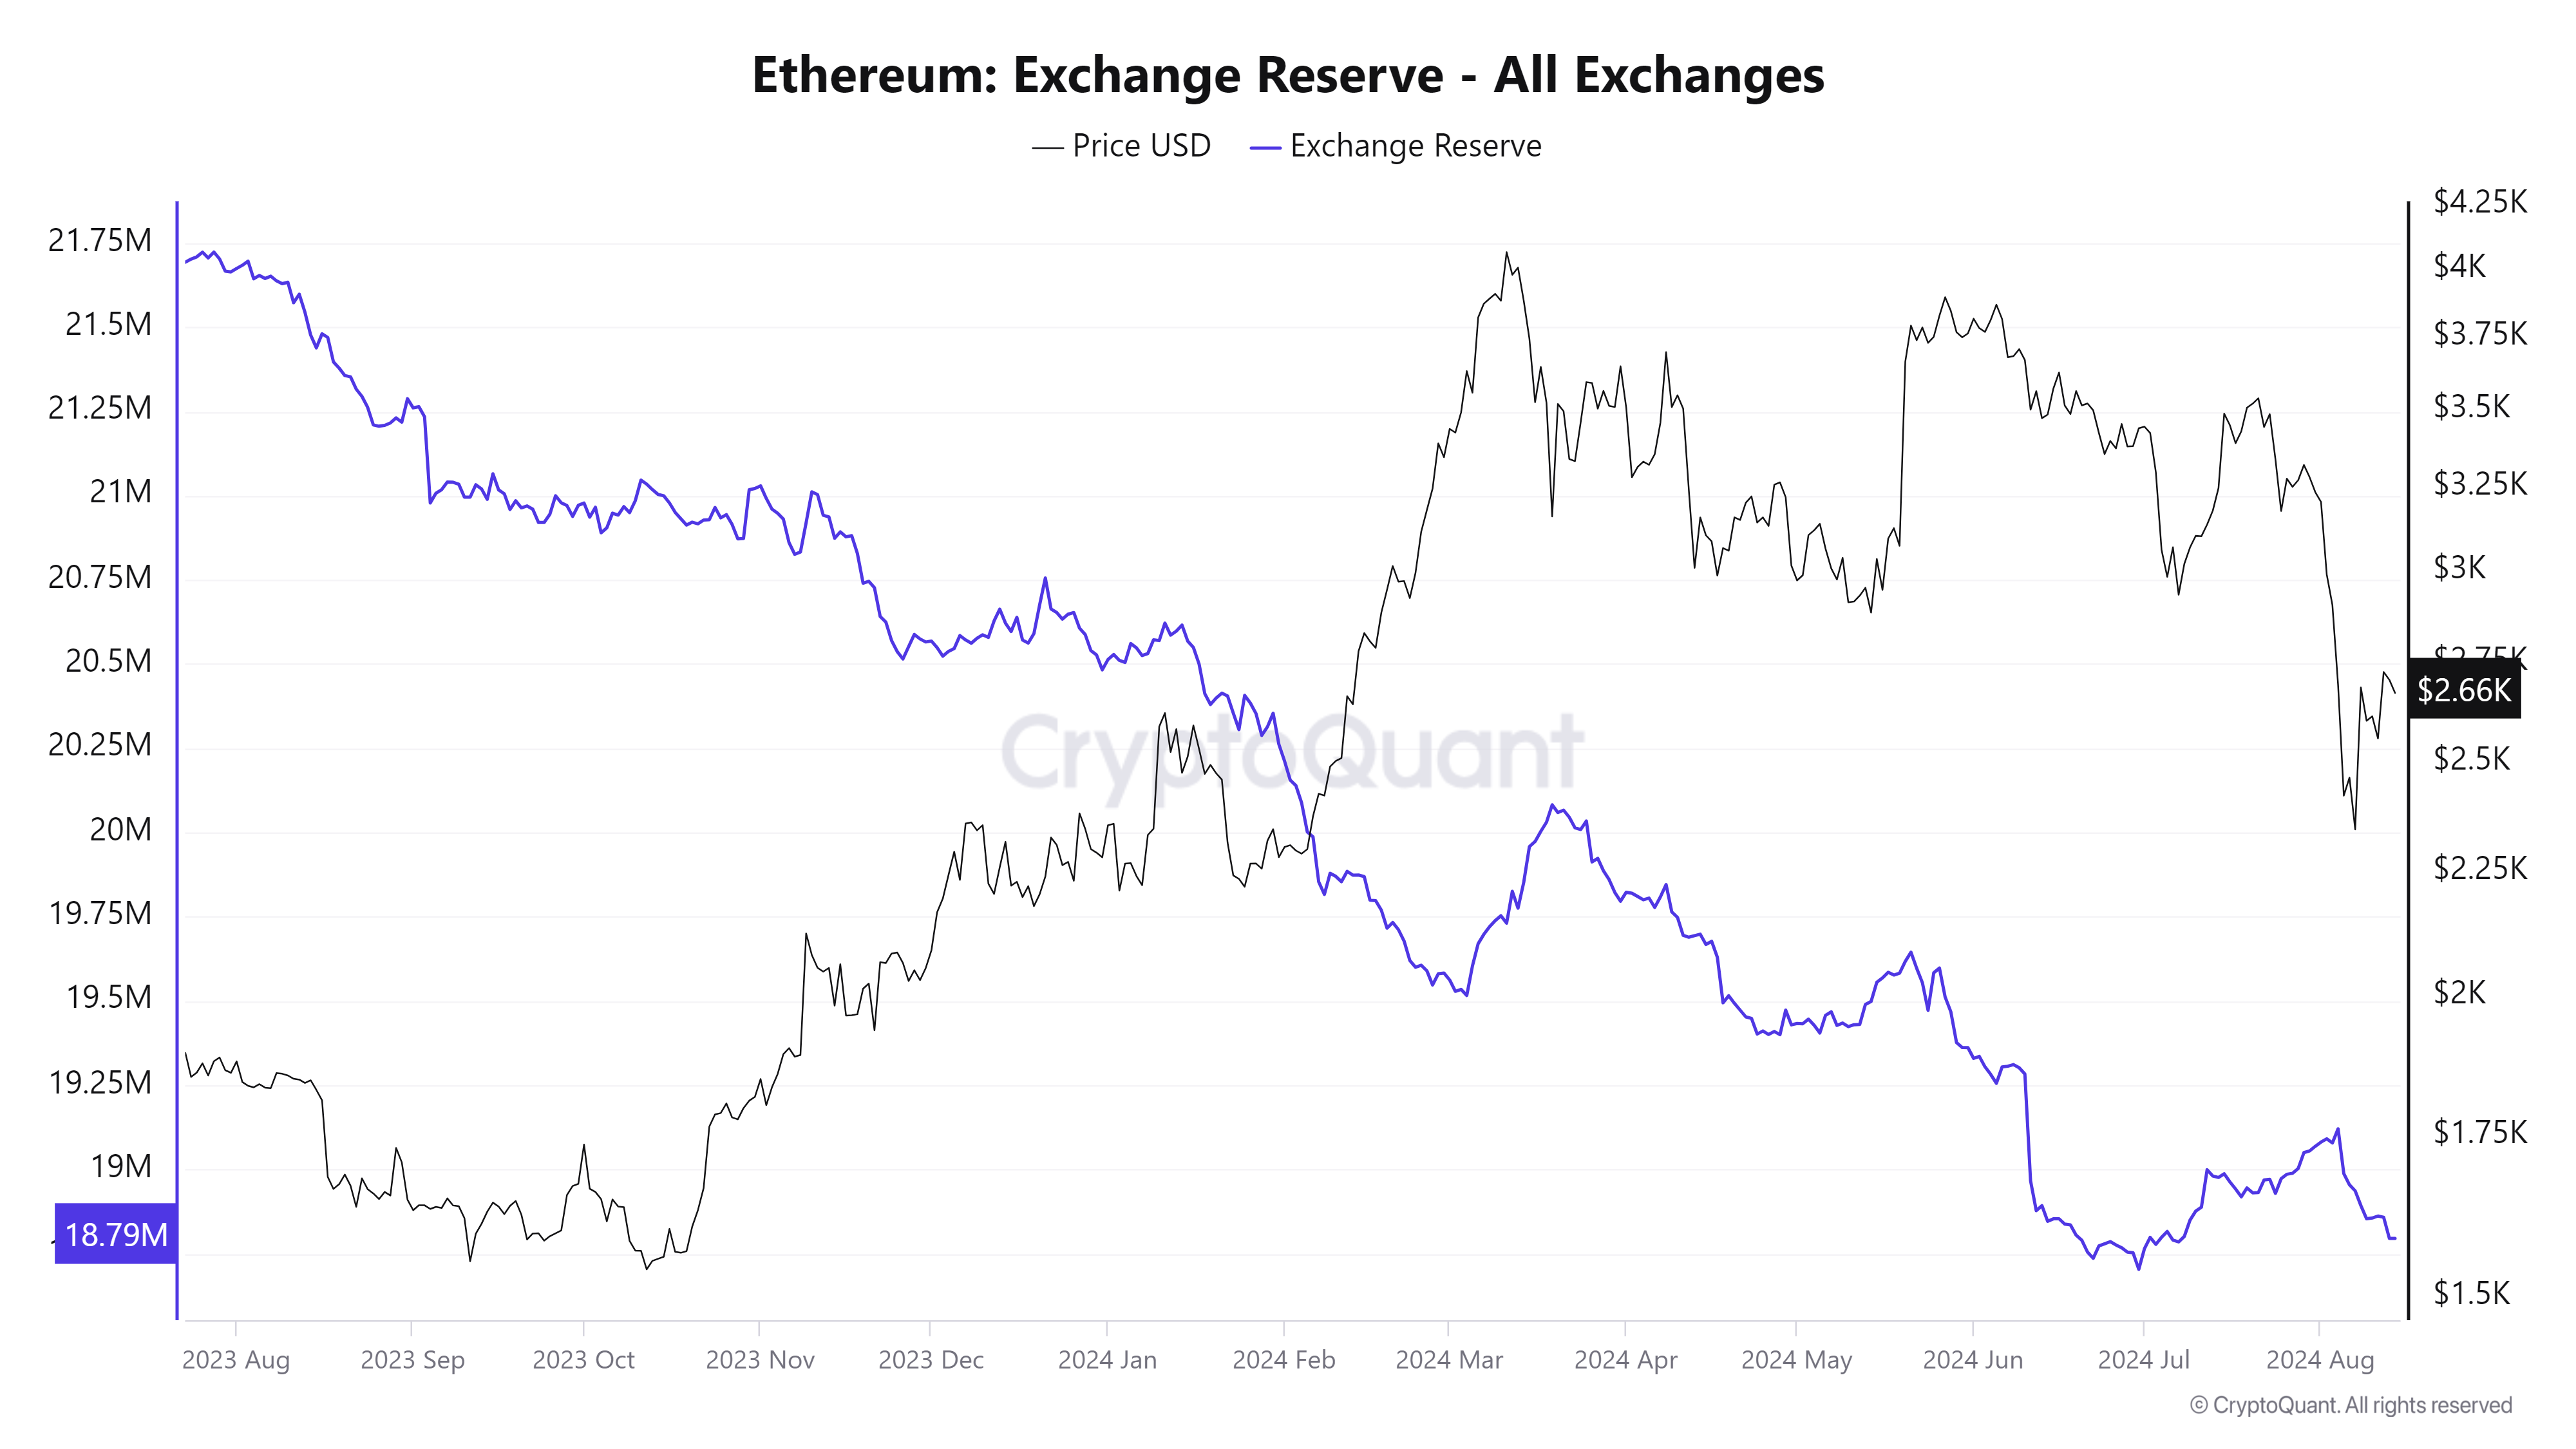
The largest altcoin struggled with massive downtrends over the last two weeks. On-chain data suggests that it was due to massive deposits from traders into exchanges. It also indicates an enormous selling pressure from these sellers.

The latest data from this metric point to the asset seeing a significant change in this trend. Exchange reserves have been decreasing since August 3, dropping by almost 300,000 ETH.
The continual drop in Ether remaining in exchanges indicates that the asset is seeing notable buying volume amidst the most recent price trend. Although prices are not following the volume, it suggests that prices will follow in the coming days.
However, trader’s sentiment is mainly bullish. For example, ETFs are seeing significant inflow amidst the downtrend. US traders are also buying the cryptocurrency as the Coinbase Premium is positive. Asian traders are yet to get in on the bullish sentiment; Korea Premium is still negative. They may be the catalyst for the next surge.
Derivatives are also registering notable inflow as the funding rate is rising. There are also active traders in this market as interest rate surges.
The on-chain Relative Strength index points to the asset seeing equal pressure from buyers and sellers. The metric is neutral at the time of writing,
Ethereum had a Bullish Convergence.
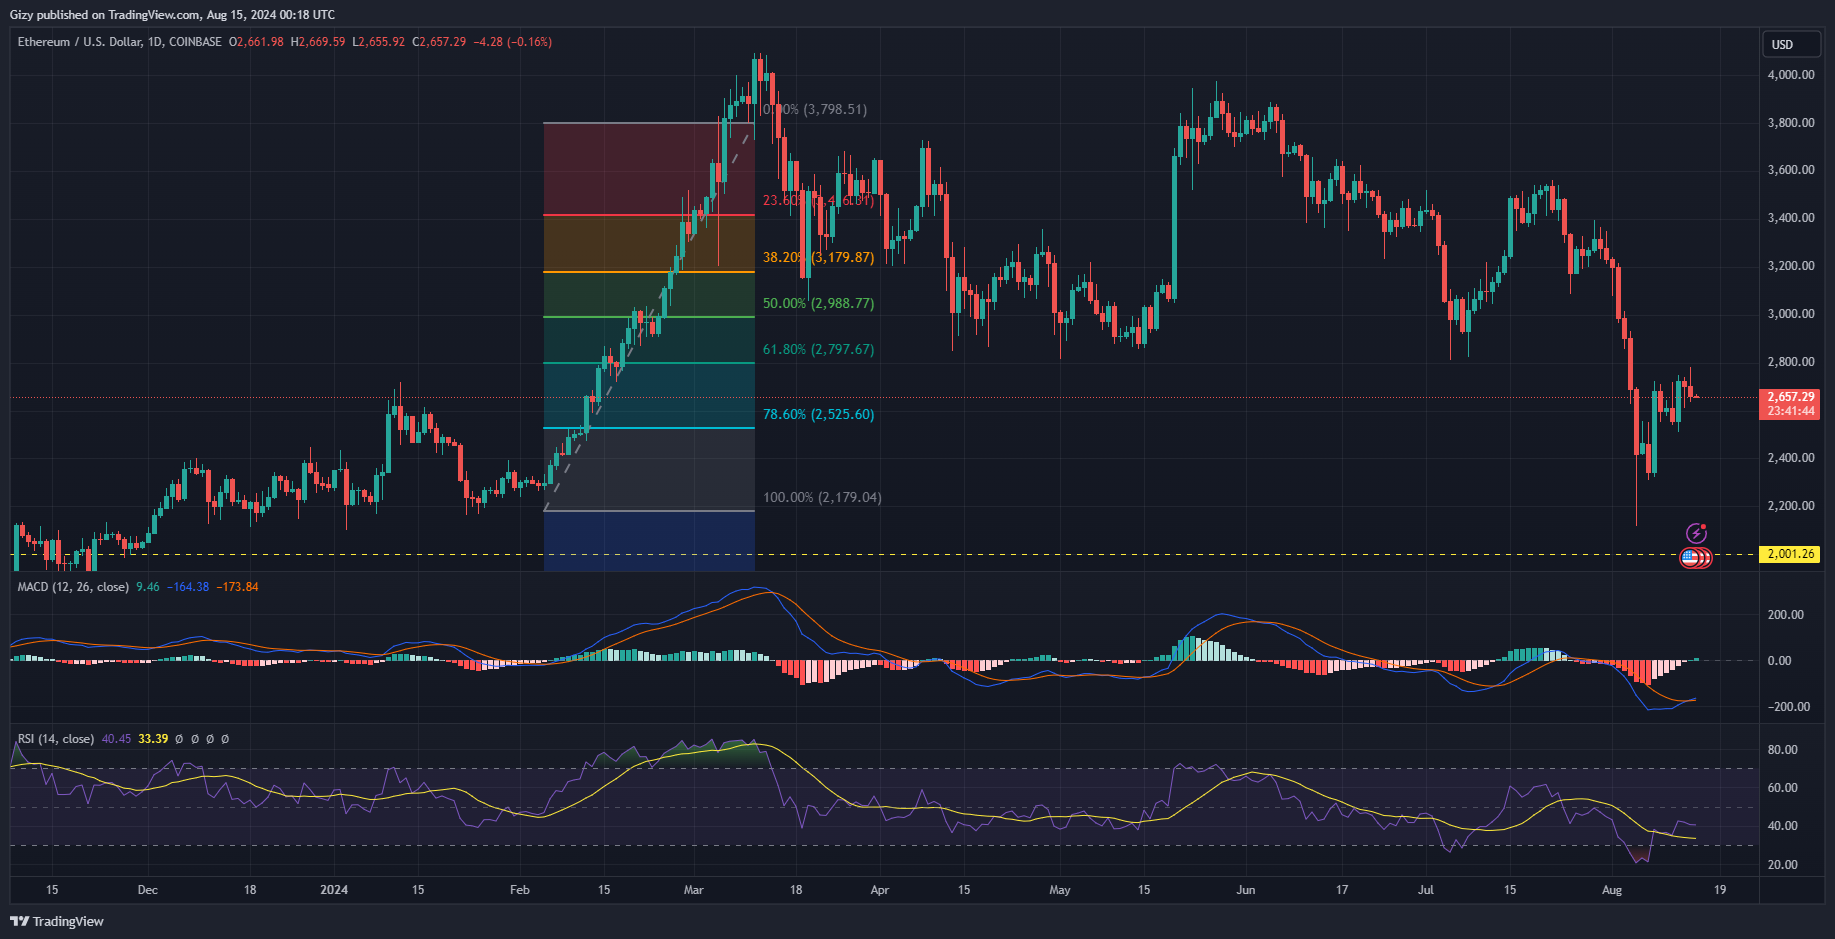
Ethereum has not registered any significant price changes in the last 48 hours. It printed a candle with a small body; the same trend continues today.

In accordance with the on-chain RSI, the 1-day relative strength index is also neutral. It is trending almost parallel during this period as the ears appear edging. It dropped from 42 to 40 and may continue the trend if trading conditions remain the same.
The moving average convergence divergence is printing buy signals at the time of writing. Although not pronounced, the metric displayed bullish convergence. After halting the massive decline, the 12-day trended parallel exponential moving average.
The 26-day EMA continued downwards, kicking off the prospect of a positive interception. With the ongoing divergence, the altcoin is in for more price increases.
Ethereum may surge above $2,800 if trading conditions improve. Breaking this critical level could result in a return to $3k.
BNB Bulls are Accumulating
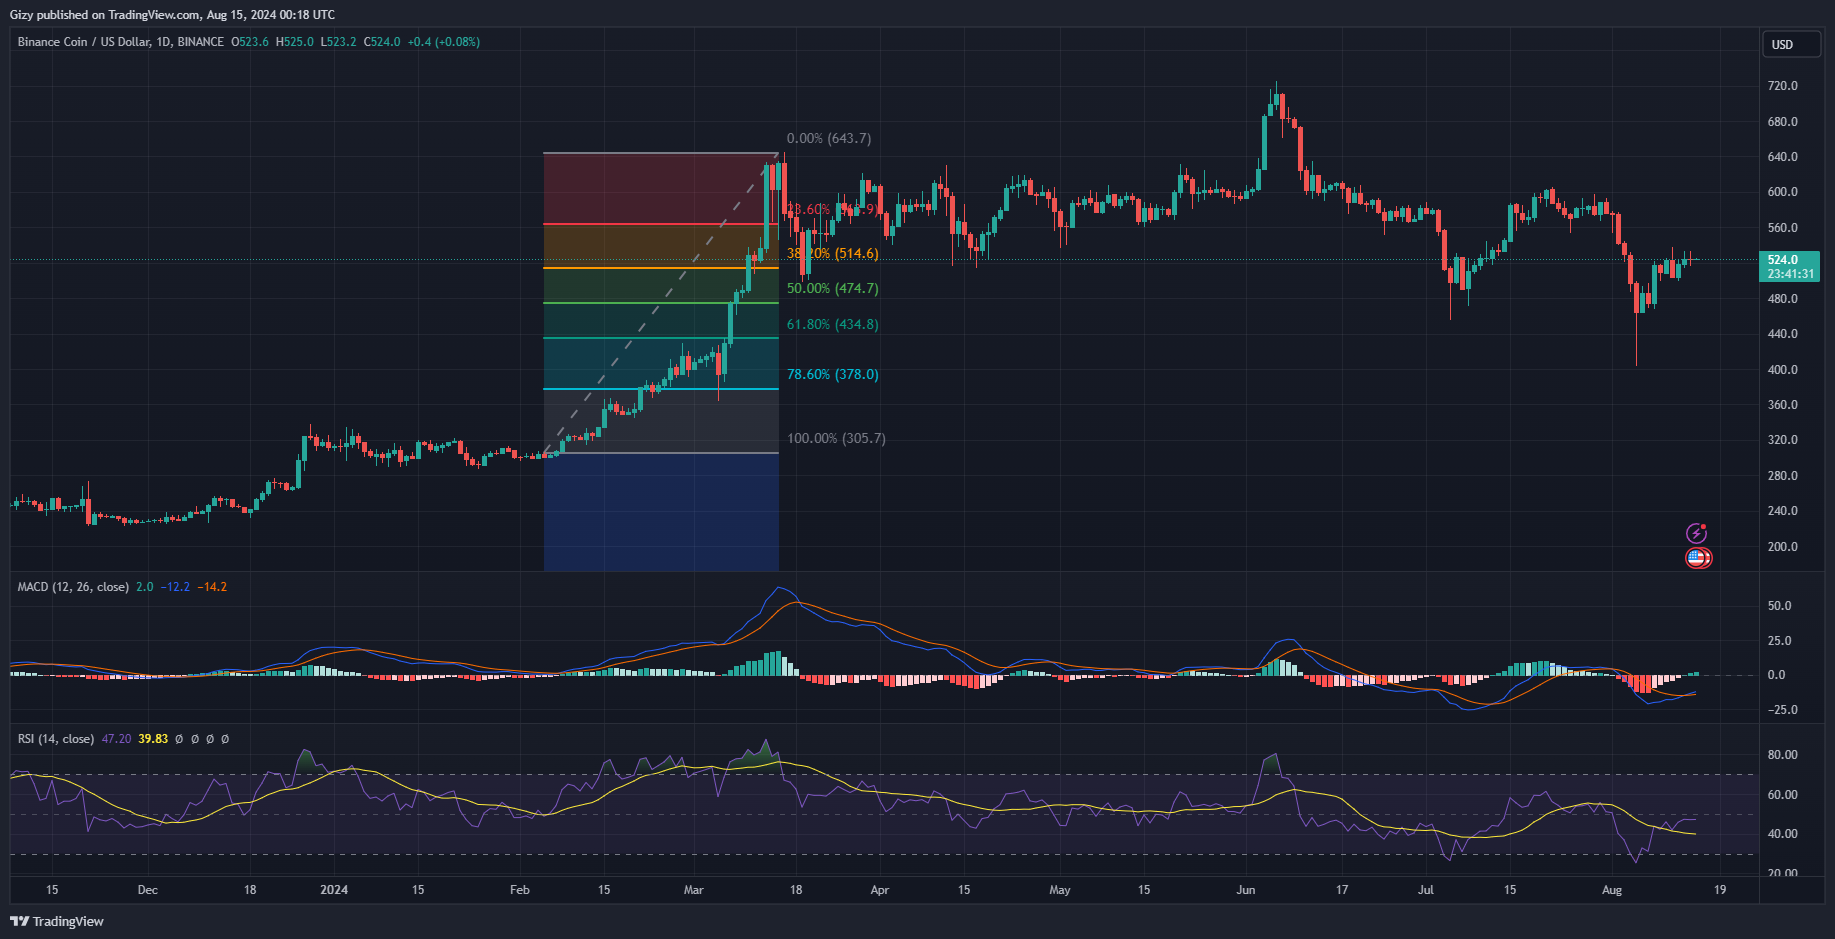
Binance coin has traded almost horizontally for the past three days. During this period, its RSI has maintained the same reading. Nonetheless, it is showing bullish signs amid the stable price.

The moving average convergence divergence is displaying a bullish interception. It completed the bullish convergence during the previous intraday session. The metric is displaying an ongoing bullish divergence.
Although prices are yet to react to the trend, the latest interception is an indication of an impending uptrend. It may result in the coin surging above $550 in the coming days.
