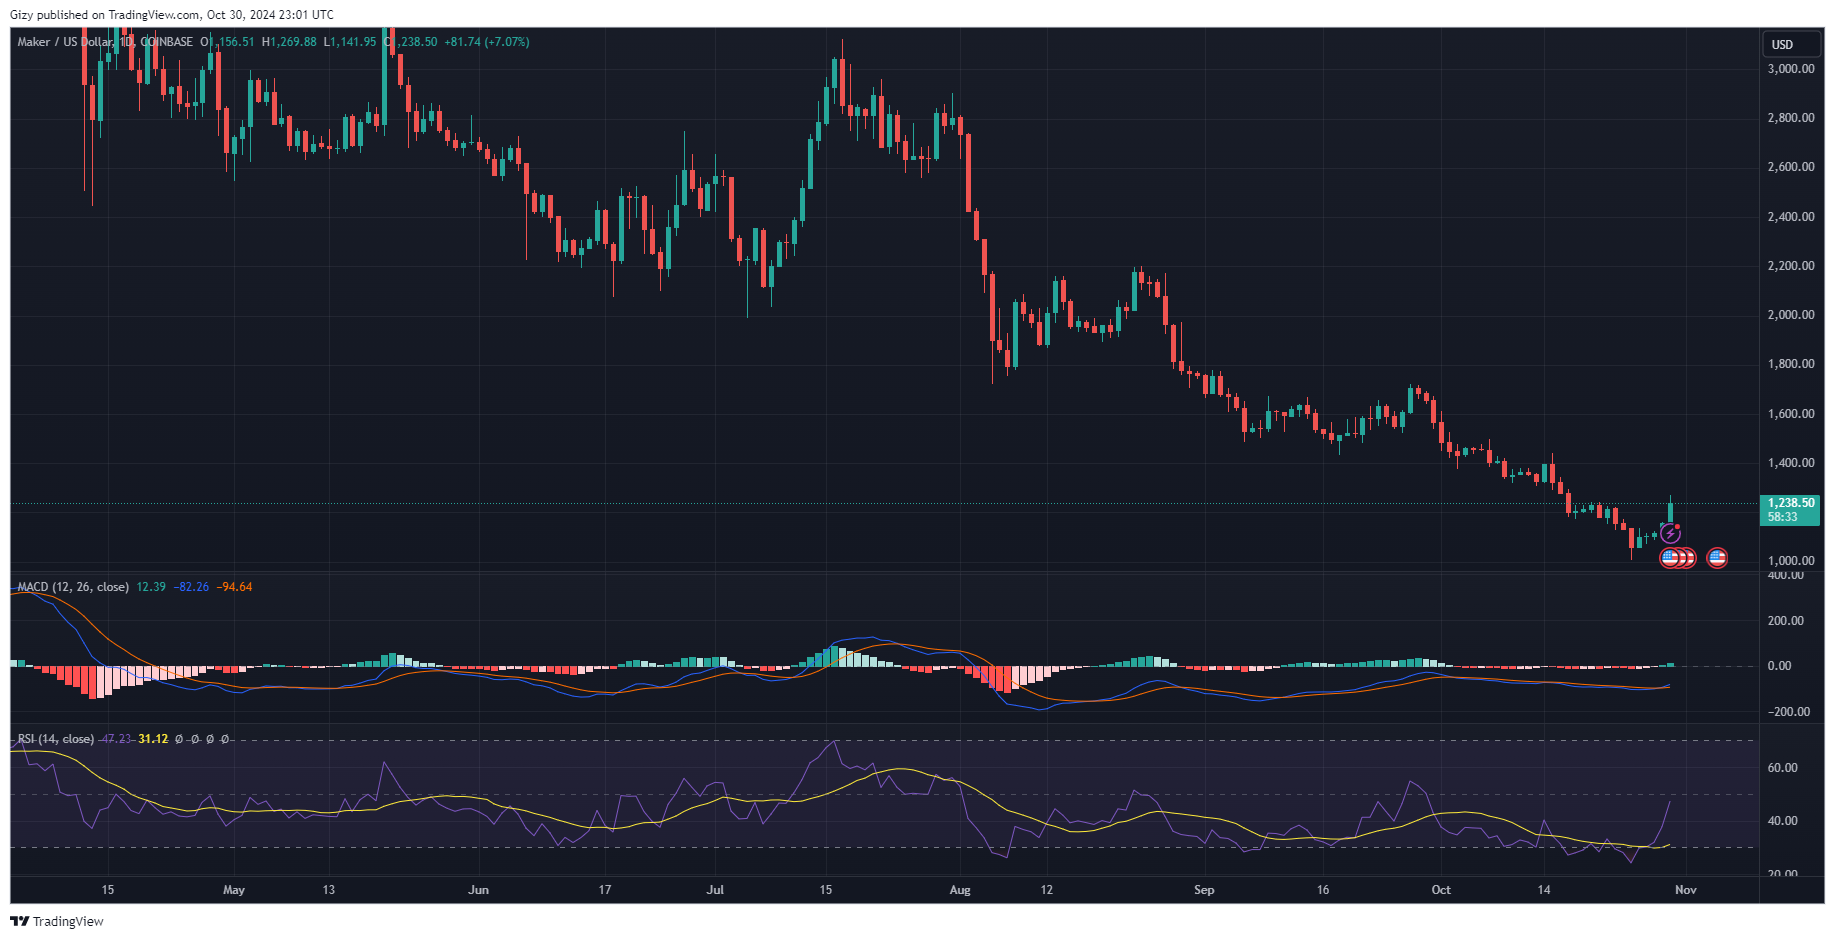
A look at the top gainers over the last 24 hours points to Maker as the biggest. It may close the current day as one of its best-performing since August.
The latest conclusion comes after the asset opened the day at $1,156 but surged after a slight decline. It broke above its seven-day high at $1,244 but faced massive rejections at $1,269. Currently up by over 7%, the bulls will look to continue the surge.
Nonetheless, the most recent surge is not isolated. The buyer gradually built momentum, with the hikes increasing each day. It saw a more than 3% increase during the previous intraday session, continuing its recovery.
The current day marks the fifth consecutive session of consistent increases since Friday. It gained over 16% over the last 24 hours, and indicators point to more underway.
Its Bullish Divergence
A close look at the one-day chart shows that Maker has been on a downtrend since July, with occasional hikes. The moving average convergence divergence mirrored the price movements and displayed a negative interception in September. It has dropped by almost 30%, but an end may be in sight.

At the time of writing, MACD prints buy signals. A few days ago, the 12-day EMA intercepted the 26-day EMA, and a bullish divergence is underway. Although it had such similar interceptions a few times since July, the most recent may be different for several reasons.
One such is the fact that the general crypto market is mostly bullish. This means that investors are actively exploring different assets in the industry, and MKR is one of them. The latest surge will undoubtedly pique more interest.
The relative strength index sheds more light on why this time may be different. The altcoin has been oversold for the most part of the month, alternating between 32 and 25. It recently dipped to its lowest last week and shows an ongoing attempt at recovery, hitting 48 at the time of writing. The last time it saw such decisive uptrends, it peaked at 73.
The Bollinger band shows that Maker dropped below the lower band on Friday. It is trading above the middle band at the time of writing. This is the first time the asset surged above the highlighted mark since September. Nonetheless, it tested the upper SMA the last time it did and may repeat this action.
The accumulation and distribution chart displays a sharp rise in accumulation as the bulls soak up the excess supply. The average directional index is declining as the downhill movement loses its strength. Unlike other times, the drop is sharp.
How High Will Maker Go?
The altcoin may gradually reclaim lost levels. The Fibonacci retracement levels point to key marks to watch as the uptrend continues. Since surging above the 23% mark at $1,238, it may attempt the 38% level at $1,354. Previous price movement supports this claim, as the 23% is crucial support.
The next critical level to watch is the 50% mark at $1,448. It previously poked at the barrier using the $1,354 support. Nonetheless, the asset may see notable rejection around this mark, which may mean a breakout from the Bollinger band, as the upper SMA currently sits at $1,390.
In other news, Chainlink has seen significant price increases over the last 24 hours. It surged to a high of $12.4 and may close the day with gains exceeding 5%. However, the Bollinger bands hint at the end of the uptrend as the coin surged above the upper band.


