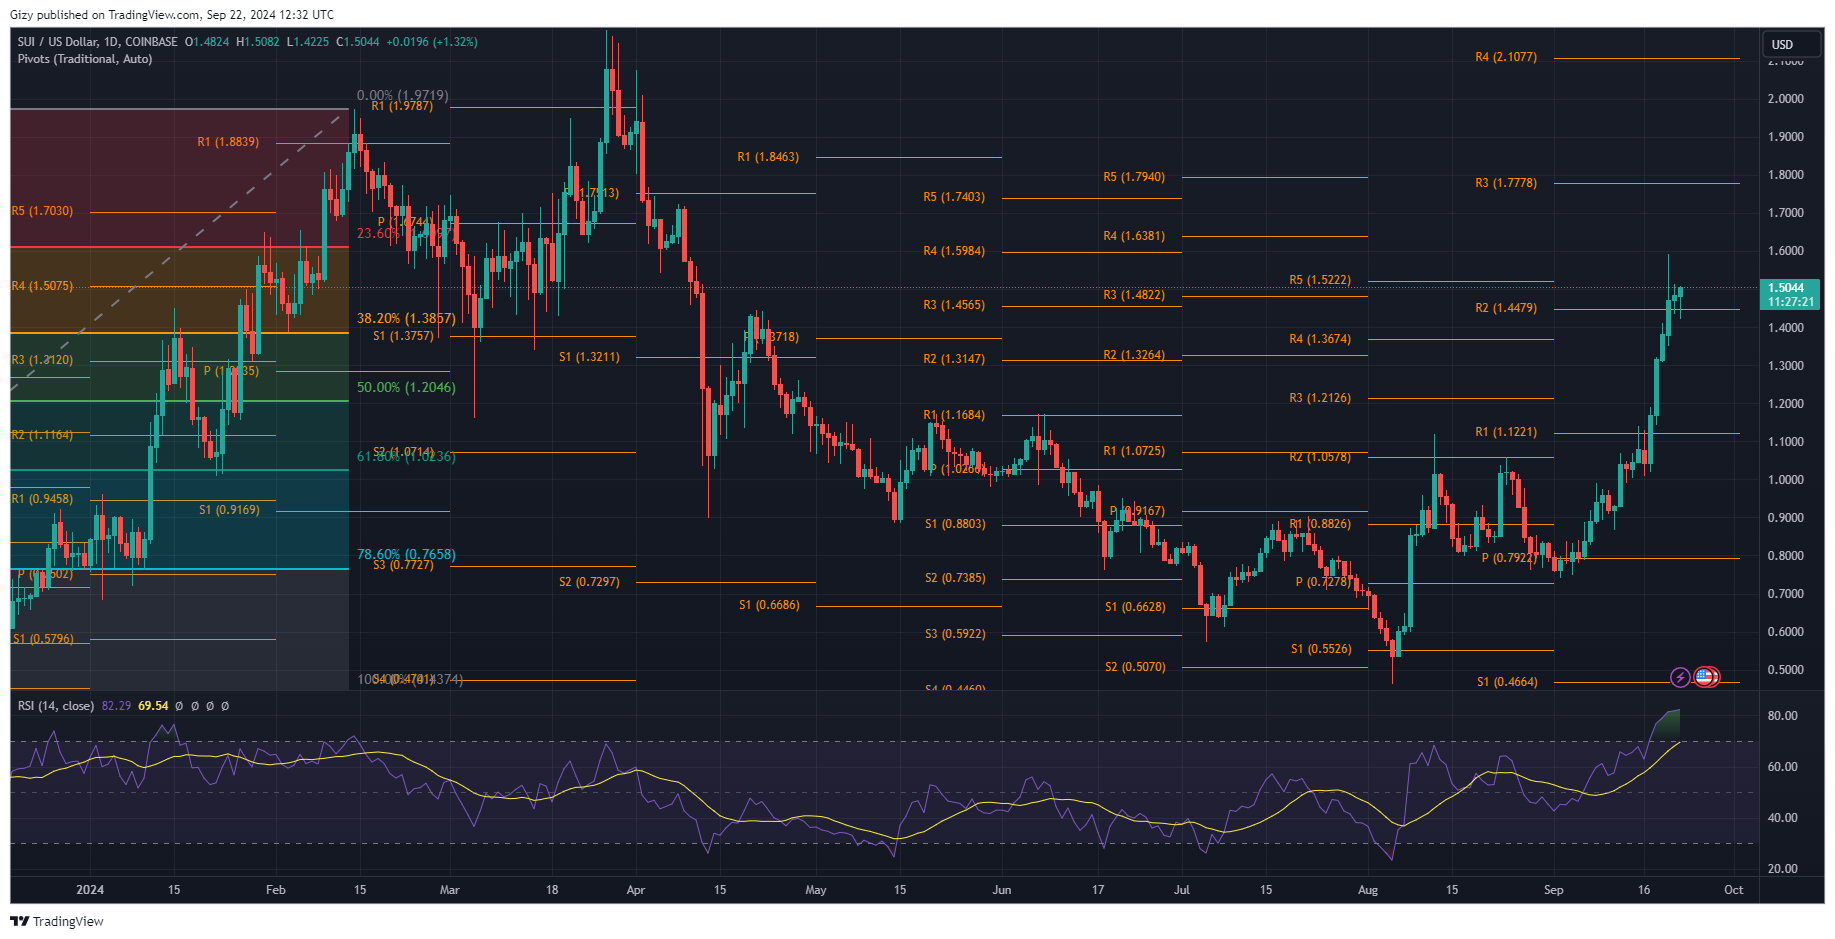
SUI has been on the uptrend with significant gains. Trading actions over the last six days has been mostly bullish as it registered massive gains.
One of the biggest increases happened on Wednesday when it started trading at $1.16 but surged to a high of $1.32. The day ended with significant gains exceeding 12%, adding to the massive increases it had the previous day.
The uptrend continued as the cryptocurrency gained over 41% in the last six days. A few days ago, it climbed and tested the $1.60 resistance but retraced after hitting it. It has since been unable to continue the uphill movement, causing fear of a possible downtrend.
SUI is Due For Corrections
The 1-day chart shows several key indicators printing red signals. For example, the relative strength index (RSI) is 82. Traditionally, most uptrends end close to 75 as the asset is overbought above 70. The exceptional bullish push saw traders ignore the warnings and stock up.

Trading actions in the last 48 hours show that the bulls might be getting exhausted. Prices remained below $1.50, and all attempts at a breakout failed. The asset also registered a new low compared to the previous day.
With RSI above 70, the cryptocurrency is due for retracements and may start the trend soon. The momentum indicator adds to the growing possibility of a massive as the metric is on the decline as the bulls are struggling to continue the uptrend.
The Bollinger bands are also bearish. SUI is exchanging above the upper band, indicating a possible end to uptrend.
In the coming days, the asset will look to retest the $1.60 resistance. It remains to be seen if this will happen. However, a decline is almost inevitable. The Fibonacci retracement points to notable demand concentration around the 38% fib level at $1.38.
If this critical mark fails, the asset may retrace further, hitting the first pivot resistance at $1.12.
The price struggles may continue as SUI continues to see less trading volume. For example, volume is down by over 40% in the last 24 hours.
