
Cardano has been on the decline since Saturday, losing almost 2% when the trend initially began.
The downtrend worsened the next day, resulting in another significant drop. Nonetheless, ADA saw its biggest dip of the 4-day period on Monday, losing over 3%. Selling slowed down on Tuesday, but the asset posted notable losses amid recovery attempts.
It remains to be seen if the coin will resume its downtrend in the coming hours. However, it’s currently green, up by over 4%, effectively erasing almost all its losses since the week started. Wednesday brought much-needed relief, but questions remain about how long the uptick will last.
The asset showed the first signs of a rebound on Tuesday, halting its decline and erasing more than half its losses. The wick extending from the candle at the time showed that investors resumed buying after four days of massive selling.
They continued the pressure on Wednesday, triggering the significant hike at the time of writing. However, recent data from Santiment suggests that the accumulation is not a new development. Whales have been accumulating over the last six months, but prices are still plummeting.
Per the report, Cardano’s whales who held 100k-100m ADA added another 819 million units to their bag, which is almost 2% of the total supply.
However, with such massive accumulation, the asset is yet to surge as many expect.
Cardano Sheds 71%
The chart below depicts the massive accumulation by the highlighted cohort. However, on closer inspection, a pattern is revealed. Note that, as of August, buying was very aggressive but gradually cooled off. It means the bulls were unable to fully absorb the excess supply from sellers. Even so, some whales flipped bearish, taking profits during this period.

The result: ADA saw massive retracements amid the buying pressure. Since the eighth month, it has retraced by over 71%. The scale of the retracement is clearer on larger timeframes. Nonetheless, the asset is unable to surge as it is the trend with other cryptocurrencies.
Interestingly, with smart money moving into Cardano, retailers are dumping their bags. The trend among these small traders did not start last year; it has plagued the asset for years. At the time of writing, it is worse, which means there will be no strong recovery within the next six months if it remains the same.
In summary, although whales are buying and have maintained the trend amid the bear market, panicking retailers are holding ADA back.
However, the coin is up by over 4%, a result of bullish action in the asset. The charts suggest that the upward momentum will fizzle out in the coming days.
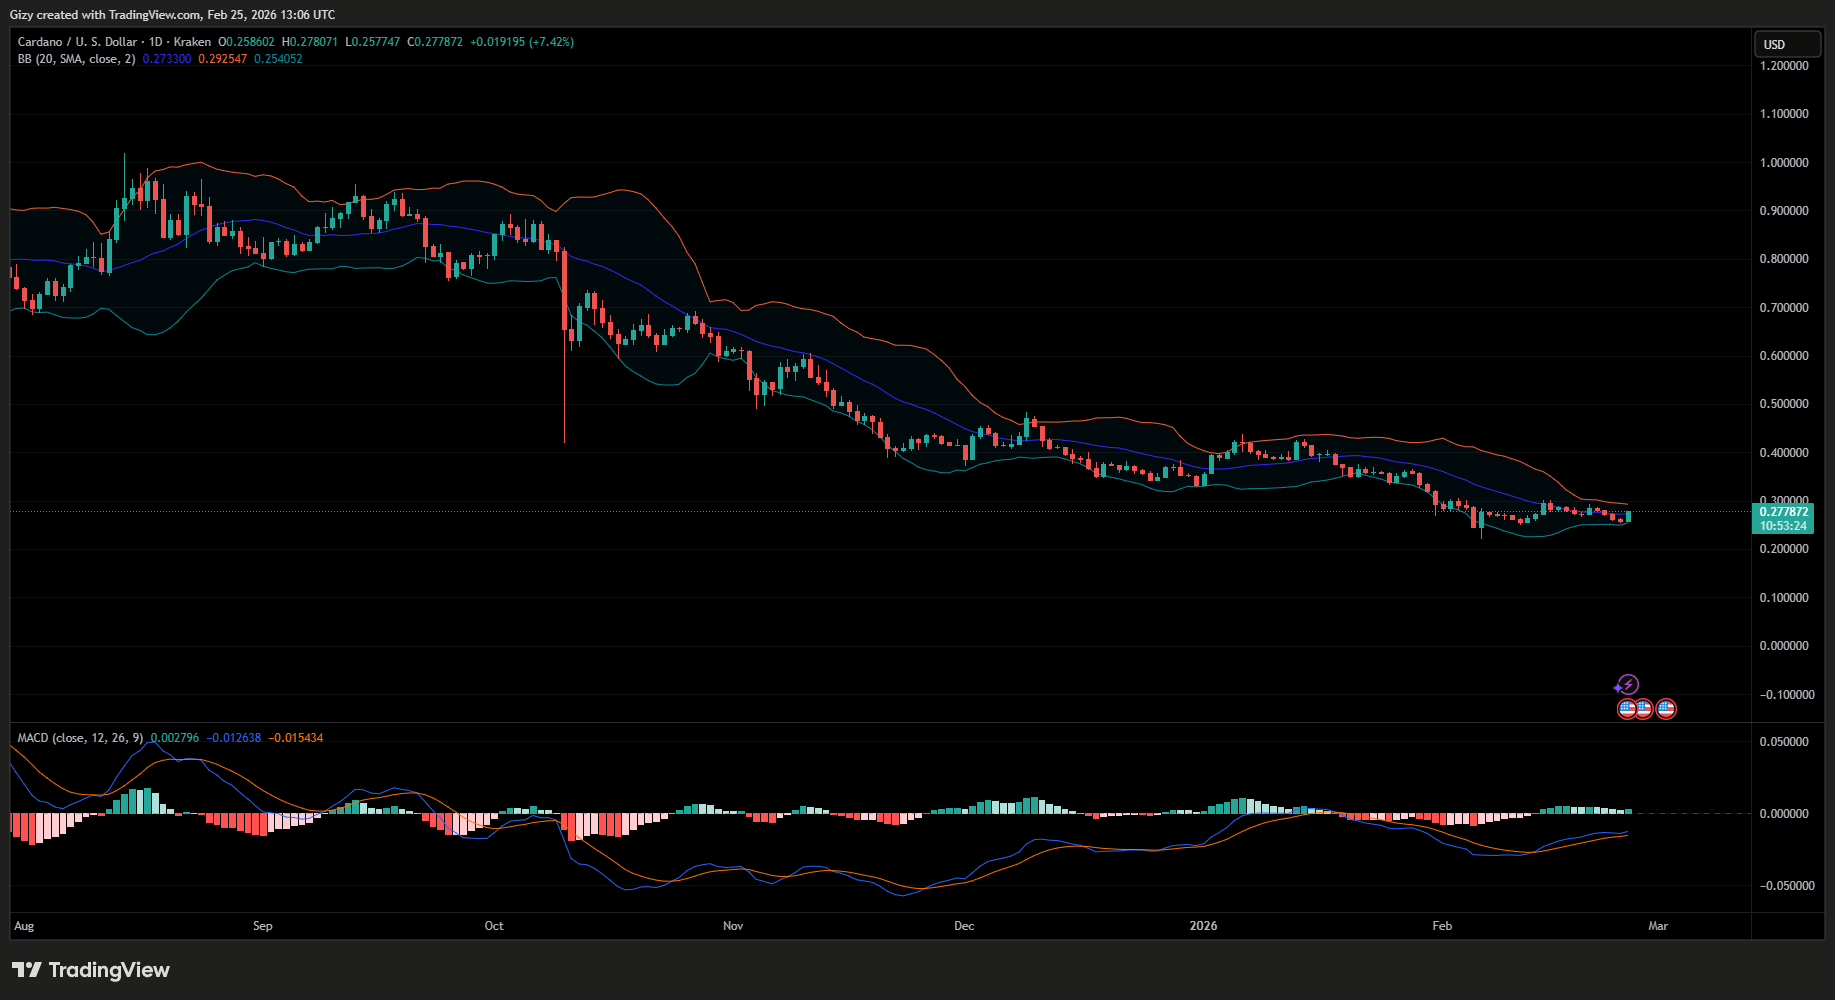
The first factor to consider is the moving average convergence divergence. It had a positive crossover two weeks ago but has shown the first signs of an impending reversal; the 12- and 26-EMA are closing the gap between them.
While MACD hints at further decline in the coming days, the bollinger band indicates that Cardano will experience more volatility in the coming days. The indicator is shrinking, a trend that only precedes a massive breakout.
What Does It Need?
Over the years, the hype surrounding Cardano has dwindled. While the whales have maintained steady accumulation, fewer retailers have shown interest in it.
A closer look at the 1-week chart shows the devastating effect of this trend. Looking back at the last three bull runs, 2025 has been the smallest. The first run in 2018 saw the asset gain a whopping 3000%. Its surge may be excusable, as ADA became a tradable asset in 2017.
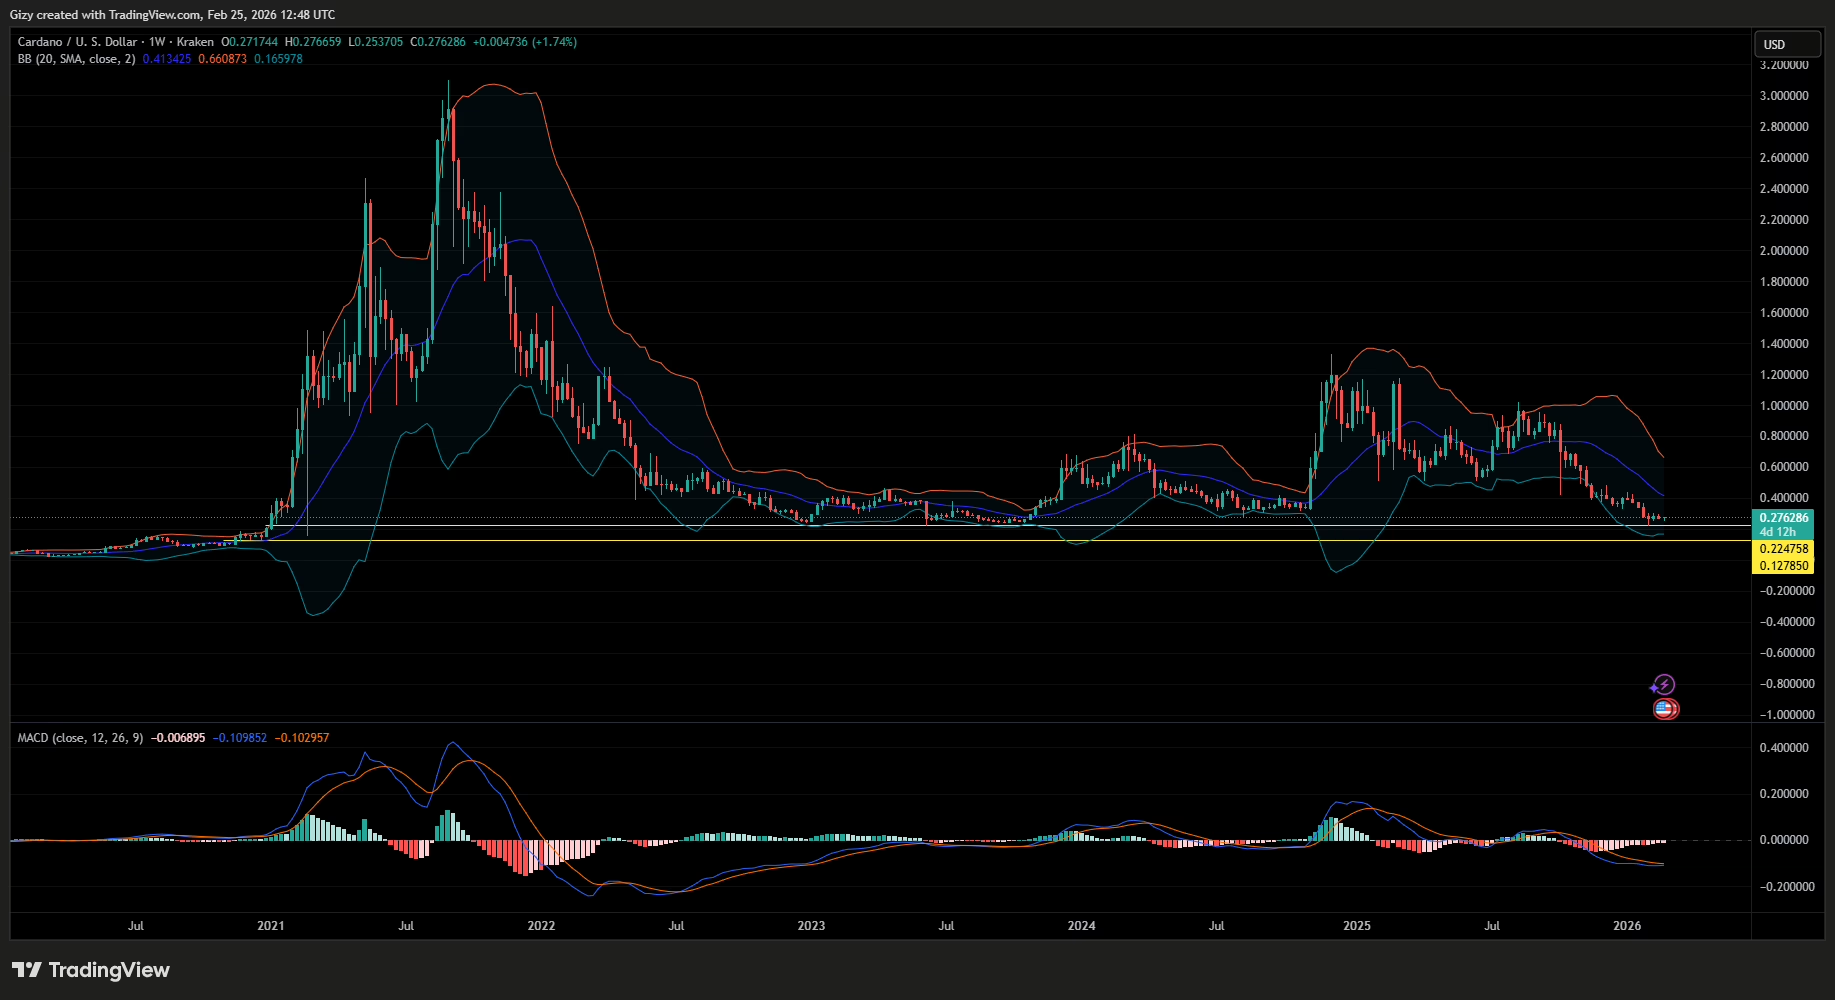
However, during the 2020-21 run, it gained over 2,700%. It surged from $0.10 to $3.09 in almost a year, but shed almost all its value over the next two years.
When the bull run resumed in 2024, ADA surged by only 450%, surging from $0.34 to $1.35. Compared to the last two runs, the 2024-25 run was the weakest. Interestingly, the smallest run happened when whales were massively accumulating. It proves that the asset has become less appealing to small investors.
It remains to be seen if the situation will change. However, the asset may be gearing to return to its 2017 low as the bear market worsens.
Nonetheless, the 1-week chart suggests a possible bottom. The bollinger bands on this scale show that since Cardano broke out in August, it has been on a downtrend. Although it has tested the lower band, the indicator has since expanded. This time, the lower band is at $0.165, the possible bottom.
The altcoin may be gearing up for another 30% retracement in the coming days. It will also mean an 87% decline from the August high.
Cardano Plot Decline to $0.12
While the Bollinger bands on the 1-week chart hint at a significant rebound to $0.165, prior price movements push the target lower.
A closer look at the chart shows that the next tough support lies at $0.224. Cardano retested this mark a few weeks ago, but rebounded. In hindsight, this is not the first time it has tested at this level. For example, it hovered close to it in 2022 and 2023. Before this action, the last time it traded was in 2021.
It indicates notable demand concentration at the mark. If the bulls fail to defend this support, the next area of such concentration is $0.127.
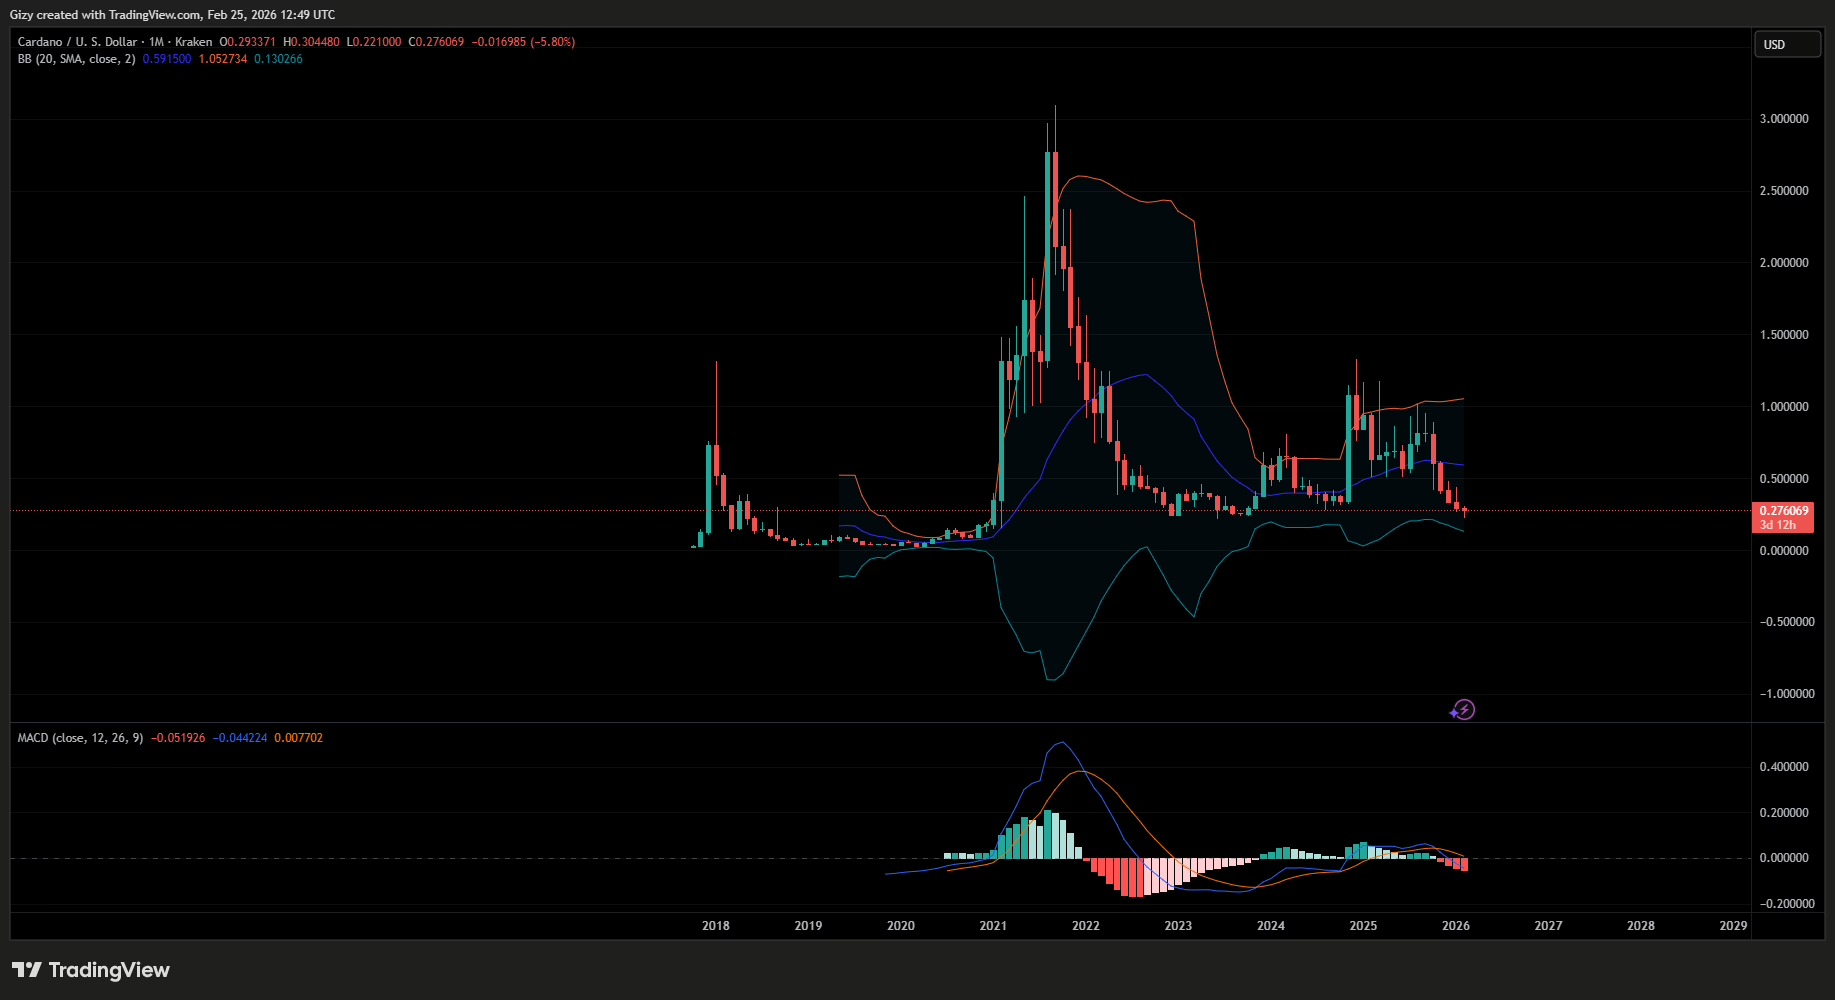
Interestingly, the bollinger bands on the 1-month chart support a drop to $0.12. Its lower band lies close to this critical level, and previous price movements have seen ADA retest it. If the trend repeats, this may be the bottom.
In summary, Cardano has seen progressive disinterest from retailers amid a wave of whale inflows. If the trend continues, it may not register any significant increases over the next six months. Additionally, it will resume its downtrend in the coming days, with the bottom set between $ 0.12 and $ 0.165.
Get Trending Crypto News as It Happens. Follow CoinTab News on X (Twitter) Now


