Solana surged by almost 2% during the previous intraday session as it flipped a key resistance. It started the day at $155 but surged to break the $160 barrier. It had limited success as the surge above it was shortlived. It soon retraced and ended the day close to its opening price.
The asset also saw massive bullish action on Thursday as it recovered from Wednesday’s decline, which saw it lose over 3%. It started the fourth day of the week trading at $147. It soon saw a massive spike in buying pressure, which saw prices hit a high of $158. Nonetheless, the day ended with gains exceeding 5%.
Currently up by over 8% on the weekly scale, the altcoin may close the session as the second most profitable for traders this month. However, the bullish action seems to be coming to an end.
The previous day’s price movement shows a long candle with a small body as the bulls failed to continue the surge. This indicates that these actors may be getting exhausted. The current-day price actions reaffirm this possible exhaustion. The asset dropped to $155 after retesting $160.
While the current red candle does not indicate the following price actions, many speculate that the asset may see further decline. Does the chart agree?
Solana Sees Growing Selling Pressure
Trading action over the last 24 hours suggests that the bears are stepping in as the buyers are exhausted. The small losses indicate growing selling pressure. This also signifies a gradual change in market sentiment as some traders move to take profit.
The relative strength index is declining due to selling pressure. A closer look at the chart shows that the decline started during the previous intraday session. The metric lost almost 2 points as the momentum indicator declined. The SOL uptrend is gradually losing its strength.
Adding to the woes, the recent surges sent prices high but higher than the set boundary. The Bollinger band saw prices constantly peak above the upper SMA. A close look at the chart shows the several wicks sticking out. Traditionally, such action would mean the end of the uptrend. However, the metric widened to accommodate the excess.
The difference between the previous breakout and the most recent is that prices’ uphill movement is slowing down, and the altcoin is not seeing as much volatility. As accumulation reduces, the accumulation and distribution chart also moves in a straight line.
Nonetheless, the average direction index is rising. Despite the slight decline, the moving average convergence divergence still prints buy signals.
Key Levels to Watch
Vital Support: $154 $150 $142
Vital Resistance: $160, $166, $175
The asset may see more decline as most indicators lean toward this. The bulls will look to hold prices above $154. This is the 23% Fibonacci retracement level, which signifies notable demand concentration around it. Previous price movement also suggests that prices may hover around this mark but may slip below it.
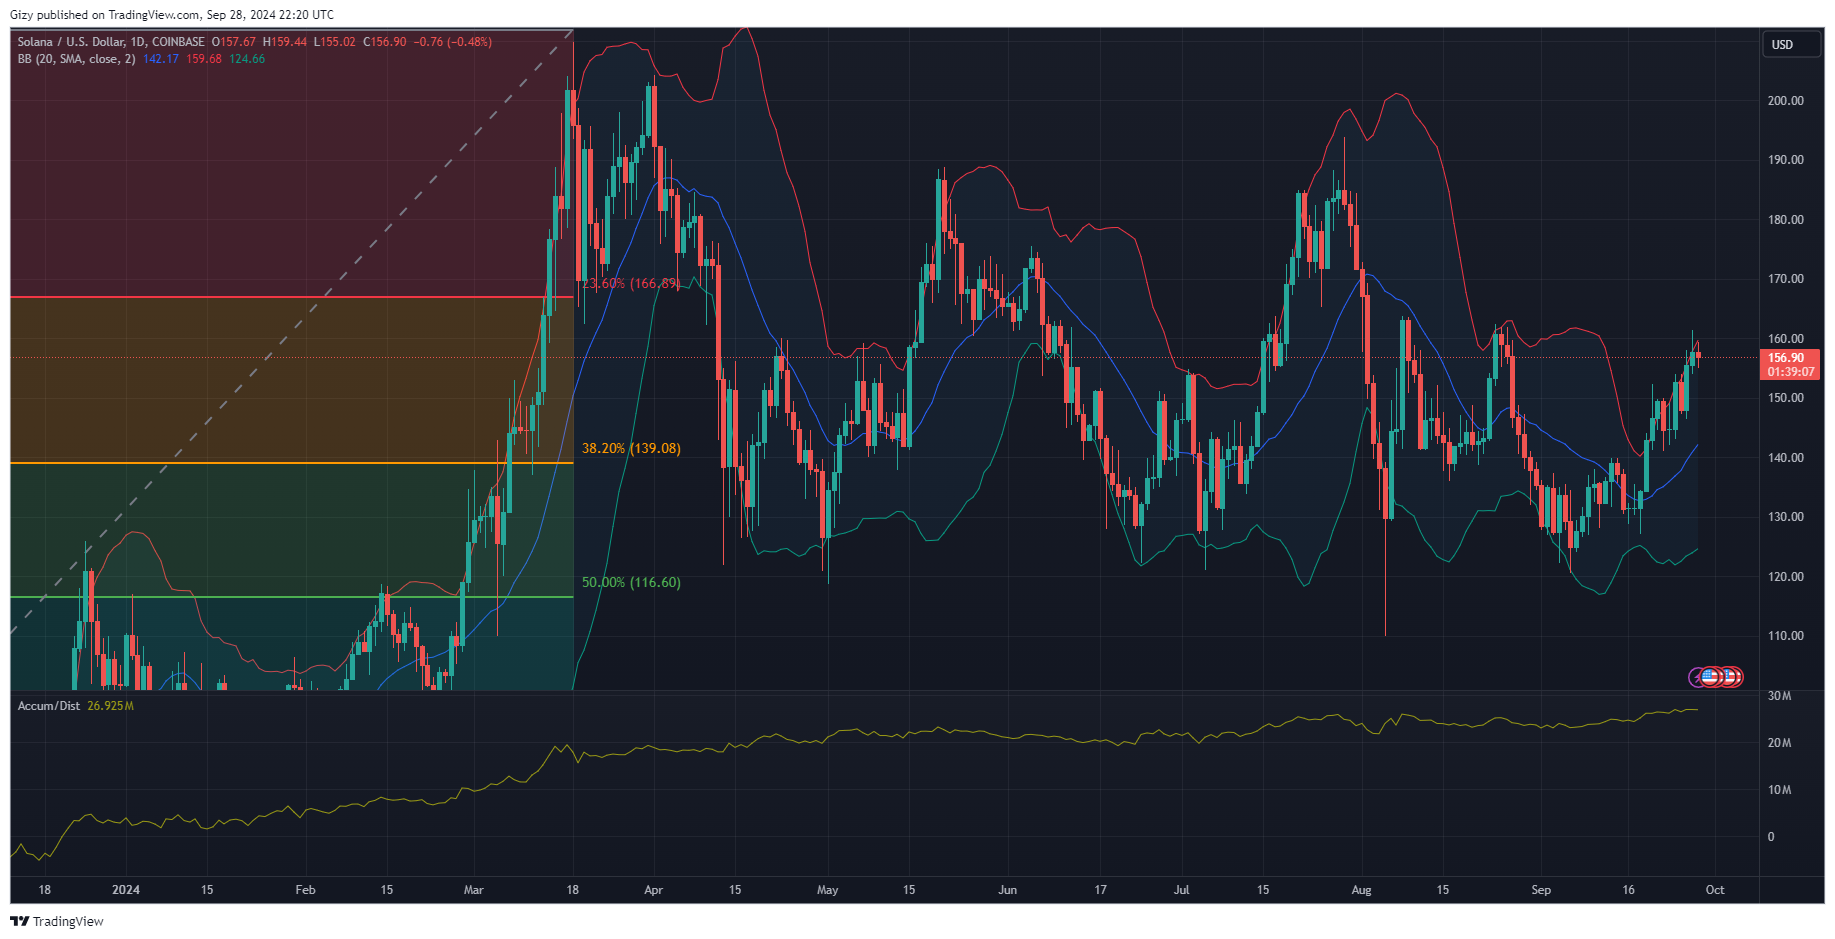
SOL may retest the $150 support following the slip. It is also not a formidable barrier based on previous price actions. Nonetheless, it’s close to the 38% level at $149, indicating a small demand concentration. Traders may bank on the $142 support as it held out against previous attempts.
Solana will seek to reclaim $160, and the bulls will strive to accumulate around $154 to build momentum. Historically, breaking the highlighted barrier may not guarantee an immediate attempt at $168. Nonetheless, it is a stepping stone to this bid. The altcoin must break $166.
Breaking $166 will open the coin to more uptrend. It will flip $170 and may surge above $175 if the asset sees an uptrend like the one in July.
