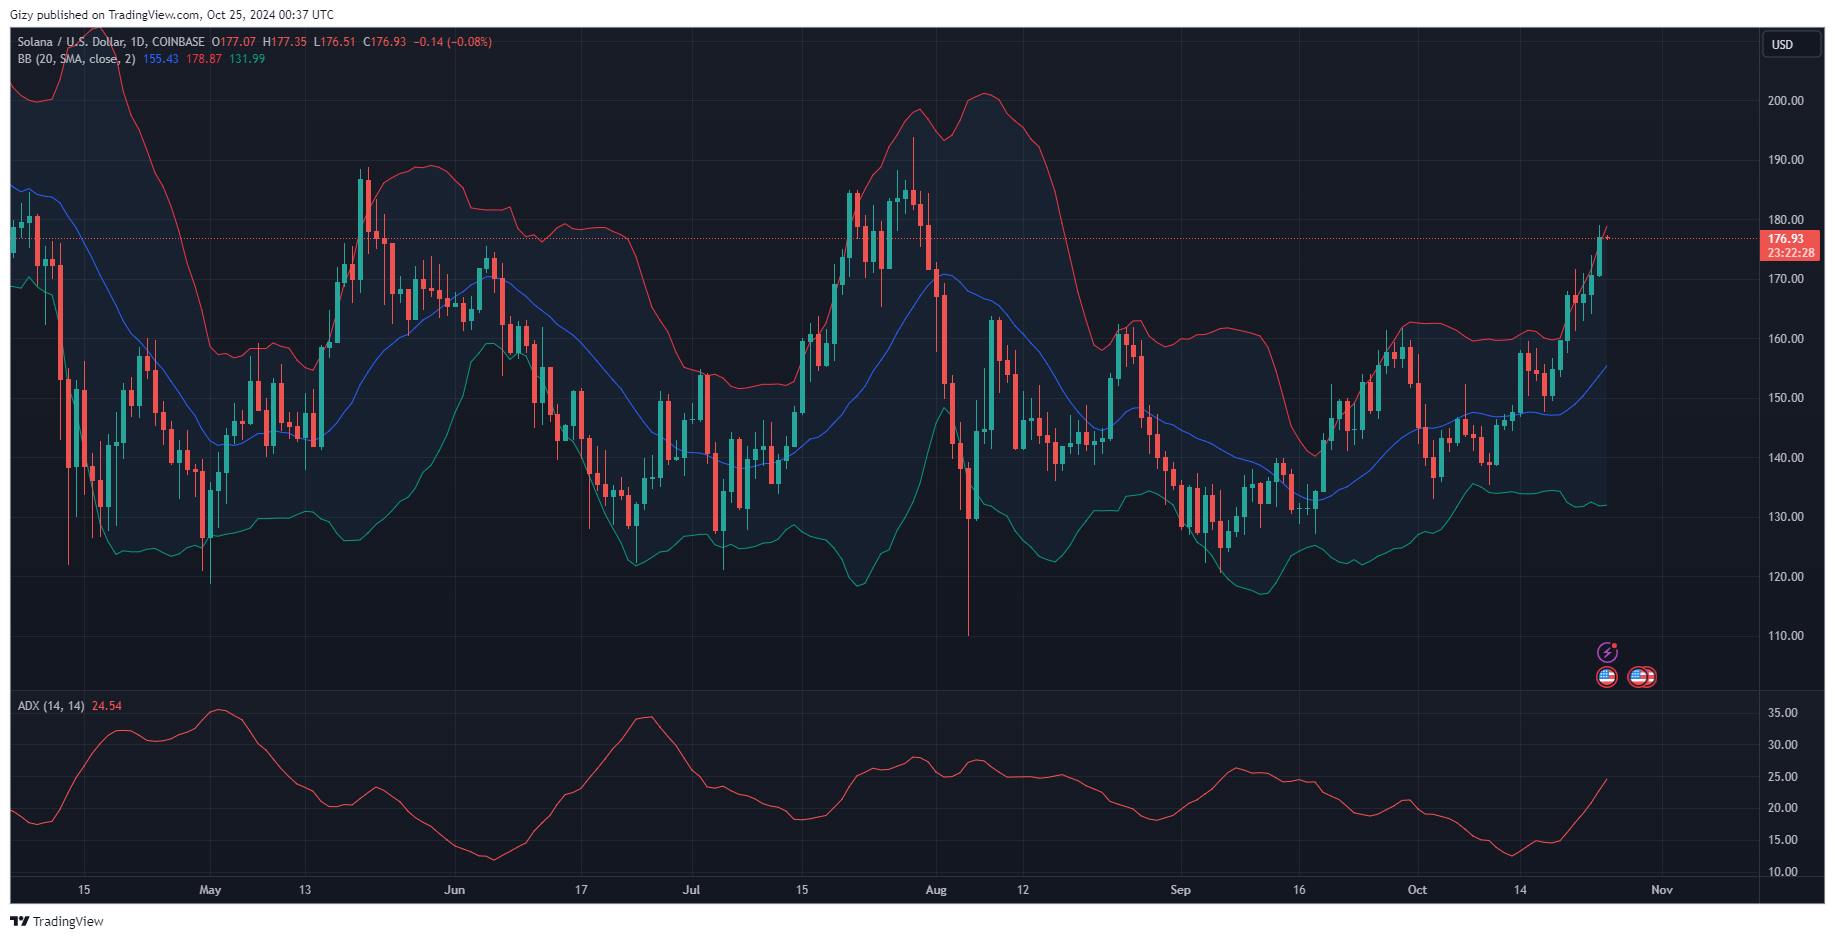
Solana opened on October 24 at $170 and surged as trading conditions improved. The massive buying pressure spike saw it peak at $178. It is currently up by almost 5% and looks to register its third consecutive day of consistent gains.
The ongoing uptrend, which started last week, defies the odds. The surges continue amidst several alerts of a possible decline from key indicators. Nonetheless, one of its most significant upticks happened on October 14, as it broke above $150 and hit a high of $158.
The uphill movement continued following slight price declines as the altcoin finally broke above $160, with eyes set on the $170 barrier. Solana broke this mark during the previous intraday session, opening trading at $167 and peaking at $174. It also closed above the highlighted mark for the first time since August.
SOL’s latest uptick comes barely 24 hours after most cryptocurrencies registered significant losses and onchain indicators hinted at further price declines. What changed?
Bullish Macroeconomics
Several vital data out of the US showed significant economic improvement and sparked small stock rallies. For example, the number of citizens applying for unemployment aid dropped by 15,000 last week.
The Labor Department’s recent release also indicates that the number of people receiving benefits after their initial week of aid increased by 28,000. All these metrics show that more companies are employing, adding to the conviction of a more robust job market.
Many analysts drew a parallel between the ongoing trend in the job market and what happened before the previous rate cut, hinting at a possible impending rate cut.
A Spike in Onchain Activity
Onchain data shows that another fuel for the ongoing surge is increased interactions between users and the ecosystem. One shows that the asset had a massive increase in the number of transactions deployed on the network earlier on Thursday.
The daily transactions on the blockchain also spiked by over 29% from October 8 to October 14. Additionally, more developers are interacting with the network, as the number of tokens launched has grown by over 200% since September.
Such a spike in new tokens and transactions shows a massive change in the investors’ sentiment toward Solana. The interaction is also profitable for the ecosystem as revenue increases. DefiLlama indicates an over 70% increase in revenue over the last 48 hours.
HODLers faith in the asset is growing as the total value locked (TVL) increased by over 33% this month, surging from $5.1 billion since the session started to $6.8 billion at the time of writing.
Will Solana Continue the Surge?
Macroeconomics and significant increases in network interaction significantly contribute to the ongoing uptrend. It remains to be seen if they’ll hold steady in the coming days. Nonetheless, indicators are blaring warnings.
The one-day chart shows several sell signals. One such signal is the relative strength index, which broke above 70 for the first time since July. A closer look at the charts suggests that such a climb is extremely bearish for the asset. For example, the altcoin retraced by over 40% following the previous breakout as it was overbought. It remains to be seen if the same may play out this time.

The Bollinger bands are also hinting at further price declines. SOL broke above the upper band on Sunday following its surge to $167. It has since continued breaking above it in the days leading to the current. Such breakout may signify the end of the uptrend.
Previous price movement shows that the last time such played out, the altcoin declined until it found support close to the lower band. The above shows the lower SMA around $140.
