Solana is up by over 5% over the last 24 hours. This will mark the second day of upticks following three days of consistent declines.
The asset traded in the opposite direction as the crypto market during the previous intraday session and closed with gains of over 6%. However, the altcoin dropped to a low of $128 a few hours ago but rebounded and is trading at $138.
Why is Solana Up?
Over the last 24 hours, the project has received considerable attention from several developers. One such developer is Jito Labs. The company specializes in Solana infrastructure and is building a restaking solution similar to Eigenlayer in Ethereum.
Following the announcement, the total-value-locked (TVL) increased from 9.92 million SOL on May 1 to 10.5 million SOL the next day across Jito’s smart contracts. The host ecosystem also saw a spillover of the bullish sentiment as its TVL increased by almost 3%.
With the surge in TVLs across the Solana ecosystem, demand for the asset also increased, which explains the increase in its price.
In addition to Jito’s news, Zeus Network is also working to develop a bridge between Solana and Bitcoin. The project will create a system to convert users’ Bitcoin into zBTC tokens, allowing traders to use the Solana ecosystem.
While many economists speculate about a further hike in interest rates, Jerome Powell announced that there will be no hikes this year. In reaction to this announcement, the crypto market is on an uptrend, and SOL is not left out.
SOL’s Uptrend Appears Unsustainable
Amidst the considerable price increases, there are indications that the current uptrend is a false positive.
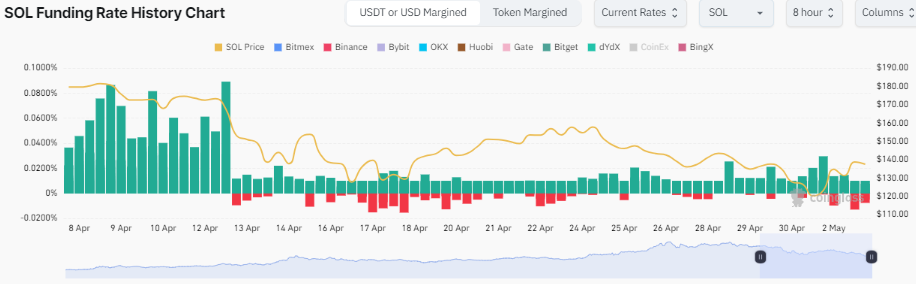
The chart above shows the asset’s funding rate on the 8-hour scale. The last two candles show the rates in the previous 16 hours. The first has a longer red part than green. This indicates that the coin saw more funds leave than enter. The next candle indicates an equal amount of inflow and outflow.
With the deficit from the other candle looming, more decline in inflow will result in more pressure on the present uptick, and the coin will trend downhill.
Additionally, SOL is printing a bearish candlestick. The current candle resembles a hammer. However, it has a wick sticking out of it. A close at $141 will fully define this stick. This could mean further price decline for the altcoin.
Nonetheless, the charts hint at further price increases as several indicators are flipping bullish.
What the Charts Say
One such is the moving average convergence divergence. Following the bearish divergence a few days ago, the 12-day EMA halted its downtrend due to the most recent change in trend. The metric is approaching the 26-day EMA in its ongoing bullish convergence. The bulls will look to continue the uptrend to cause a divergence.
The accumulation/distribution is also on the ascent in response to the most recent price increases. With its close alignment with price trends, the metric is silent regarding the following price actions. Nonetheless, the relative strength index is on the uptrend, indicating notable increases in bullish actions. This is amidst the over 10% drop in trading volume over the last 24 hours.
With the impending bullish divergence, the altcoin will try to hold on to the $120 support. If it fails, the bulls will defend the price around the 78% Fib at $110. The asset will attempt to regain stability above its pivot point at $150.
However, the current price suggests the bears are testing prices. Based on price movement, the sellers will stage minor selloffs at $142. To break this trend, the bulls will accumulate around $132.
In other news, altcoins are seeing massive increases. One such is AR. It is up by over 21% over the last 24 hours and may end the day as the top gainer.
