Solana surged to its highest value in the last six months, following several days of consecutive increases. It is seeing one of its biggest single-day surges as it edges closer to a new high.
Nonetheless, the altcoin failed to flip $240 on Thursday as it experienced rejections at $229. It is also worth noting that SOL crossed $220 for the first time in six months on Wednesday. It opened trading at $217 and then shot up after a slight decline, ending the session with gains exceeding 3%.
The coin is experiencing a slight retracement at the time of writing, following a break above another key level. It peaked at $241 but currently trades a little lower.
Solana has been one of the biggest movers in the top 10 as the bulls continue pushing for new highs. A bullish close on Friday will mark the asset’s seventh consecutive day of notable increase, sealing an almost 20% surge during this period.
Aside from spots, the derivatives market is seeing notable participation. A report from Glassnode noted that Solana continues to outperform as perp open interest climbed above $7 billion, and funding rate remains relatively stable.
The readings from the platform suggest that the coin was gearing up for a massive run. The current price trend suggests that open interest is surging.
Nonetheless, the bears are bleeding as they lose notable funds shorting the market. Recent data reveal that shorters lost $329 million in the last 24 hours. Additionally, the third-largest liquidation occurred on SOL, with short positions accounting for $42 million of the total $45.5 million in Rekt funds.
Solana Displays V-Chart Pattern
The 1-week chart indicates that the Solana Blockchain is having one of its most bullish sessions. It is up by over 16% over the last five days, surging from $205 to $241.
However, the chart suggests that this is only the beginning, as the altcoin printed a bullish chart pattern. A closer look at the image below reveals that the asset is retraced from the third week of January to the last week of March.
Nonetheless, it rebounded and surged afterward. The chart indicates that the altcoin is nearing recovery from its lost value and is approaching its previous level. It is worth noting that Solana surged to an all-time high of $295 before its retracement.
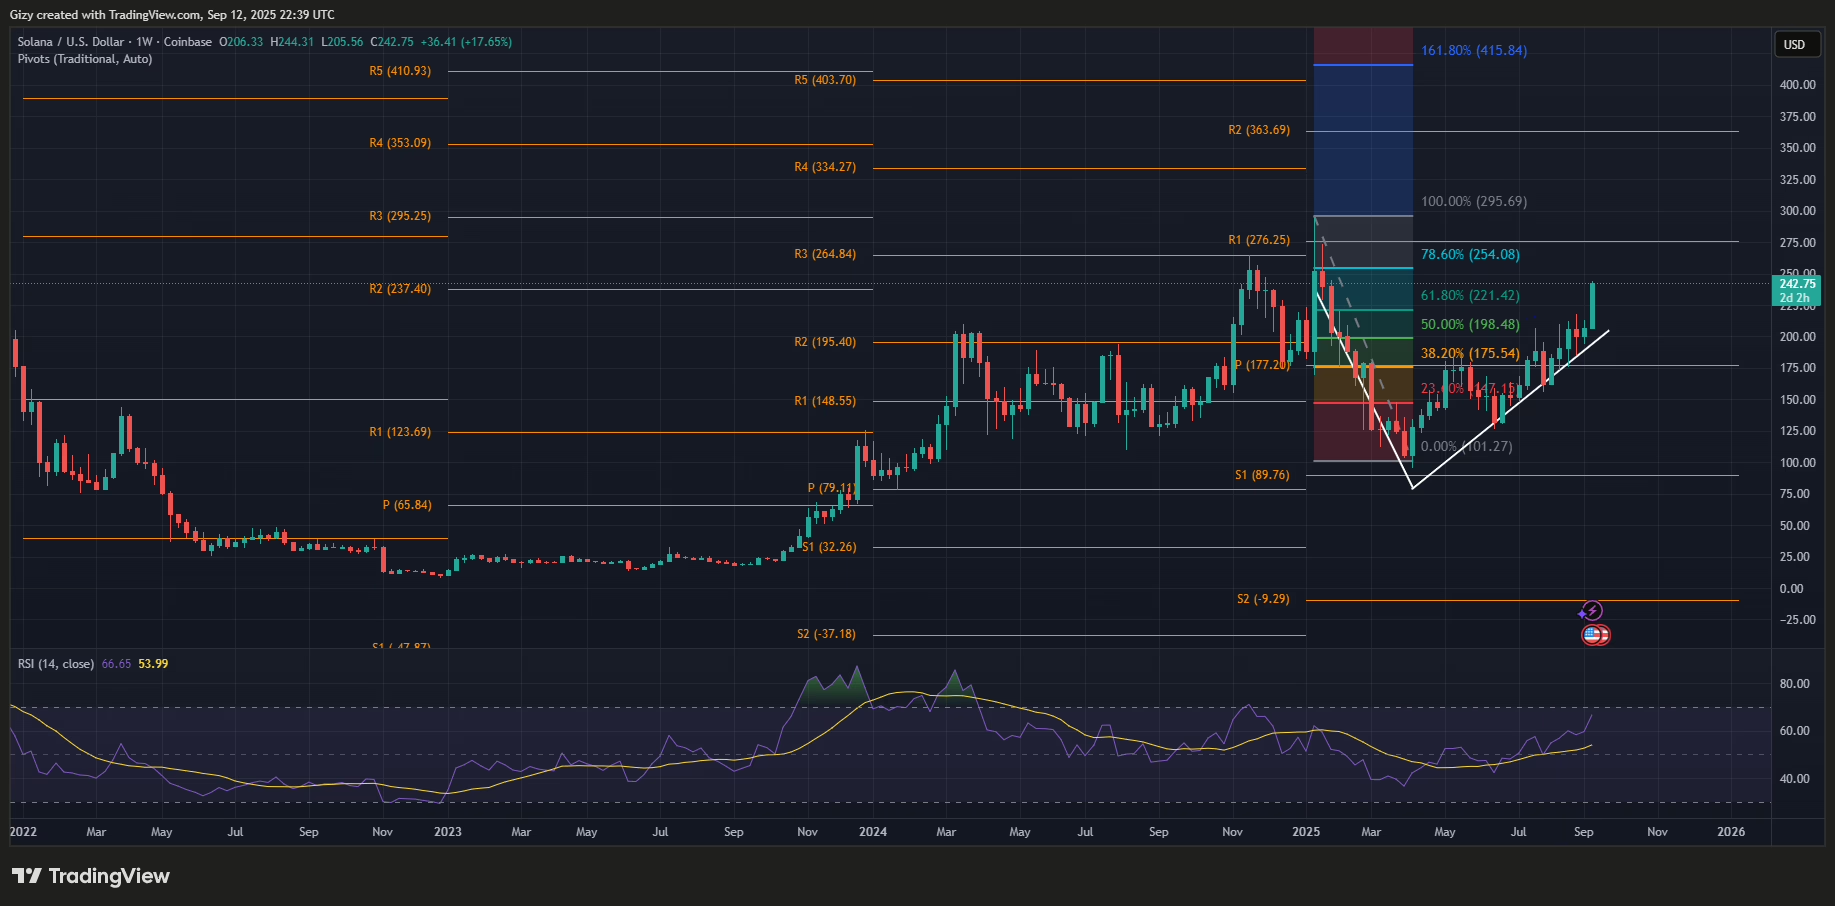
Away from the ATH, the cryptocurrency is printing a V-chart on the 1-week chart. This means that SOL will return to the price it started the pattern from.
However, there is a high likelihood that the altcoin will surge higher, flipping the previous milestone. Solana may continue to rise, potentially breaking above $300 in the coming week.
On the 1-week scale, the relative strength index stands at 66, indicating room for further increases. Continuing the uptrend will enable the asset to reach the previously outlined mark. Nonetheless, the pivot point standard shows that the asset is trading above PP and edging closer to the first pivot resistance at $276. The indicator suggests that flipping the mark will see the coin surge above $300.
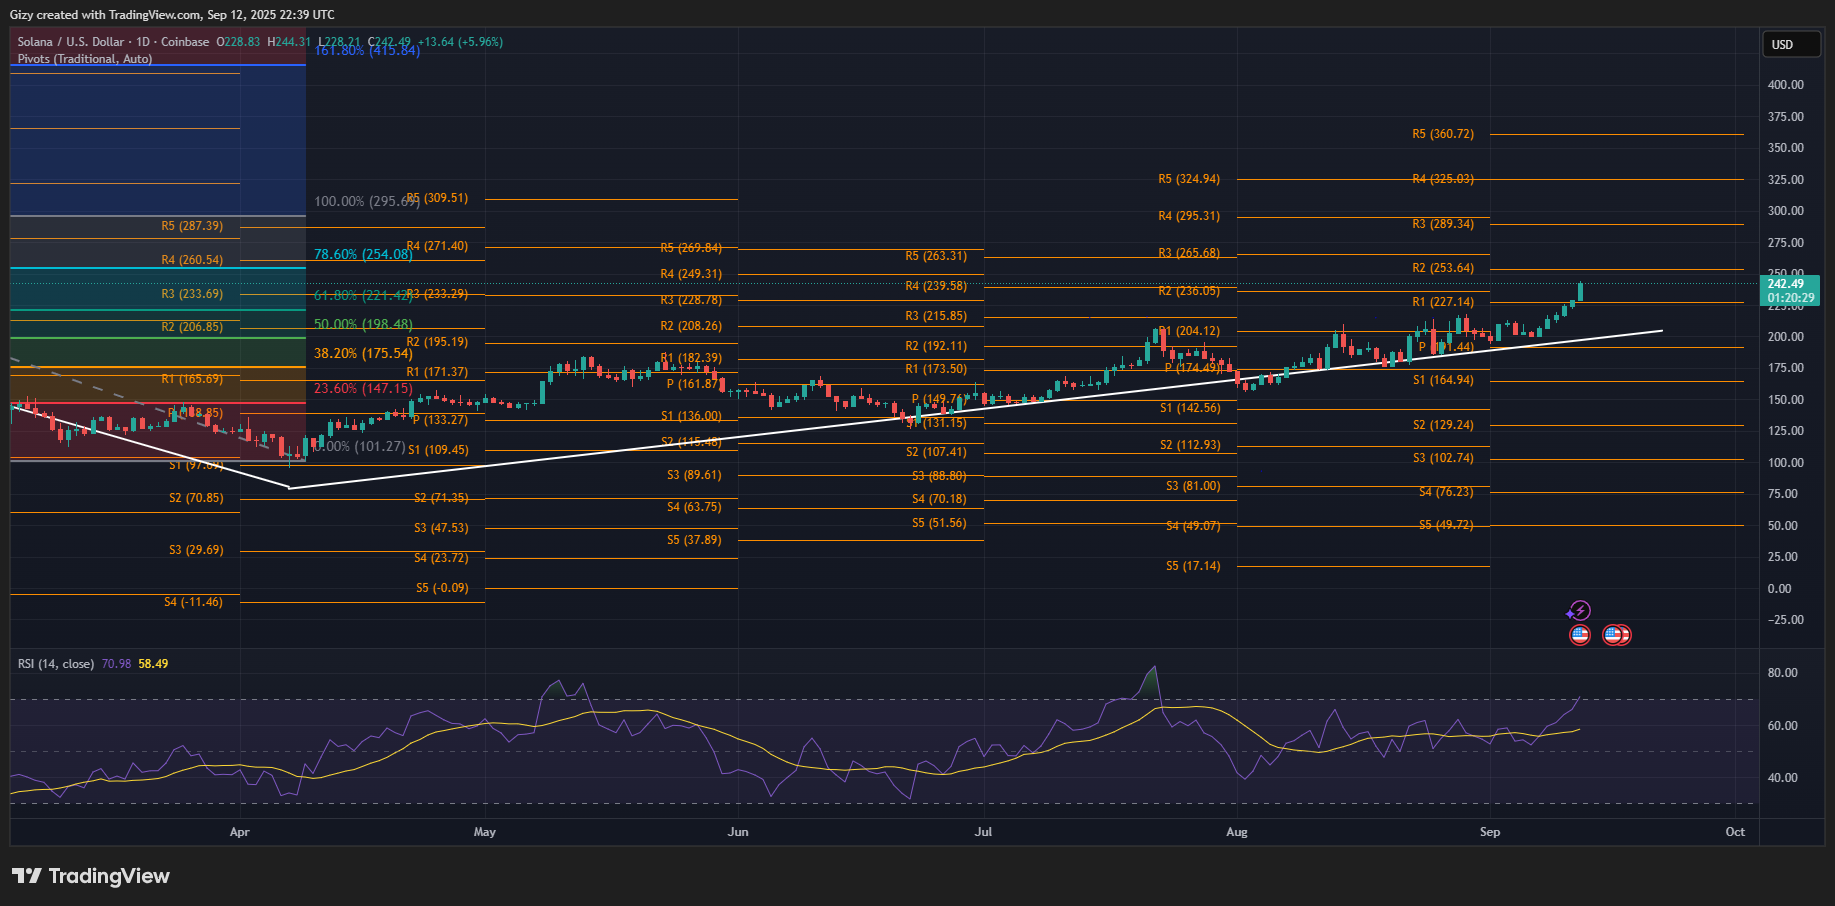
Indicators on the 1-day timeframe also support this prediction. The PPS reveals that Solana is trading above the first resistance and is approaching R2 at $253. Nonetheless, the metric indicates a high likelihood of flipping the highlighted mark after breaking above R3.


