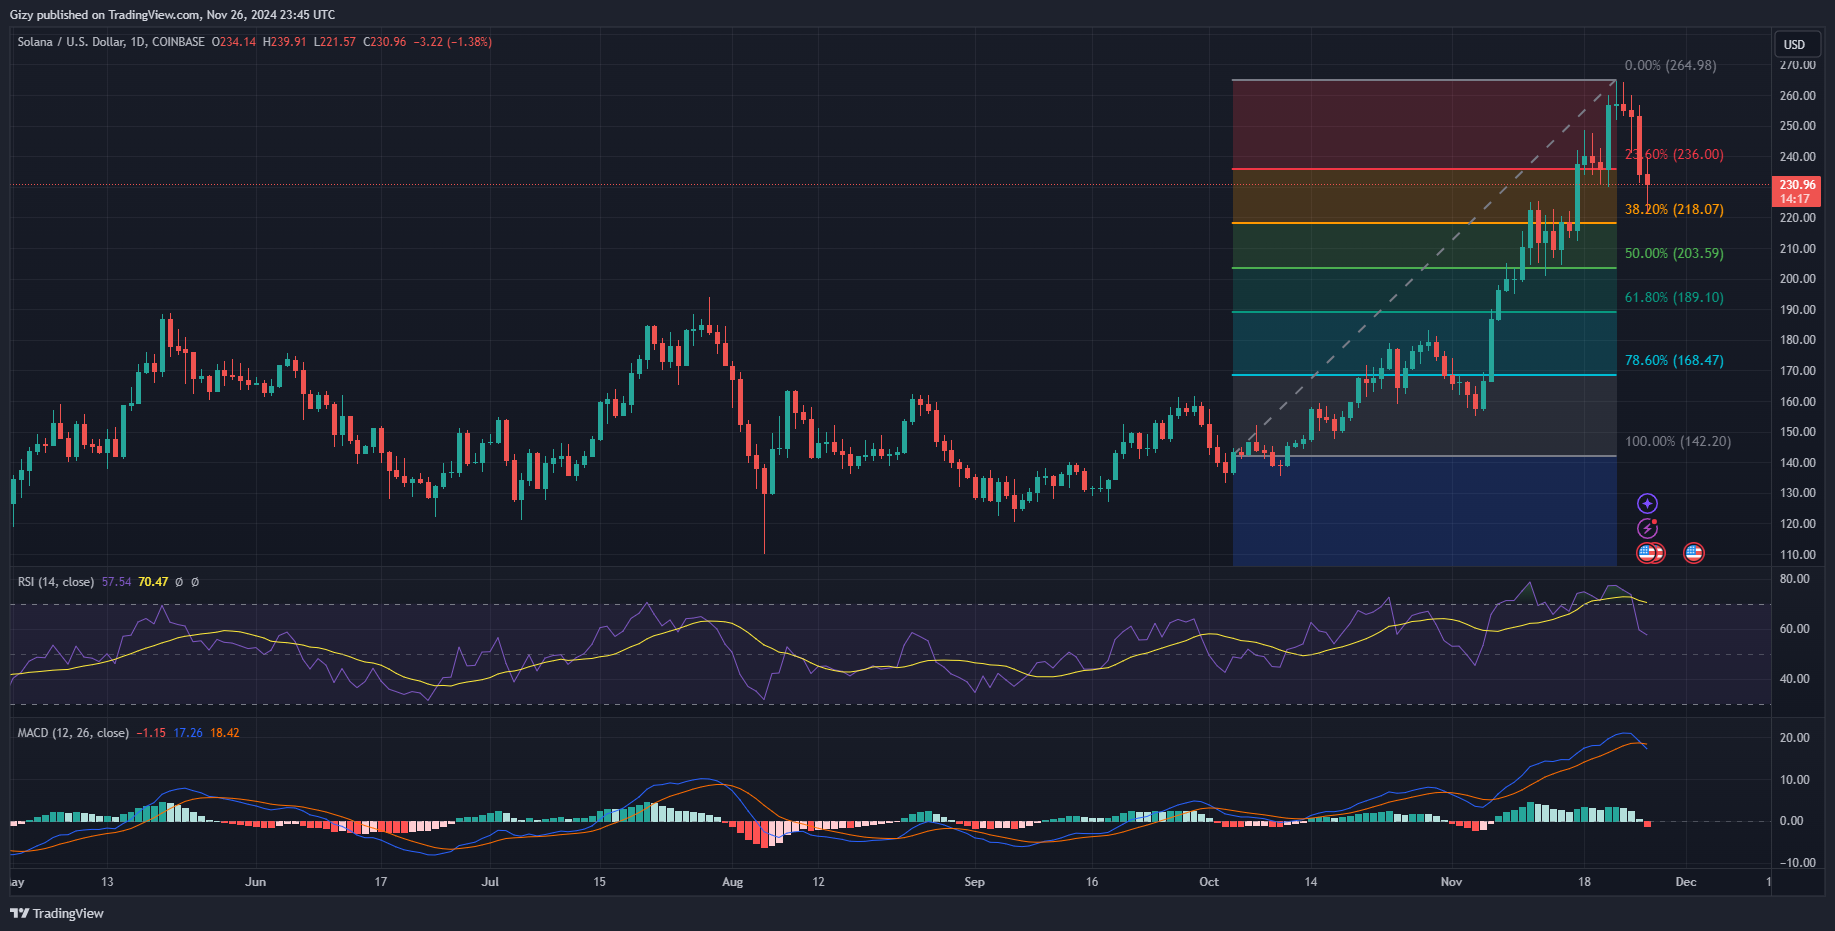
Solana has been in a downtrend for the last four days and shows little sign of ending it. However, it is worth noting that the asset showed similar signs at the start of the downhill movement.
It started on Friday after the asset climbed to a new all-time high. It opened trading at $256 and surged to a high of $264. After its milestone, it experienced massive declines, resulting in a close at its opening price. A repeat of this price movement happened the next day with the same result.
The downtrend picked up on Sunday as it dropped from $255 to a low of $241. Nonetheless, it recovered and close at its opening price.
The downhill movement worsened on Monday and SOL dropped from $256 to a low of $231. It closed with losses exceeding 7% amidst a small attempt at recovery. It sank lower a few hours ago, dropping to a low of $221. It is recovering and may close with a doji.
What Caused the Dip?
It is worth noting that the downtrend started after the altcoin surged to a new ATH. The bears stage selloffs at the peak, causing further attempts to fail. The dips met significant buybacks over the next two days. However, the trend worsened as the entire crypto market saw massive bearish sentiment. The fear and greed index dropped to 82.
The failed promise of another rate cut fuels the current-day decline. Other cryptocurrencies also suffered from the negative fundamentals.
Nonetheless, onchain data shows a gradual decline in DEX’s trading volume since the ATH. Total trading volume on these platforms was $17 billion as of Nov. 22. It dropped by almost 20% the next day, closing at $15 billion. A smaller decline happened the next day. The gradual decline in activities within its ecosystem affects its prices.
One reason for the drop in trading volume on these decentralized exchanges is due to less action on pump.fun. The launchpad recently blocked the live stream feature after several cases of misuse, resulting in a notable drop in deployed tokens and revenue.
There are no indications of the downtrend halting in the next 24 hours, and there are no upcoming fundamentals to change the market’s trajectory. The one-day chart hints at further declines.
Solana had a Bearish Divergence
The moving average convergence displays sell signals at the time of writing. Following days of consistent declines, the 12-day EMA intercepted the 26-day EMA in a bearish divergence. MACD’s latest reading indicates further declines.

The momentum indicator is declining as selling pressure increases. Due to previous readings, the average directional index is in a downtrend. Accumulation has significantly reduced over the last 48 hours, as seen on the A/D chart.
