At the time of writing, Solana is causing considerable uncertainty. Many fear a further price decline following the most recent price action.
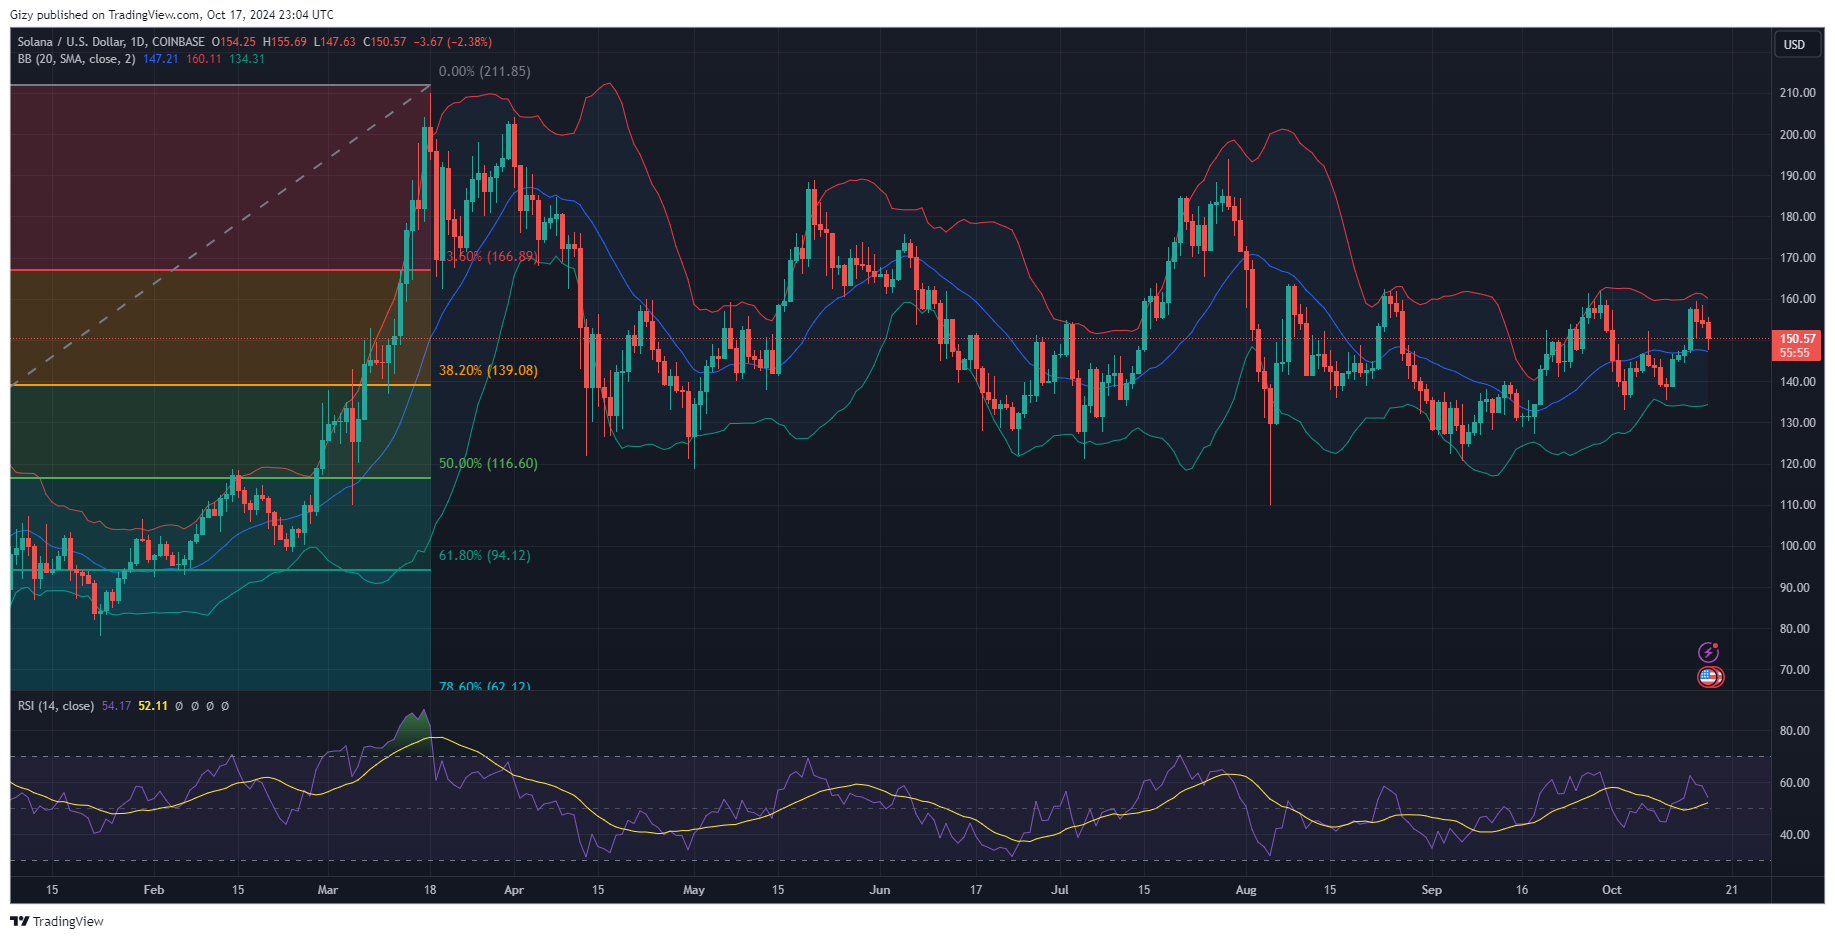
The asset opened the day at $154 and attempted a further price surge with limited success. However, the seller staged several selling congestions, resulting in further price declines. The altcoin dropped to a low of $147 before rebounding.
Currently trading at $150, it is still at risk of further downtrends. Why is it down?
A Decrease in Traders’ Interest
Solana’s most recent price decline is due to the massive decrease in onchain activity. Fewer users are interacting with the network, resulting in reduced demand and less buying pressure.
The reduced interaction also reflects on several memecoins as they tanked. The total market cap of Solana’s memecoins dropped by over $10.5 billion in the last 24 hours.
Cryptocurrencies like BUB lost over 23% during this period. SLND dropped by over 18%, with BONK and GME losing over 8%. Large-cap assets like RENDER and LINK lost over 2% each.
The low interaction also reduced trading volume and revenue to traders and other parties.
Data from Coinmarketcap shows that SOL’s trading volume dropped by over 12%, representing over $200 million. Defilama also shows that volume on Solana dropped from $2 on October 14 to $1.7 billion.
More data from DappRadar indicates that DApp volume on the blockchain dropped by over 53% in the last seven days. The Unique Active Wallets (UAW), which shows the number of users that interacted with smart contracts, revealed over 53% drop in such actions in the last week.
The question of when the downtrend will end is gradually gaining reactions. However, the chart suggests that an end may not be close.
Ongoing Bearish Convergence
The moving average convergence divergence showed that the asset had a bullish divergence a few days ago. However, the indicators indicate a change in this crossing barely three days after the positive.
The 12-day EMA halted its uptrend in reaction to the most recent price action. A closer look shows it’s arched downwards and starts a bearish convergence, as it may intercept the 26-day EMA in the coming days if trading conditions do not improve.
SOL’s recent downtrend may see the coin drop below a critical level. The Bollinger bands show the asset making a move that may send it to $130. It is trading close to the middle band and threatens to drop below it.
Solana almost hit the lower SMA the last time the altcoin dropped below this band. For example, it dipped below it on the first day of the month. A few dollars from the lower band, it halted its downtrend. The cryptocurrency may see the same price action play out in the coming days.
Volume indicators like the relative strength index show massive selling congestion. The bears started the selloffs two days ago,. as the asset edged closer to $160. RSI hit 62 as buying pressure peaked. However, it is at 53 at the writing.
The accumulation and distribution chart is also bearish as the sellers continue dumping their assets, resulting in greater distribution than accumulation. Momentum is also declining due to the bulls’ inability to cause a surge. The same trend is present in the average direction index as the metric declines.
Although the pivot point standard suggests that the cryptocurrency is bullish, its recent dip may change this status. At $150, SOL is trading above its pivot point. However, if trading conditions remain the same, it may retest the PP at $145. Failure to keep prices above this critical level may result in further downtrends, with eyes set on the next pivot level at $128.
