Solana is showing a lot of volatility amidst the stability across the crypto market. It continues its attempts above $150 with limited success.
SOL continued to bounce off $140 and faced strong resistance around the highlighted barrier over the last four days. Due to this trend, it has failed to register any significant price changes.
Fundamentals failed to make any difference as they were positive but had nothing to do with price. Most of them were about the ecosystem. For example, the largest news on the asset in the last seven days is the patch of a critical vulnerability.
The defect was one the Solana devs saw and did not disclose until they were almost done with the patch. The ecosystem could lose huge funds and downtime if malicious actors exploited it.
Aside from this news, the ecosystem is seeing new integrations that may ease transactions. Solayer, a Solana restaking protocol, has officially launched its mainnet. This announcement follows just a week after the project secured support from Binance Labs
It remains to be seen if the announcement will result in more uptrends in the coming days. Nonetheless, the SOL is trading flat.
The on-chain does not provide much detail about what is happening to the asset. The chart suggests that the current price trend may continue for a while.
Huge Price Uncertainty Plague
Indicators are fairly silent about the next price action. For example, the moving average convergence divergence is not printing clear signals. The 12-day EMA has since trended almost parallel since the previous price burst.
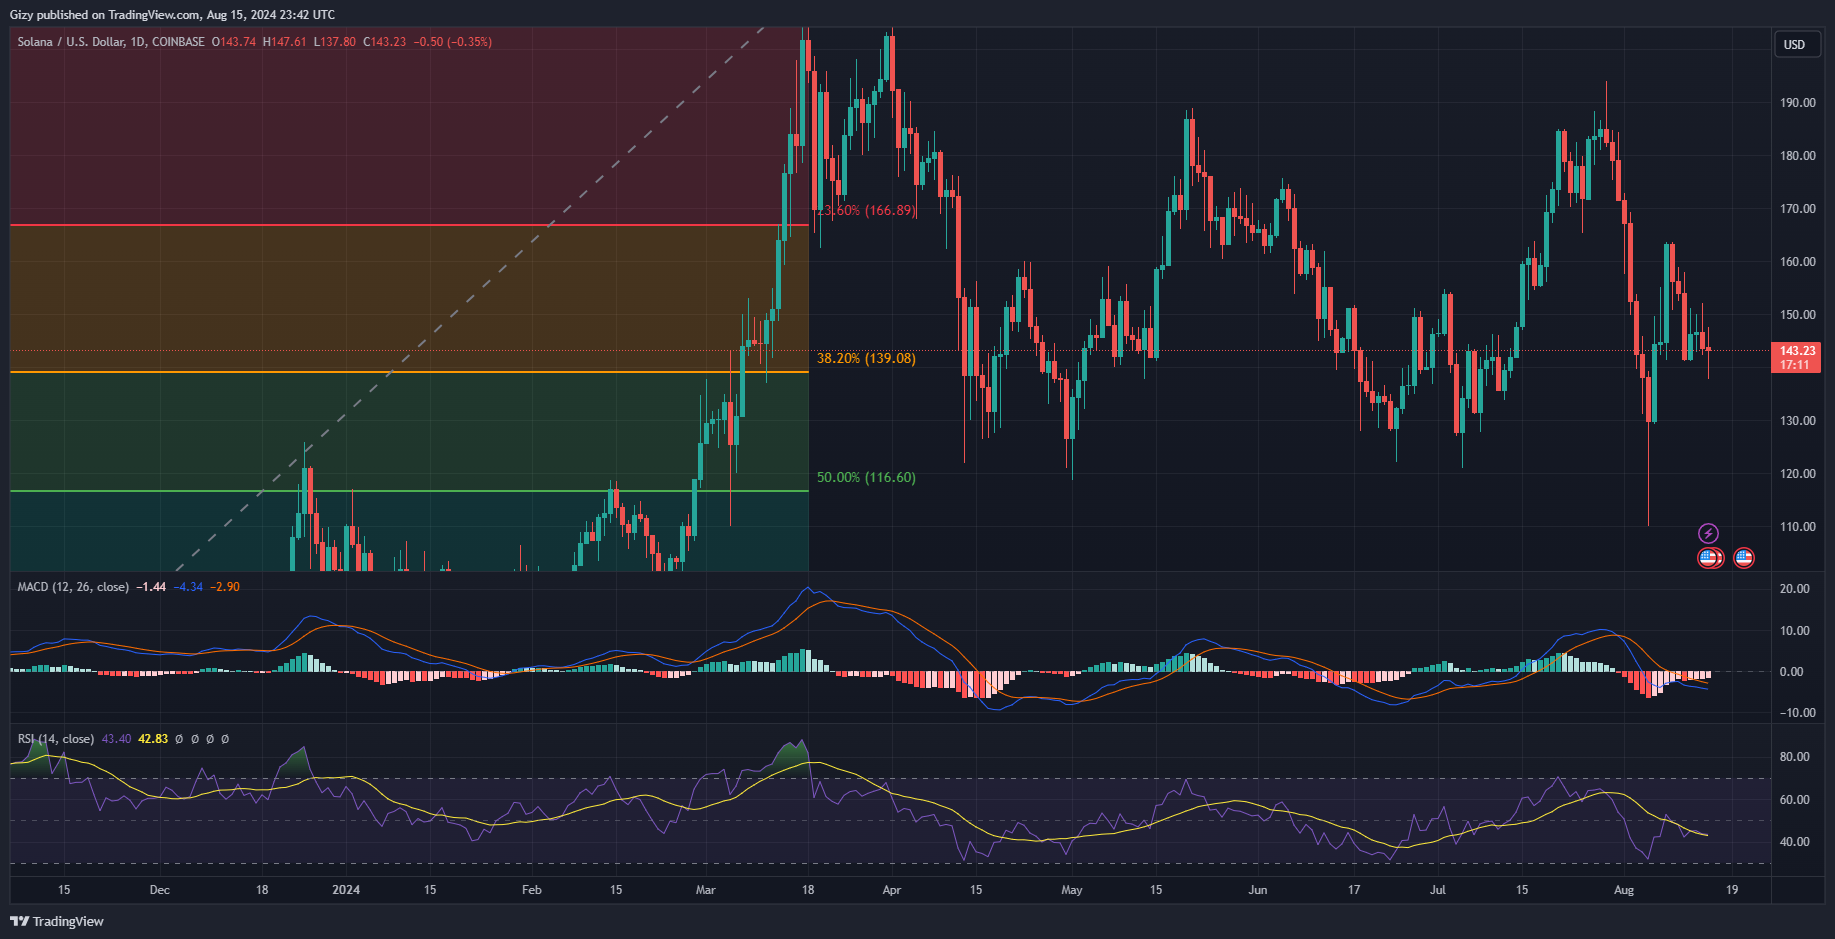
The 26-day EMA was on a downtrend but halted and is seeing the same trajectory as its counterpart. With both metrics moving straight, it is hard to conclude where prices will go as they are not bullish or bearish.
The relative strength index points to reduced trading activity as the reason for the most recent trend. It moved between 41 and 45 in the last five days as neither the bulls nor the bears failed to seize control of the asset. Nonetheless, the most recent trajectory points to the bears edging, resulting in a small decline.
It failed to break its 100-day exponential moving average during the previous intraday session. However, it retraced after peaking at $152. Still trading below the metric, it broke below the 200-day EMA but reclaimed it a few hours ago.
The pivot point standard is negative as the altcoin is gradually closing in on the first pivot support. With each passing decline, it creates more space from its pivot point.
Solana is at Risk of Hitting $130
Indicators are leaning on negative sentiment, which may indicate further price drops. The Accumulation and distribution chart points to no impending uptrends.
Nonetheless, the $140 support lost its strength due to the most recent flip. Although it is trading above the mark, the bulls failed to continue the surge. A close around this mark may guarantee another slip below it.
Such slip will put the altcoin at further risk. With the S1 at $130, this may be the next critical point to defend.
On the other hand, the general market sentiment may improve, affecting Solana. It could boost it to retest $150.
