Solana is on the verge of another breakout. It edged closer to the $220 barrier after staying below it for the past fourteen days.
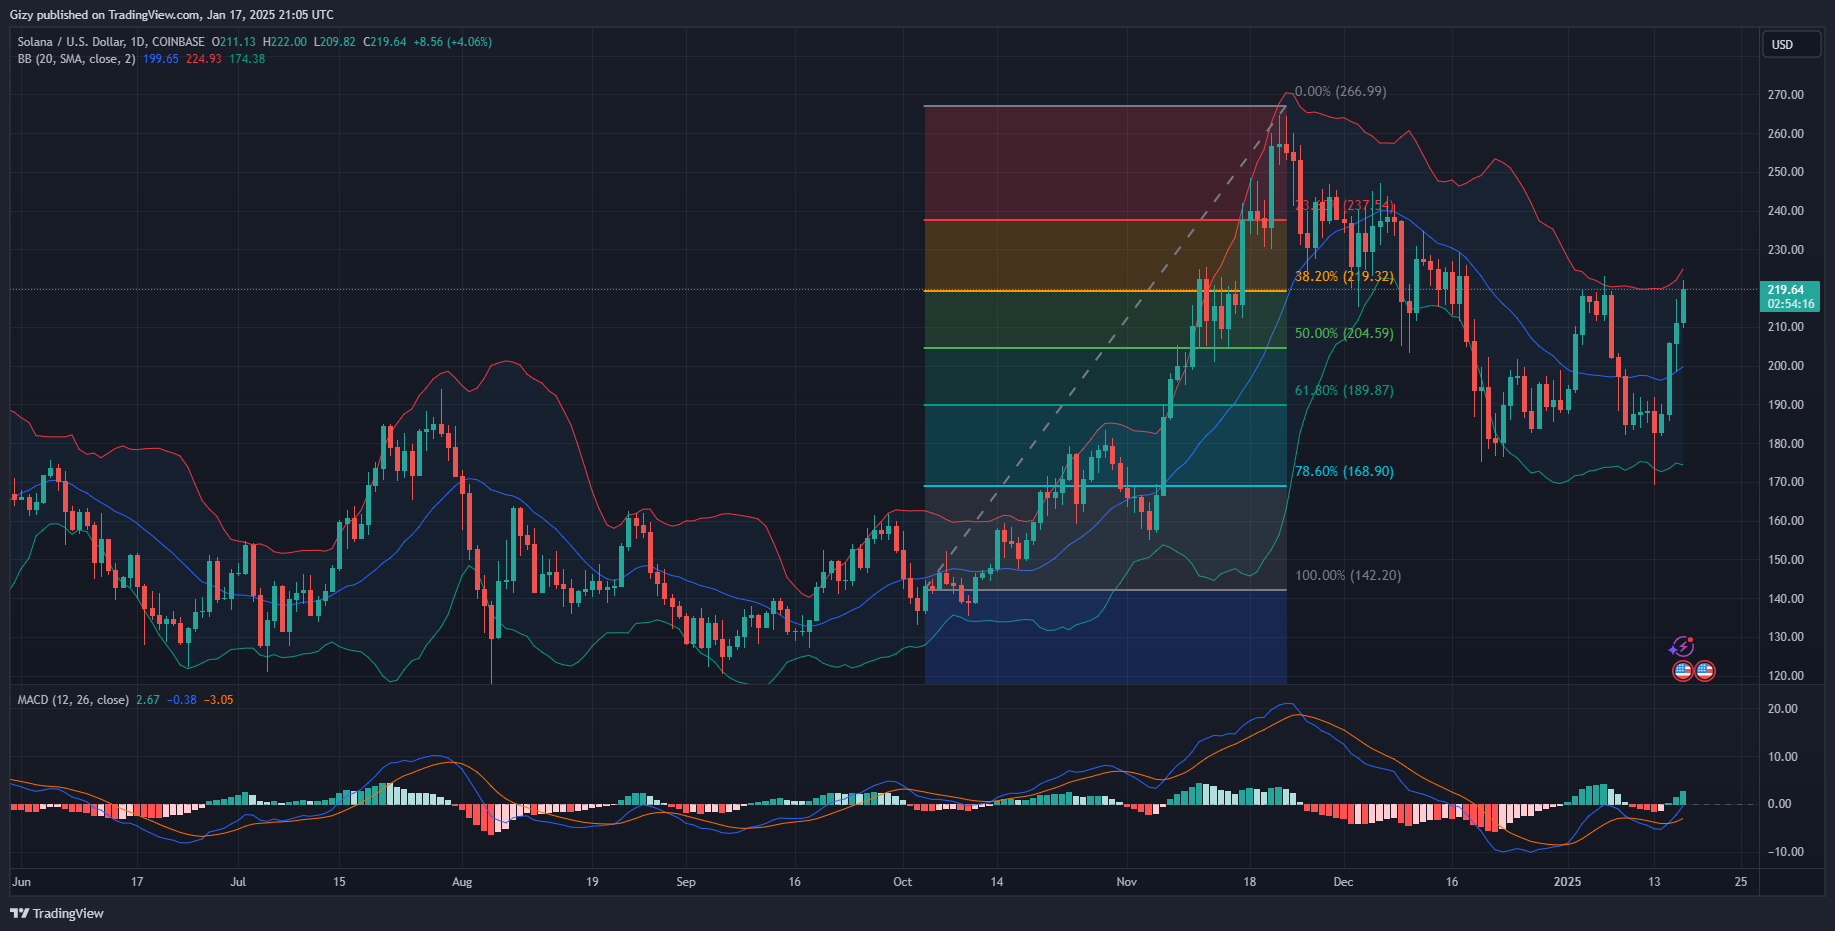
The Bollinger band shows the asset approaching a critical level, the upper band. Nonetheless, it is worth noting that the asset recently broke out from a previous trend. Its surge may hold answers to questions of whether SOL will continue upward.
Solana closed below $190 on Tuesday. The trend, which started last Friday, saw the asset attempt the mark but face strong rejection after a brief flip.
The cryptocurrency had one of its most significant declines following a failed trial at the highlight mark. It opened Monday at $186 and peaked at $191 before a dip below $180. It continued downward, breaking the $170 barrier before rebounding at $169.
The altcoin met buyback after the low, resulting in its return to $182. SOL is still on the rise following its recovery during the previous days. It attempted the $190 resistance but experienced significant corrections afterward.
However, the asset broke out the next day. The uptick happened a few days after solana’s slip below bollinger’s lower band.
The cryptocurrency trades close to the upper band, and investors fear a reversal. Nonetheless, it is worth noting that increased network activity is one reason for the ongoing uptrend.
Confidence in the asset’s long-term prospects has reached a new high. The total locked value (TVL) has gradually increased over the last five days, increasing from 45.6 million SOL on Jan. 12 to 46.2 million SOL at the time of writing.
Although trading in the Solana ecosystem fluctuated over the past seven days, it registered notable increases over the last 24 hours.
Charts Point to $220 as Key.
The Fibonacci retracement level reveals that SOL is trading around a critical level. Currently exchanging at $219 at the time of writing, the asset is above the 38% fib level.

Previous price movements suggest that the altcoin may see a massive surge after decisively breaking the $220 barrier. Flipping this key level may guarantee a return to $240, as the 23% fib level lies around this mark.
The Bollinger Band supports claims that the altcoin may break out from its ongoing trend. Solana quickly broke above the upper band during its previous run in November. Price action suggests the same may happen as market sentiment remains relatively positive.
Other metrics, like the moving average convergence divergence, print positive signals. The indicator displayed a positive interception on Wednesday following its significant uptick. Its histogram bar increases in size the bullish trend it ongoing.
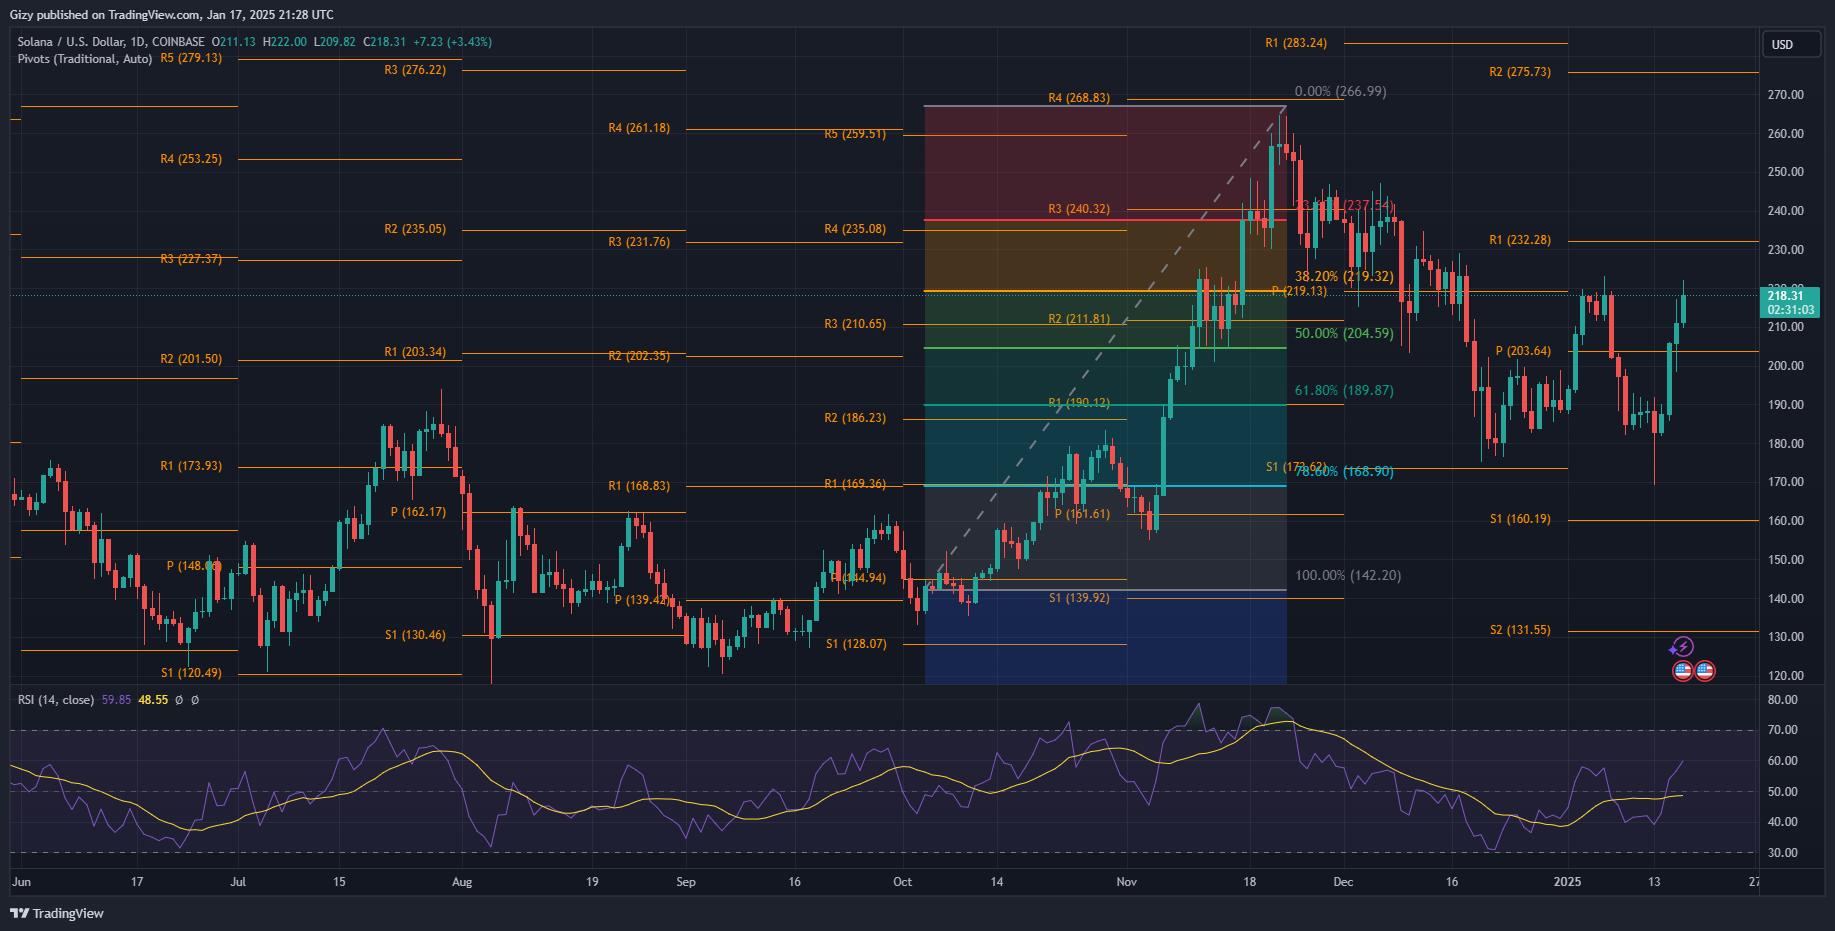
The relative strength index is at 60 at the time of writing. It shows room for more uptrend as RSI remains normal.
How High Will Solana Go?
Previous price movements show that the altcoin trades around a prominent resistance. The bulls failed to push prices past the $220 barrier earlier in January. The dip on Jan. 7 was due to notable selling pressure around this mark.

SOL experiences a similar trend. However, based on the outlined indicators, the asset will flip the level. After breaking the highlighted price level, it may surge above $230. The Fibonacci retracement level points to $240 as the next level to watch.
Previous price trends suggest notable selling congestion around the mark. However, investors’s goal remains to attain a fresh high. Solana will surge above $260.
