Solana is on the move again. This time, it reclaimed a critical mark for the first time since April. The market is amplifying cries of the bull market following Donald Trump’s victory.
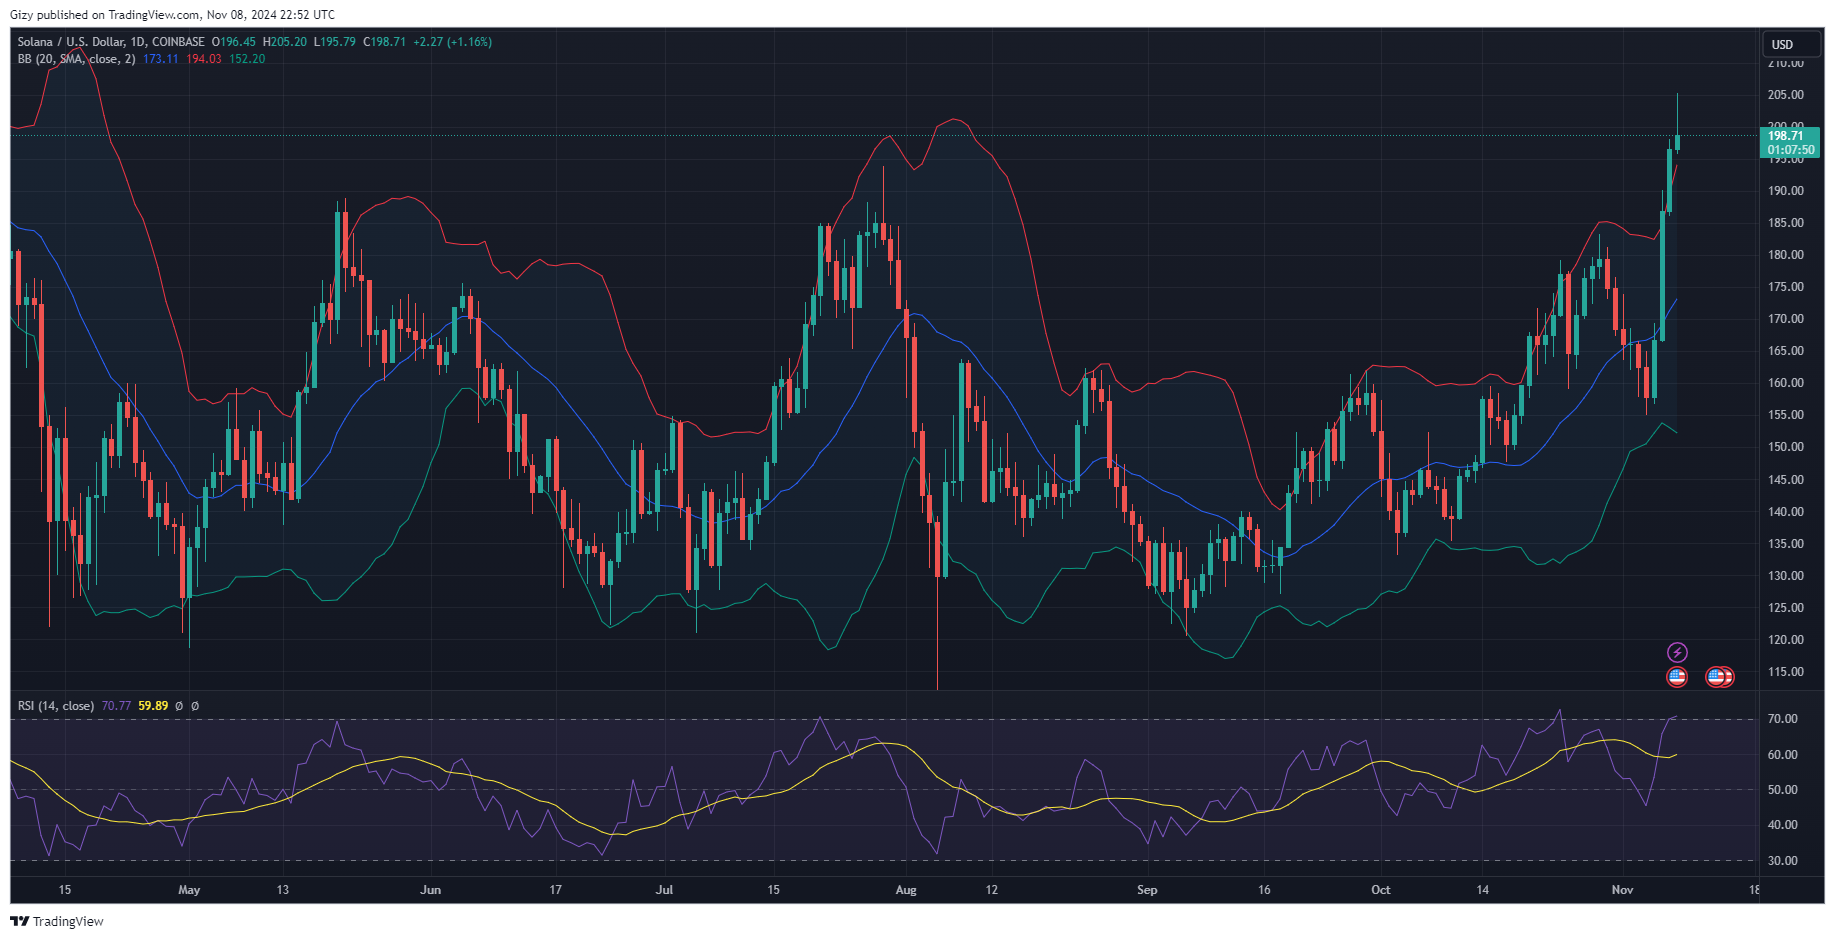
The altcoin started the day at $196 and surged as massive buying pressure poured in. It slowly climbed, breaking above $200 and hitting a high of $205. It is exchanging at $198 as it faced massive rejections at the peak. Nonetheless, there is notable demand concentration around this mark.
The bulls undoubtedly saw the flip coming as the SOL/USD pair saw consistent price surges over the last three days. It started with a 5% increase on Tuesday and continued the uptrend the next day. Wednesday was the biggest as it opened trading at $166 and retested the $190 barrier but failed to break it. It closed with gains exceeding 12%.
SOL registered another 5% surge during the previous intraday session, edging closer to the $200 mark but closing at $198.
The altcoin sees massive declines after its latest spell at $205. The one-day chart shows no such retracement has happened since the uptrends started. It is back to its opening price.
Will Solana Dip?
Ongoing price trends suggest a possible change in trajectory. Nonetheless, onchain data shows massive ongoing profit-taking. The coin is seeing a considerable decline in the number of addresses holding less than one SOL. It dropped from 863k on Nov. 6 to 535k during the previous intraday session.
The trend is present with wallets holding between 1 and 10 SOL. They dropped from 102k on Wednesday to 65k during the previous session. Other scales saw a similar decline as traders dumped their assets for cash or other assets.
Solana is seeing a massive drop in network activity. Data from THE BLOCK shows a drop in weekly transaction fees, from 120k to 76k this week. Although the week has not ended, the altcoin will see less activity over the weekend.
All important onchain metrics point to a possible decline, and the one-day chart suggests a potential change in price trajectory.
SOL is Overbought
The main driver behind the ongoing surge is massive bullish buying volume. The relative strength index has been rising. It was at 45 on Monday and surged to 69 during the previous intraday session. The rise continued, and it broke above 70 a few hours ago. The asset is currently overbought and due for corrections.

The Bollinger band sheds light on another reason to expect more decline. SOL broke above the upper SMA on Tuesday after closing the day at $190. The trend continued the next day and is ongoing at the time of writing. Previous price movements suggest that the coin sees notable price declines following such events and is playing out now.
Nonetheless, other indicators hint at a short downtrend. Solana surged above its first pivot resistance during the previous intraday session. Its latest surge saw it edge closer to the second pivot resistance at $211. Although it faced a massive setback in this bid, the bulls may defend the R1 in the event of a decline.
The average directional index is rising as the uptrend gains more momentum. It has yet to respond to ongoing corrections that may agree with the previous assertion.
The Fibonacci retracement level suggests notable demand concentration at the 23% mark, around $190. It also points to a possible buyback at the 38% mark in the event that it loses the $190 barrier.
Nonetheless, Solana saw over a 20% increase in trading volume over the last 24 hours. Traders are also thrilled to see the asset edge closer to its all-time high.
