BTC had a volatile start to the week, surging to a high but retracing afterward. However, it appears that the bears are in control again, and there is growing uncertainty across the market about the next price action.
Nonetheless, BTC is experiencing sufficient trading volume to end Wednesday with notable price changes. The amount of buying and selling is more than 8% higher in the last 24 hours. Volume data indicate that the asset is experiencing a buildup similar to that observed last week before the increases. However, the price reflects massive selling.
The increasing number of buying and selling is spilling over into other assets, as the crypto market saw a 5% rise in this metric in the last 24 hours. However, the market’s value declined by almost 2% during this period.
The global cryptocurrency market is down by almost 2% following the bearish statements from the Federal Reserve Chairman. Investors expressed their surprise by selling off some of their assets.
All eyes remain fixed on Thursday’s meeting between the leaders of the US and China to end the trade war. A productive meeting may lead to a recovery in the crypto market. Nonetheless, let’s see how some assets in the top 10 will react.
BTC/USD
BTC is trading above $110k at the time of writing, after edging closer to $109k. Its latest rebound suggests an attempt to spark a rally after its earlier descent from $112,500. Nonetheless, the apex coin broke above the $116k resistance again on Tuesday, but ended the session with slight losses.
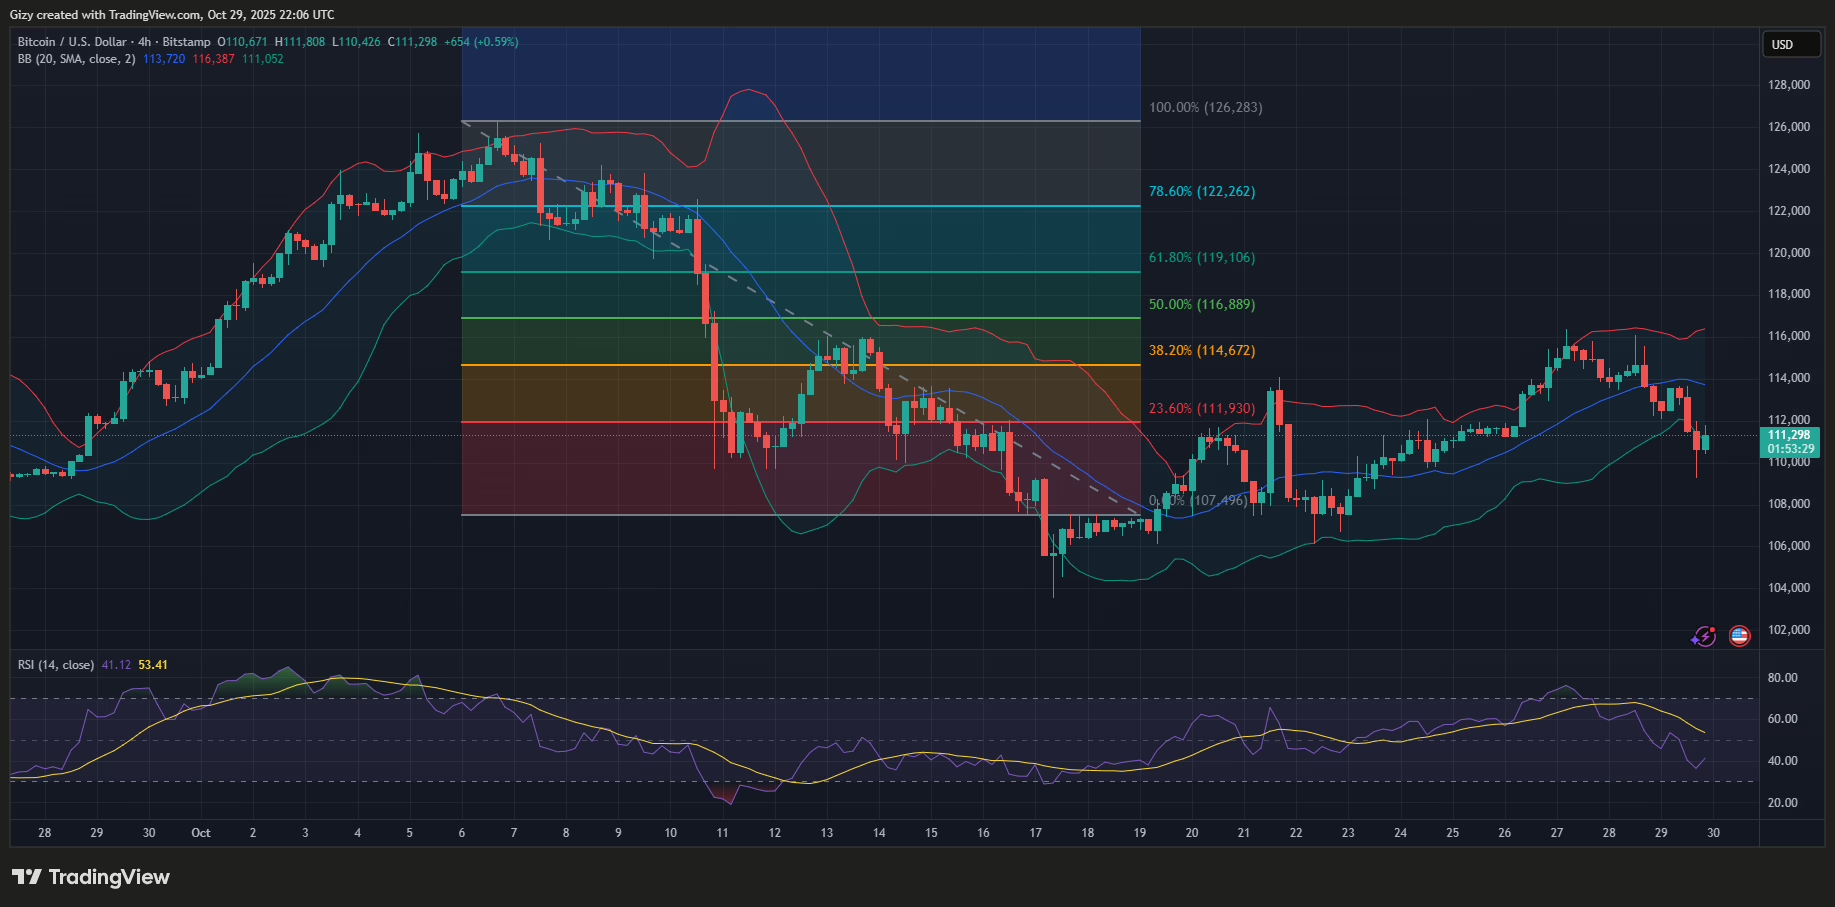
However, the 4-hour chart suggests further declines may occur in the coming hours. The moving average convergence divergence displayed a bearish crossover on Tuesday as selling increased. Trading conditions have since worsened, and the indicator remains bearish. In the event of further decline, BTC may slip as low as $106k before rebounding.
Conversely, the apex coin has traded close to bollinger’s lower band for an extended period now. It may hint at a rebound ahead. If this happens, the asset may resume its uptrend and reclaim the $114k level.
However, previous price movements suggest that BTC may hover around $111,300 before breaking out.
ETH/USD
Ethereum ended its four-day uptrend on Monday, when it surged to a high of $4,254 before retracing. It briefly slipped below $4,100 before recovery. However, the asset sank to a low of $4,066 on Tuesday before rebounding to a high of $4,177.
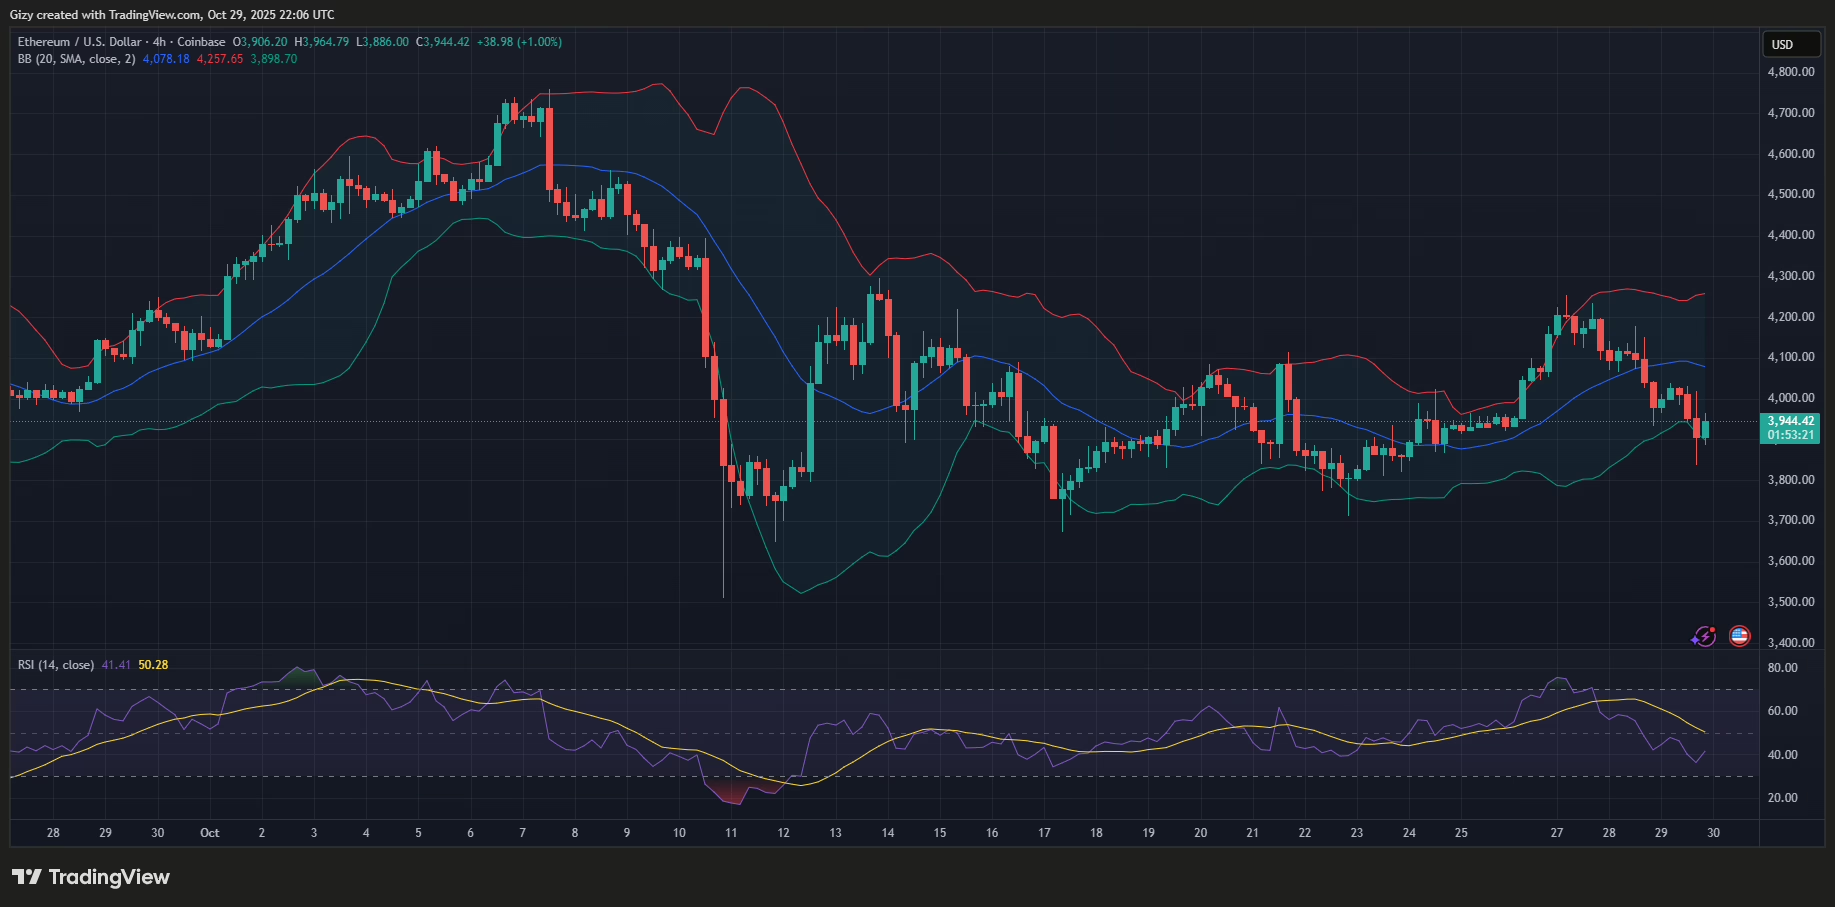
The decline worsened on Wednesday in the hours leading up to the FOMC. It dropped to a low of $3,838 but rebounded. However, its current price shows no significant improvements. Nonetheless, the MACD flagged such a decline on Tuesday, showing a bearish divergence.
Like BTC, the asset is trading close to bollinger’s lower band, suggesting that recovery might be imminent. ETH also prints a doji as the bulls stage buybacks. If the buying increases, the asset will surge and break the SMA at $4k.
If the surge continues, the altcoin may edge closer to bollinger’s upper band at $4,300. Nevertheless, recent price movements indicate a potential sell cluster at $4,200. On the other hand, the asset risks slipped as low as $3,700.
XRP/USD
XRP is experiencing the same sentiment as BTC and the rest of the market. The previous candle on the 4-hour chart shows that it slipped below $2.55 for the first time in almost five days.
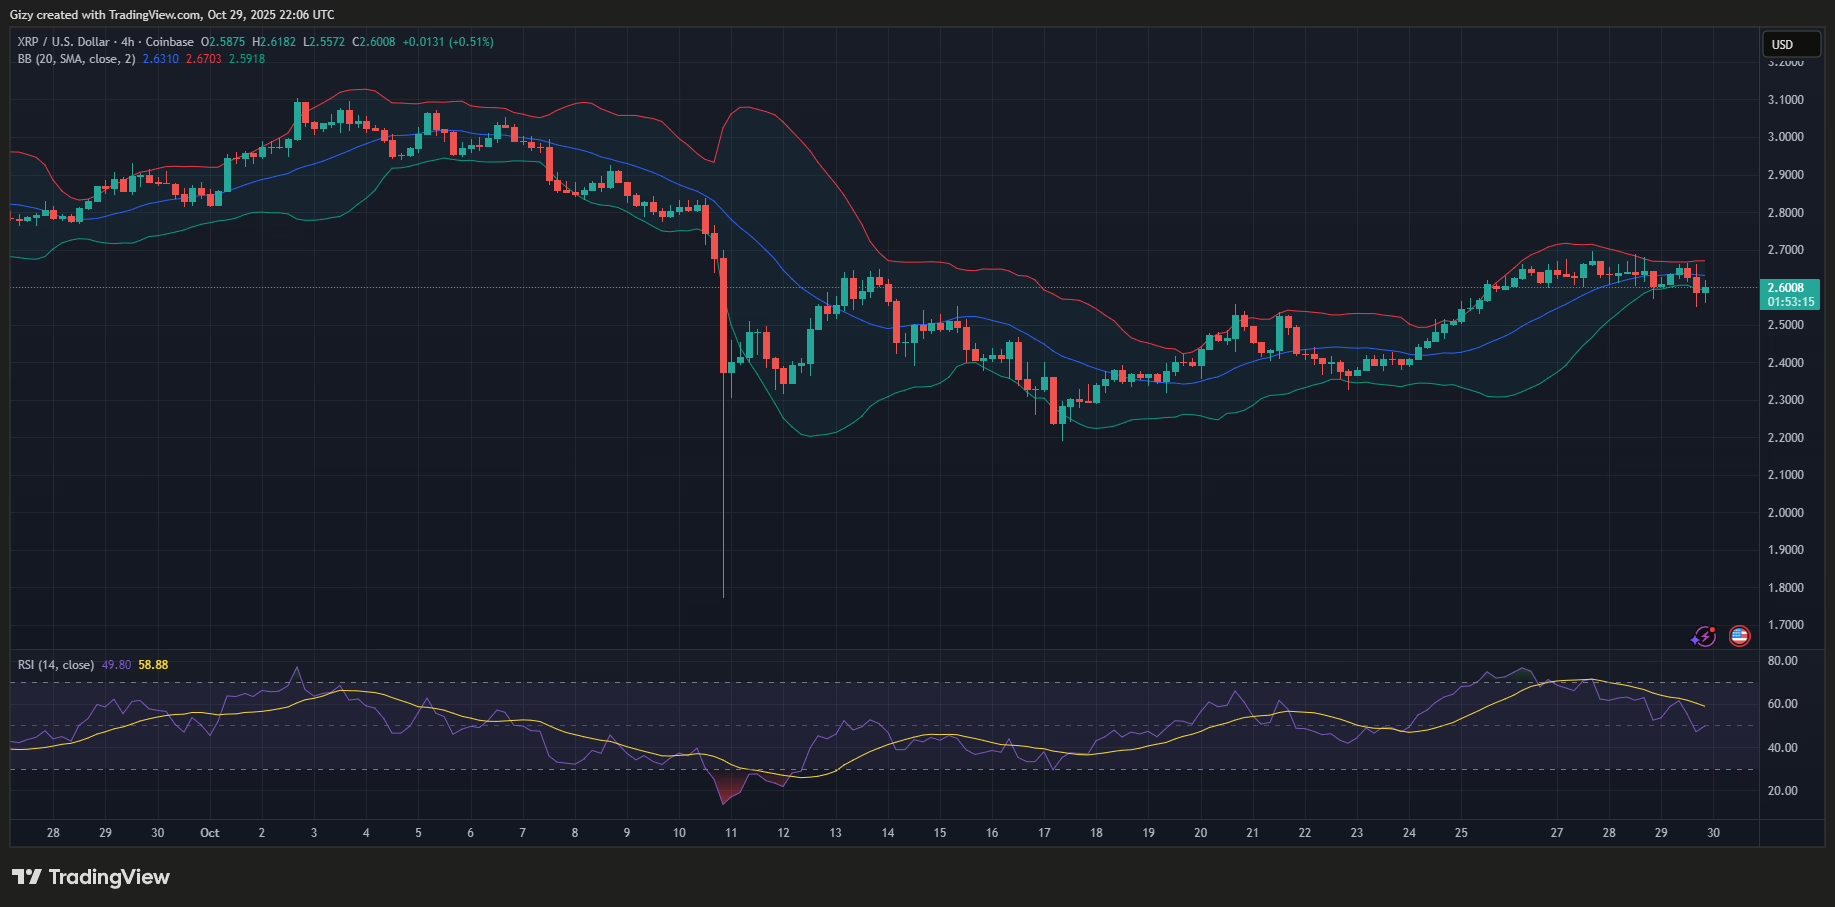
The altcoin also broke out of the bollinger bands a few hours ago. Nonetheless, while such a slip is alarming, it may hint at an impending buyback. If this plays out, the asset may reclaim $2.55 in the coming hours.
However, it is also important to note that MACD is currently negative, suggesting an increased likelihood of further decline. XRP may drop to $2.36.
BNB/USD
The 4-hour chart shows that BNB grappled with notable selling congestion at $1,120. It tested the mark thrice with no success. However, like BTC and the rest of the market, it experienced a massive decline a few hours ago, resulting in a drop to $1,084.
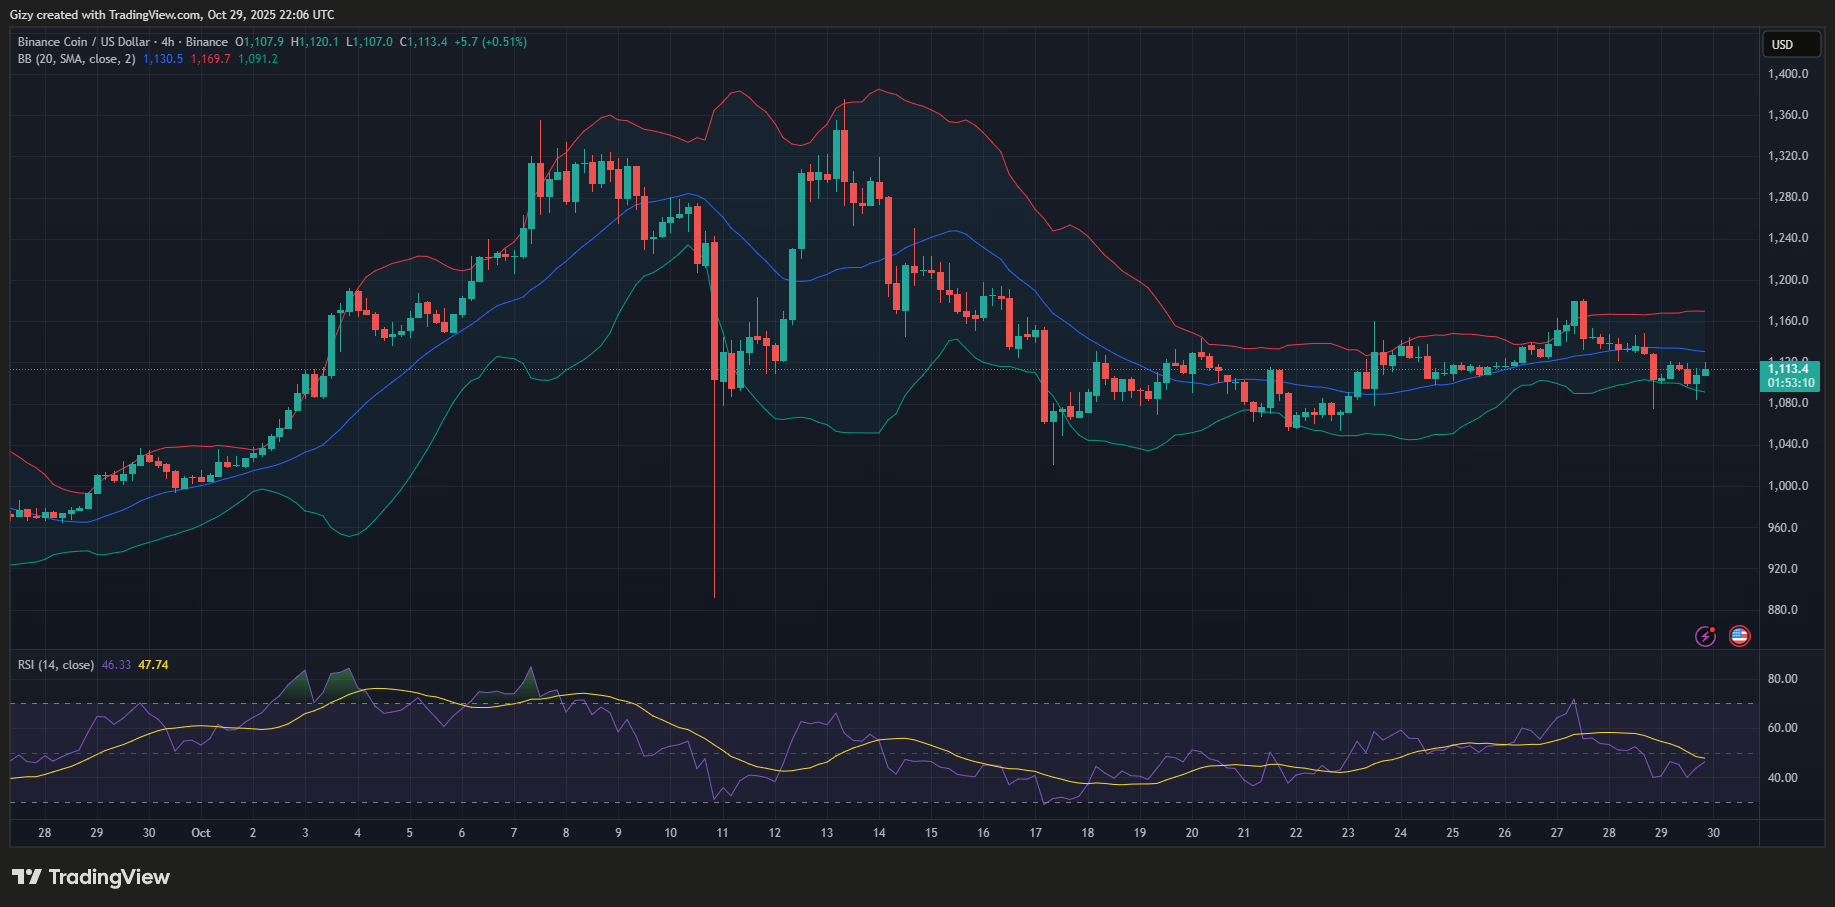
It retested the resistance a few hours ago, with the same result. This may indicate that the asset is experiencing a gradual decline in demand, and further declines may follow. If that plays out, the altcoin may retrace as low as $1,060 before rebounding.
Conversely, breaking above the barrier will see it retest $1,150 and bollinger’s upper band at $1,165.
SOL/USD
The 4-hour chart indicates that in the session 16:00 UTC, Solana retraced from $196 to $189. It rebounded and is trading $193 at the time of writing.
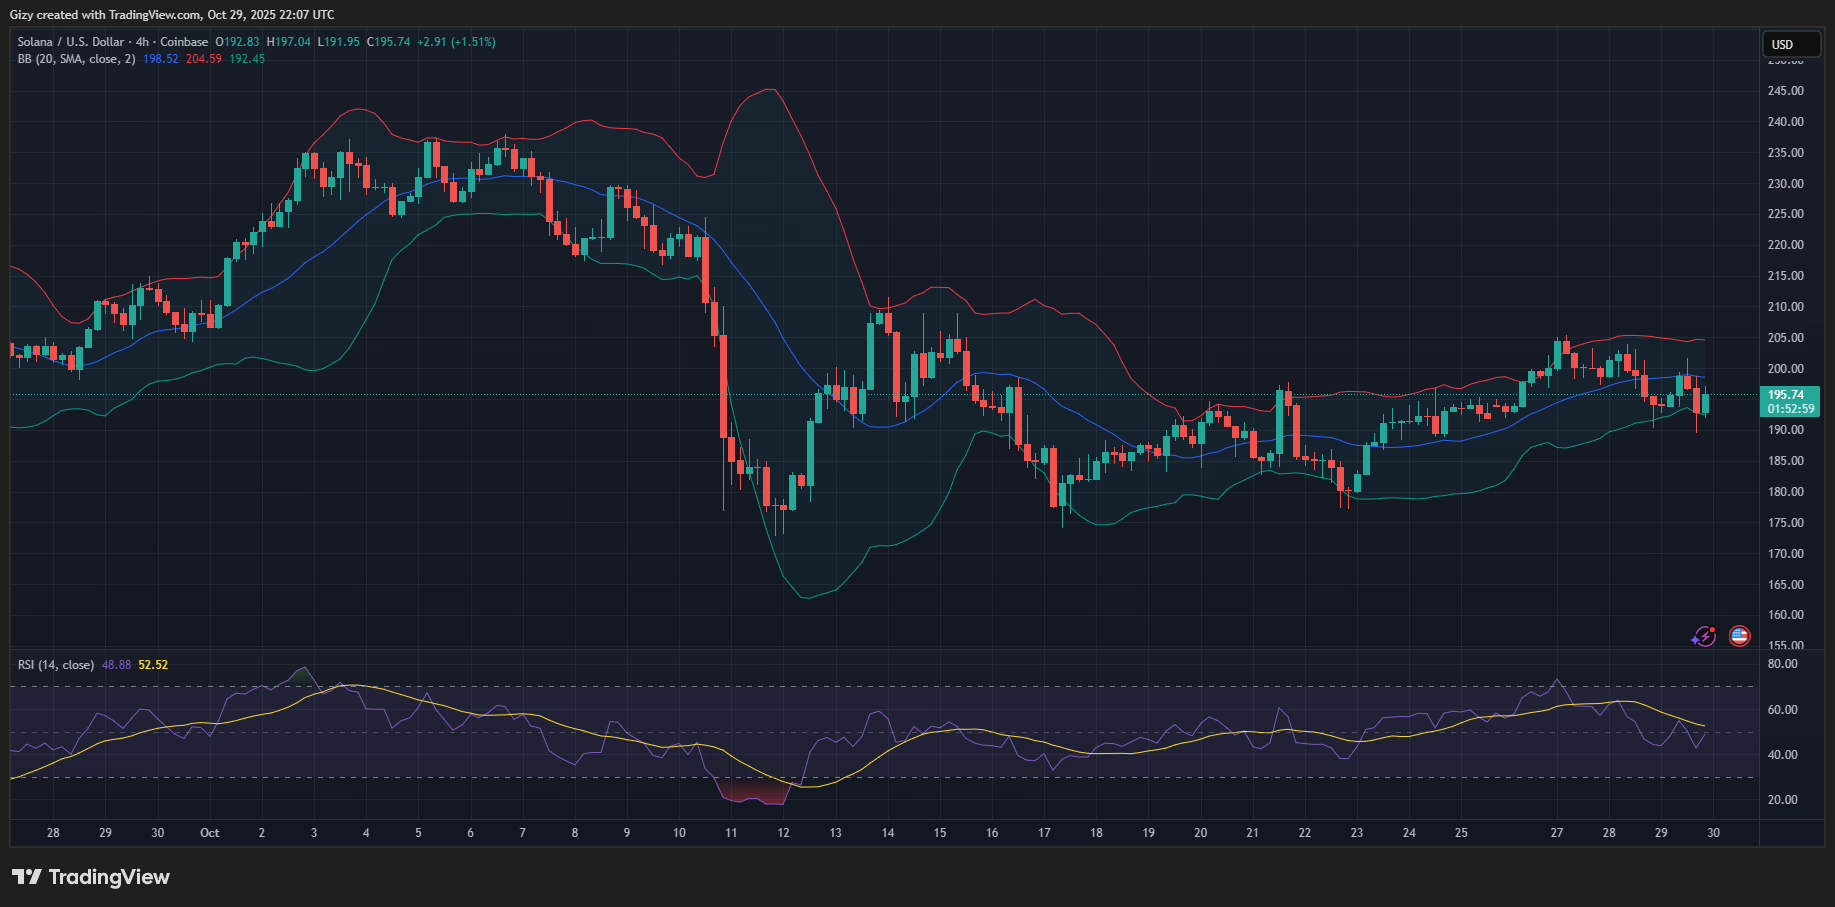
However, it surged to $197 but may end the day with slight losses. Its recent price corrections indicate that selling pressure remains high amid the bulls’ buyback attempts. If the pressure worsens, SOL may drop lower and could retest the $180 level.
Nonetheless, the bollinger band offers a ray of hope. The asset dropped to the lower band, a level that usually signals a rebound. If the bulls defend prices, the altcoin may attempt $200 in the coming days.
DOGE/USD
DOGE recently retraced to a level not seen since last Wednesday. It dropped from $0.191 to a low of $0.186 but rebounded and ended the 4-hour session with 2% increase. However, it is declining again and trades at $0.190.
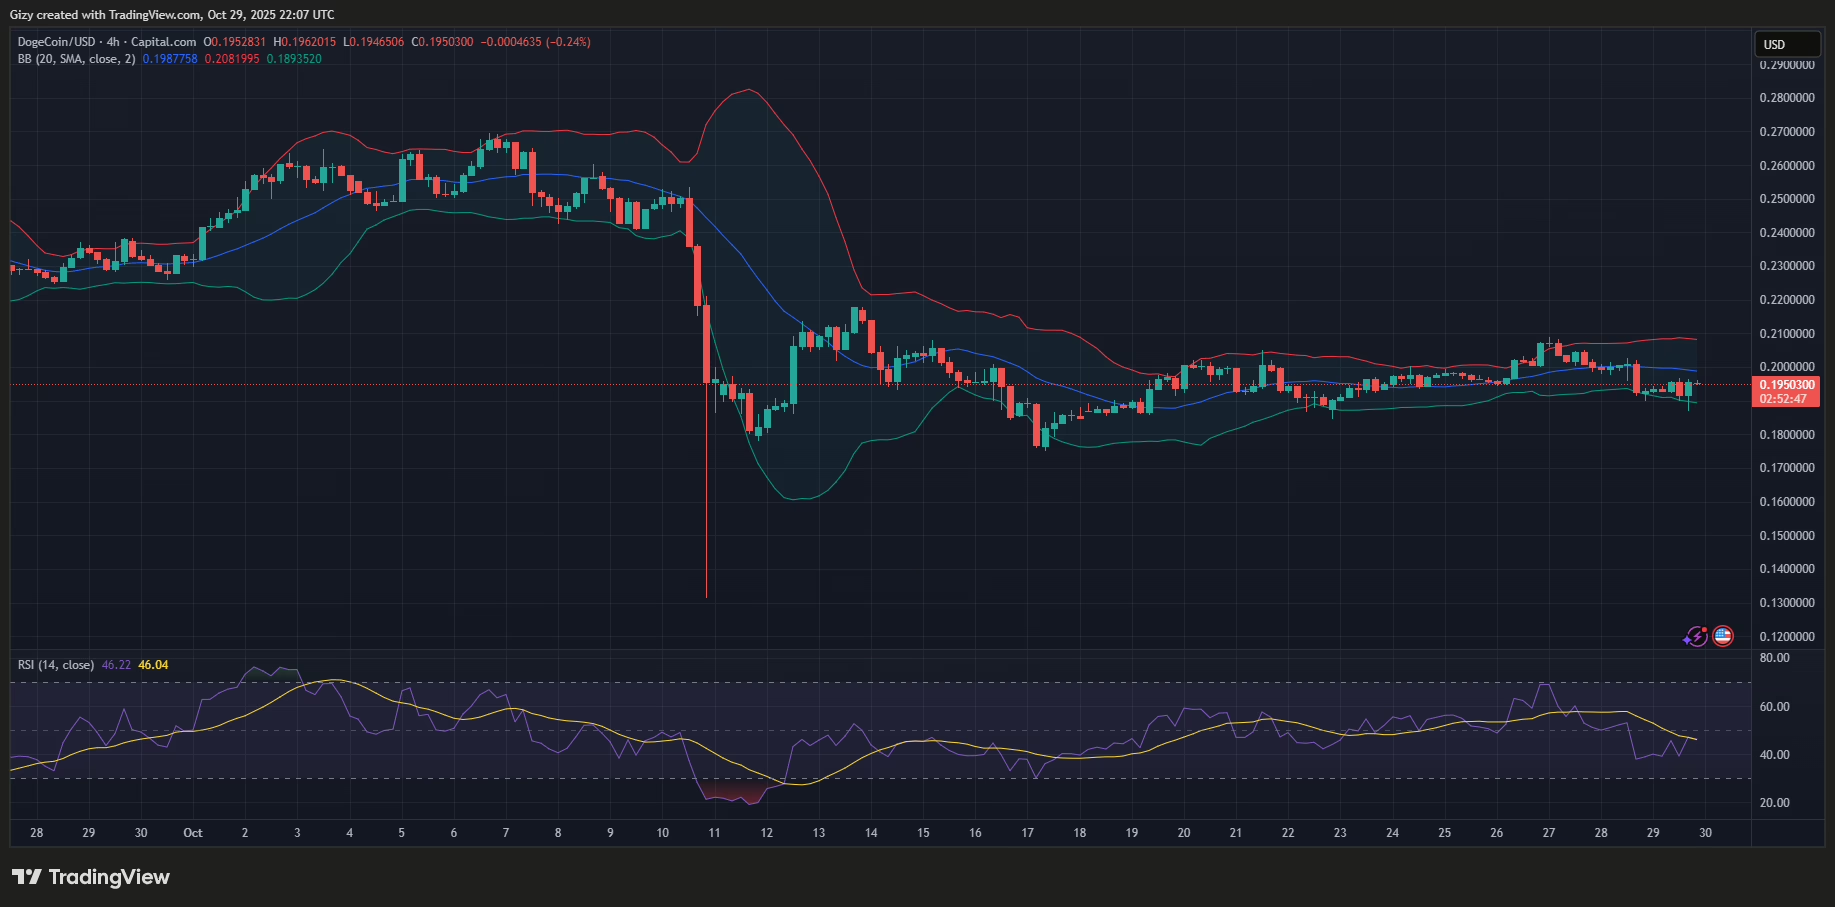
The coin is heading for a bearish close on the daily chart, and indications suggest the downtrend is far from over. The relative strength index is declining as selling pressure increases. The metric is currently at 43, and previous movement suggests a slip below 40. Prices will follow, and DOGE may retrace below $0.18.
Conversely, the bollinger bands indicate that a rebound may happen as the asset recently pulled back after slipping out of it.
ADA/USD
The 4-hour chart indicates that in the session 16:00 UTC, Cardano surged to a high of $0.66 but retraced, dropping to $0.62. It rebounded and ended the session with slight gains.
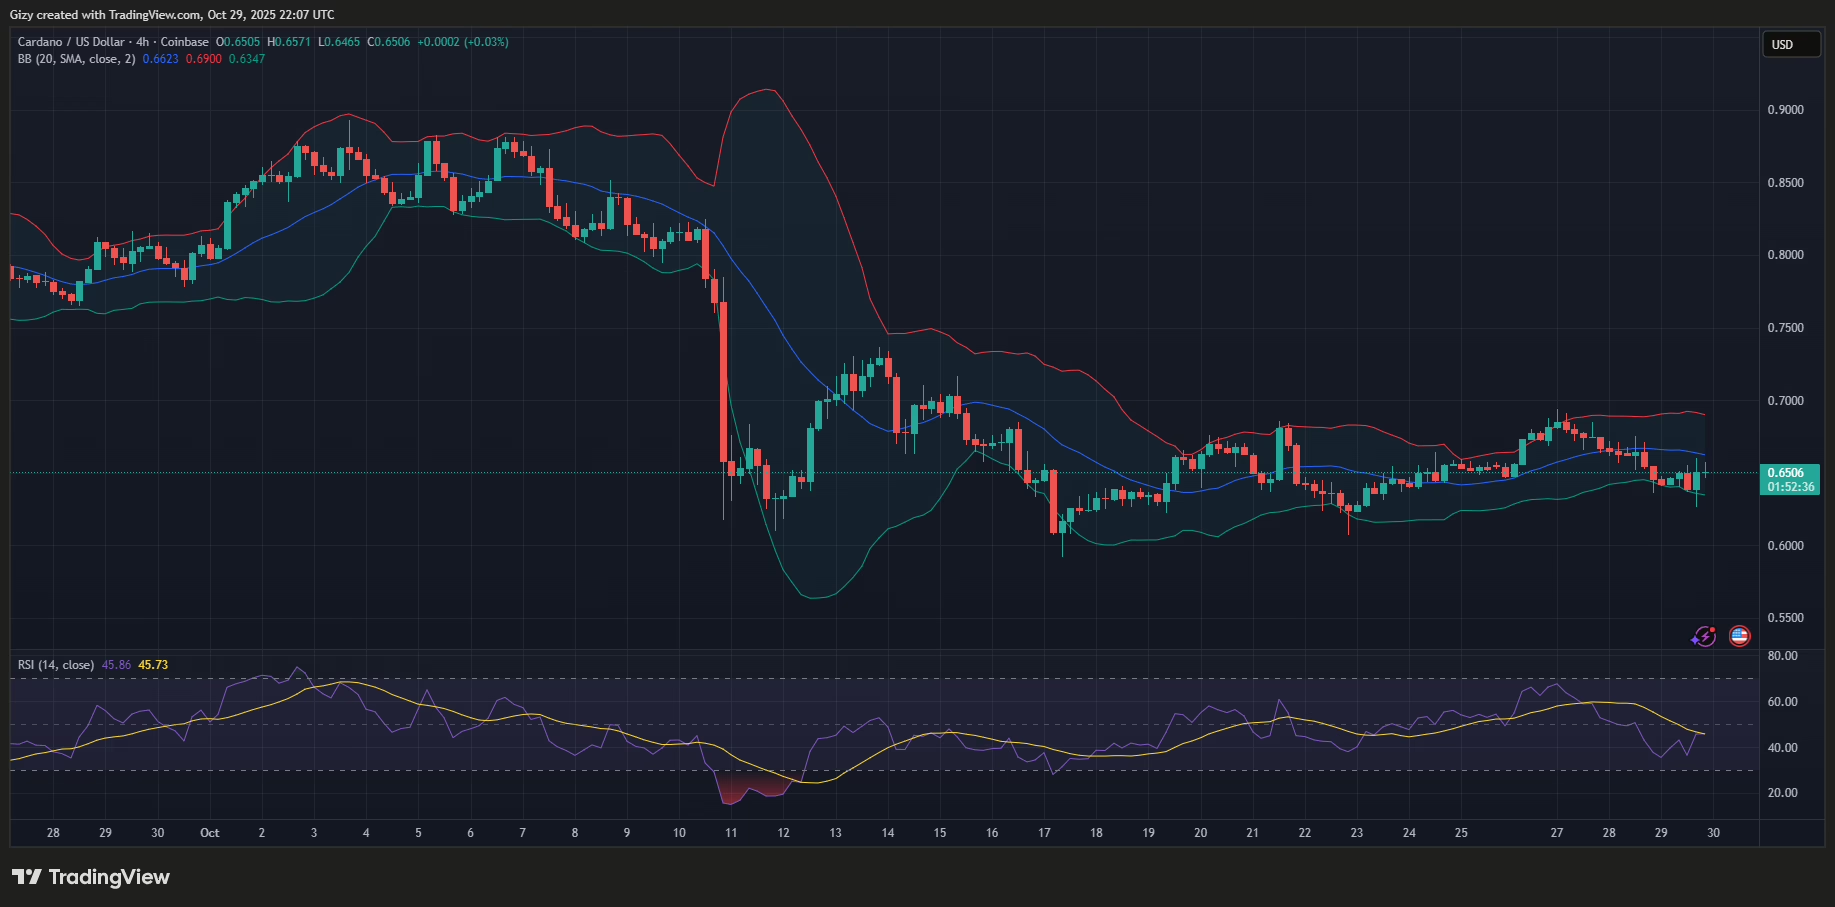
However, it’s declining again. The current session began with a spillover from the previous one, and the altcoin reached a peak of $0.65. It is trading slightly above $0.63 as selling resumed. If the current trend persists, the asset may retest its previous high of $0.62.
Nonetheless, the bollinger band offers a ray of hope. The asset dropped to the lower band, a level that usually signals a rebound. If the bulls defend prices, the altcoin may attempt $0.68 in the coming days.