ZEC attempted a recovery on Wednesday but failed, signaling subdued upward momentum. Nonetheless, it may still end the day in the green, with no significant price change.
Meanwhile, the broader crypto market followed a similar pattern. Its total valuation climbed, but the uptick was short-lived. The move came as fresh U.S. inflation data was released.
The latest Personal Consumption Expenditures (PCE) data showed signs of moderating inflation. PCE is one of the key metrics used to gauge inflation in the United States. The latest figures, released a few hours ago, came in either as expected or better than anticipated.
For example, core PCE increased 3.3% year over year, in line with expectations, while the monthly core PCE reading remained unchanged from the previous month.
The reports coincided with a brief burst of buying pressure, but the move was not strong enough to trigger a breakout from the crypto market’s week-long consolidation. Outside of ZEC, several top cryptocurrencies also continue to grapple with subdued trading volume.
Nonetheless, altcoins such as HYPE and WLD recorded notable increases, with both assets surging more than 5% and 10%, respectively.
A previous price analysis examined the potential directions of several top-10 cryptocurrencies based on their technical setups. Interestingly, there have been no major changes since Monday. Here are the key levels that could confirm a breakout or signal further downside.
BTC/USD
Downside risk remains elevated for Bitcoin despite relatively stable prices. BTC remains rangebound and continues to hold the $82,700 support level. However, it recorded a brief move above its seven-day high before retracing.
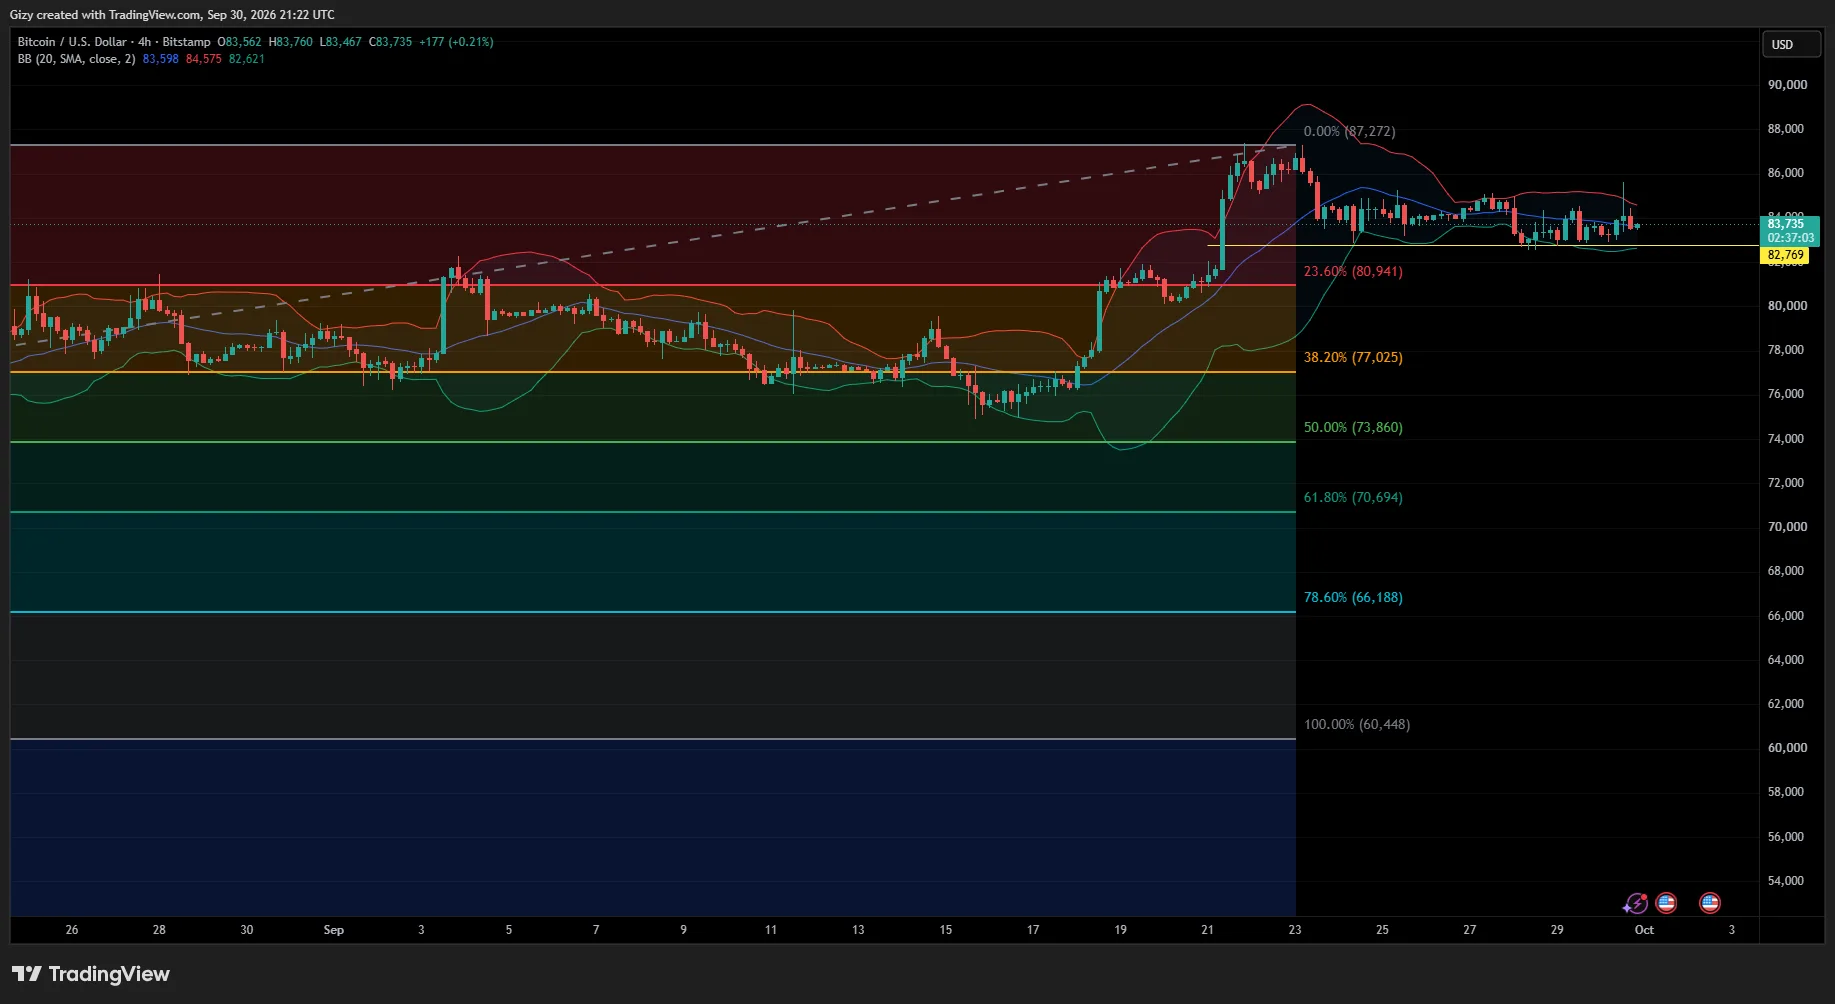
Despite the short-lived breakout, there has been no significant improvement in the 1-day technical setup. The MACD has formed a bearish crossover, suggesting that upward momentum remains weak.
If Bitcoin loses the $82,700 support, the Fibonacci retracement suggests that the next level to watch is the 23% Fib level around $81,000.
However, the 4-hour chart provides a different outlook and hints at another attempt at $85,000. The MACD recently formed a bullish crossover, while both EMAs continue to point upward despite the ongoing correction.
Overall, the 1-day chart shows that downside pressure remains elevated, while the 4-hour chart points to the possibility of a short-term recovery. Combining both timeframes suggests that BTC could remain rangebound for the rest of the week.
ETH/USD
Ethereum is on track to add another doji to the growing list on its 1-day chart. Like ZEC, ETH recorded a small uptick before retracing shortly afterward. If it closes around its current price, it will have remained within the same range for a seventh consecutive day.
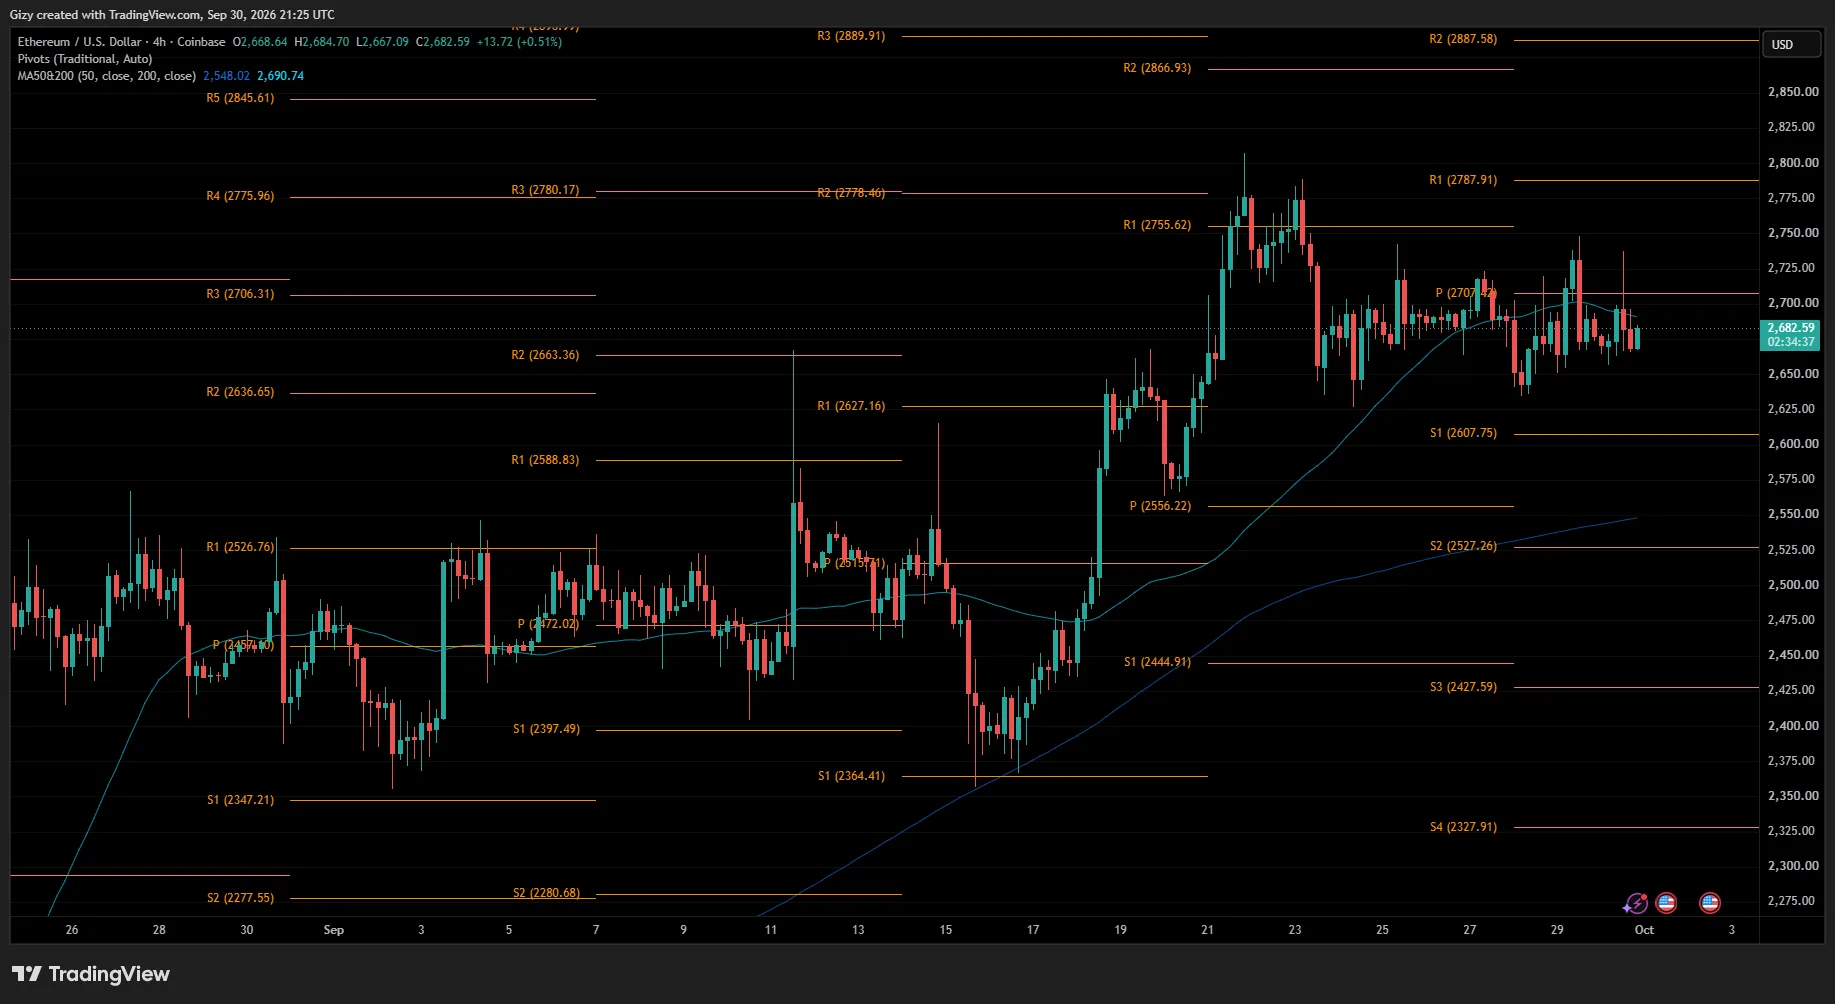
The falling Relative Strength Index (RSI) on the 1-day chart suggests weakening bullish momentum and increasing downside risk. Adding to the bearish signals is the pivot-point setup on the 4-hour chart.
ETH has repeatedly failed to decisively reclaim its pivot point around $2,700. The inability to break through this selling pressure increases the possibility of a move toward the first pivot support.
Additionally, the 50-day moving average has become a difficult level for the asset to reclaim after falling below it. If selling pressure intensifies, the probability of a move toward the 200-day moving average could increase.
Overall, the 1-day and 4-hour charts point to elevated downside risk and suggest that ETH could fall below $2,650 this week.
BNB/USD
BNB moved closer to the upper Bollinger Band a few hours ago as market conditions improved. However, the asset subsequently retraced and could face additional selling pressure.
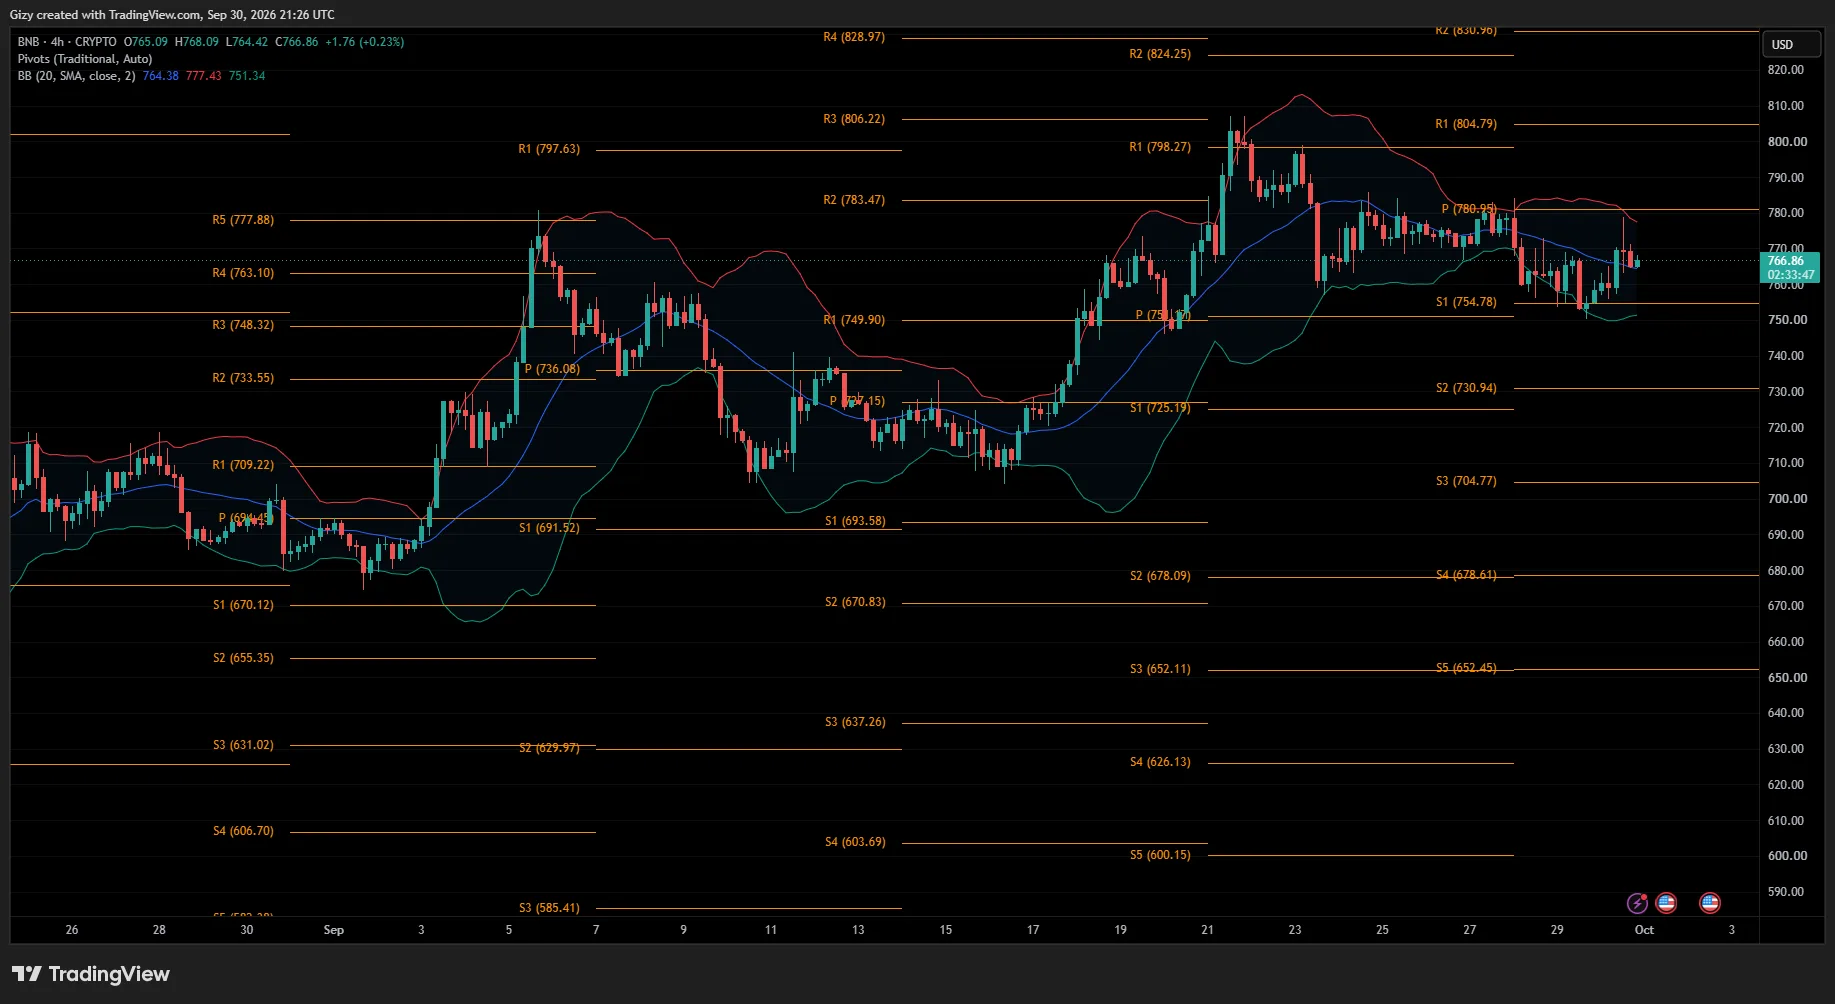
The lower Bollinger Band, currently around $750, is the next potential target if the decline continues.
Meanwhile, the first pivot support continues to attract notable demand. If current conditions persist, BNB could retest $750, although a decisive break below that level appears less likely based on the current setup.
In a nutshell, BNB could continue trading above the support level for the rest of the week.
However, the Bollinger Bands are contracting, suggesting that a larger move could be approaching. The breakout may not occur this week, but the narrowing bands indicate that volatility could increase soon.
XRP/USD
XRP has been trading in a gradual downward pattern since Saturday. It has also failed to register a green daily candle during that period, and the current session may not break the trend.
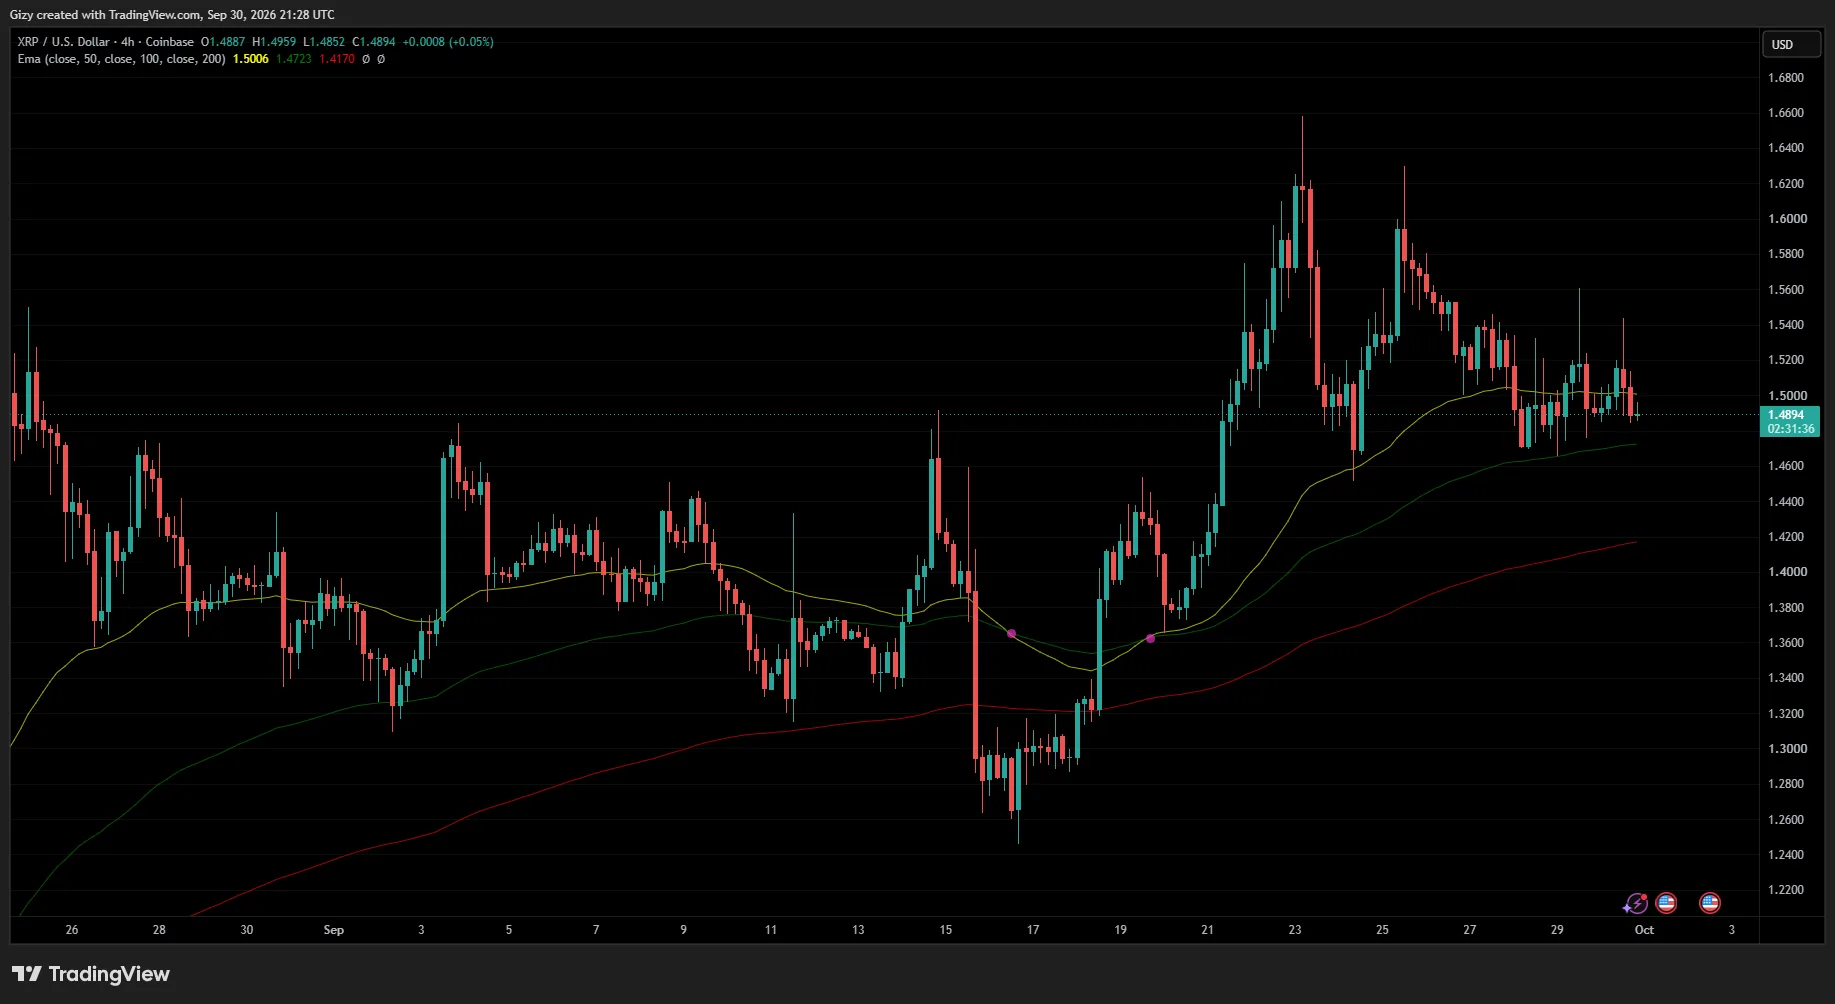
With the fundamentals-driven rally losing momentum, XRP has retraced toward its opening price.
Not much has changed on the 4-hour chart despite the brief uptick. Selling pressure remains present, while the 50, 100 and 200 EMAs provide useful reference points for the next move.
XRP could continue trading between the 50 and 100 EMAs if current conditions remain unchanged.
Previous price action points to $1.46 as the next key level if the current trend continues. While a decline to that level appears relatively unlikely this week, XRP could retest the 200 EMA next week if selling pressure increases.
SOL/USD
SOL continues to trade above the 50 EMA as buying pressure gradually weakens. However, repeated moves around the level suggest that the asset could begin trading between the 50 and 100 EMAs.
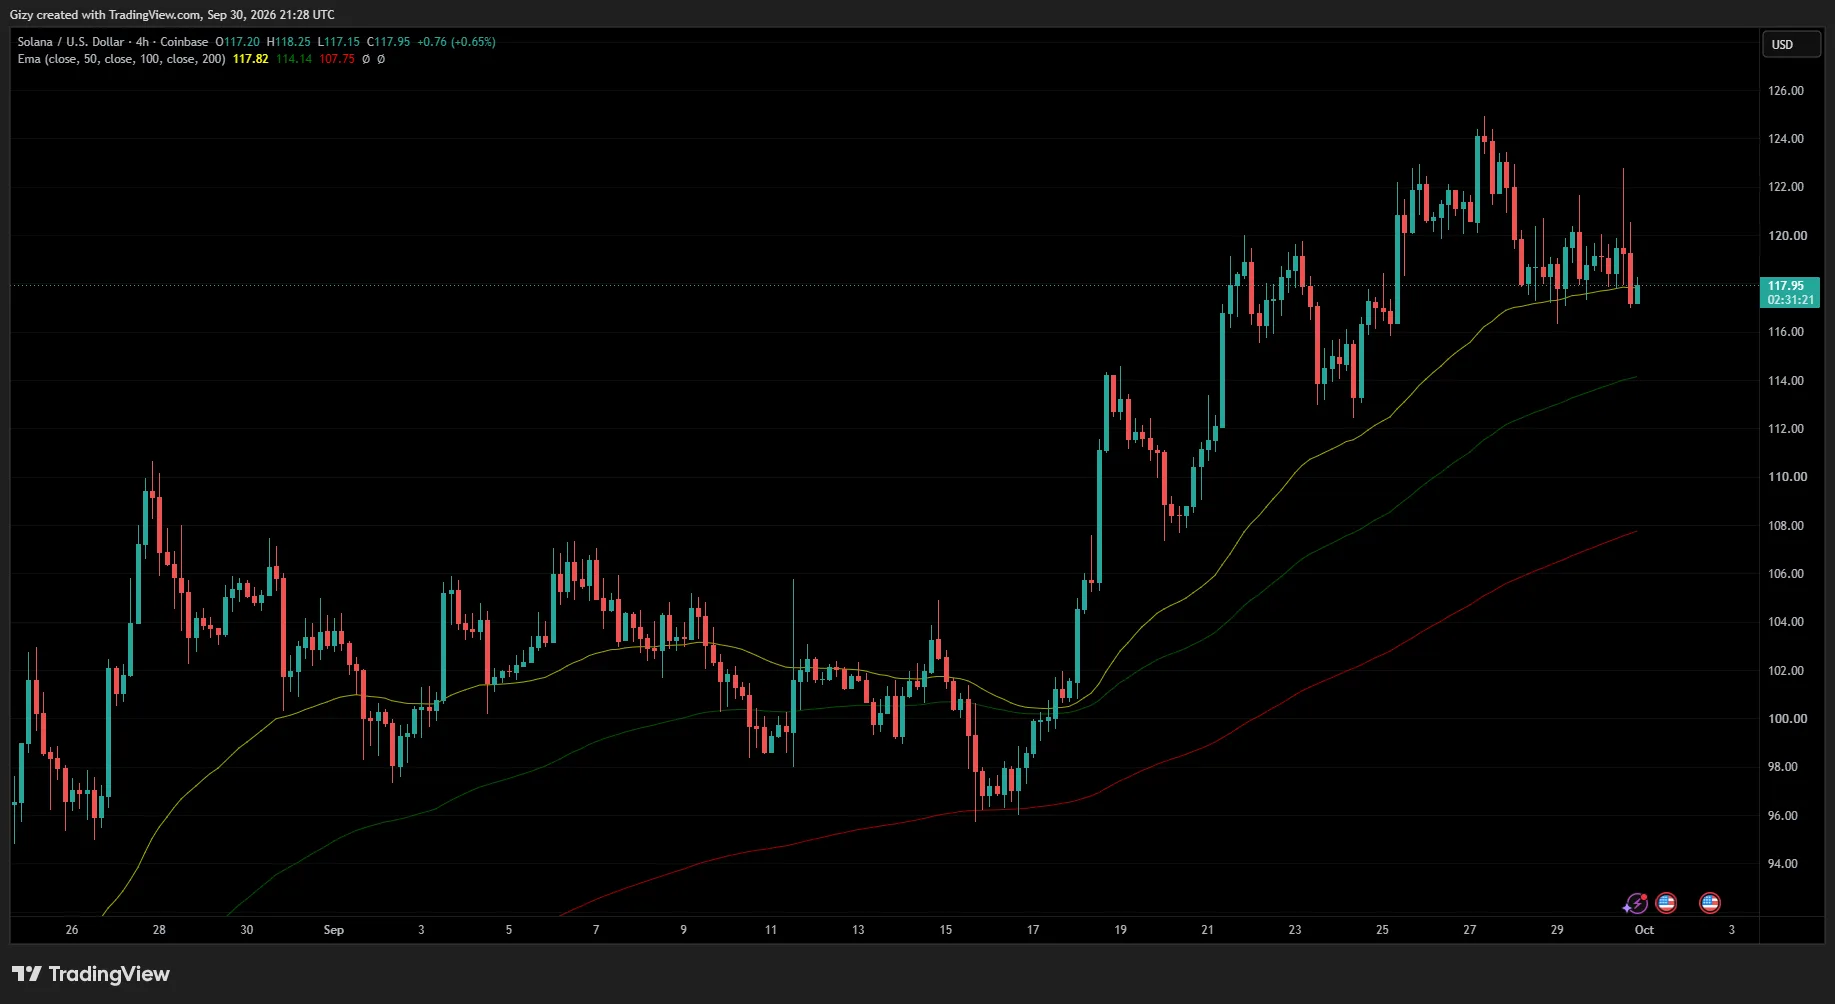
Thursday could present one of the biggest tests for SOL this week. If it holds above $117, which currently aligns with the 50 EMA, the asset could end the week with little or no significant price change.
However, a decisive break below the level could send SOL toward the 100 EMA around $114.
Confirmation should come from the next few candles. It is also worth noting that SOL recently lost the $118 level. A new daily candle closing below that mark would strengthen the case for a move toward $114.
ZEC/USD
ZEC turned positive on the 4-hour chart, suggesting a potential revival in upward momentum. The main indicator supporting this view is the MACD, which has formed a positive crossover.
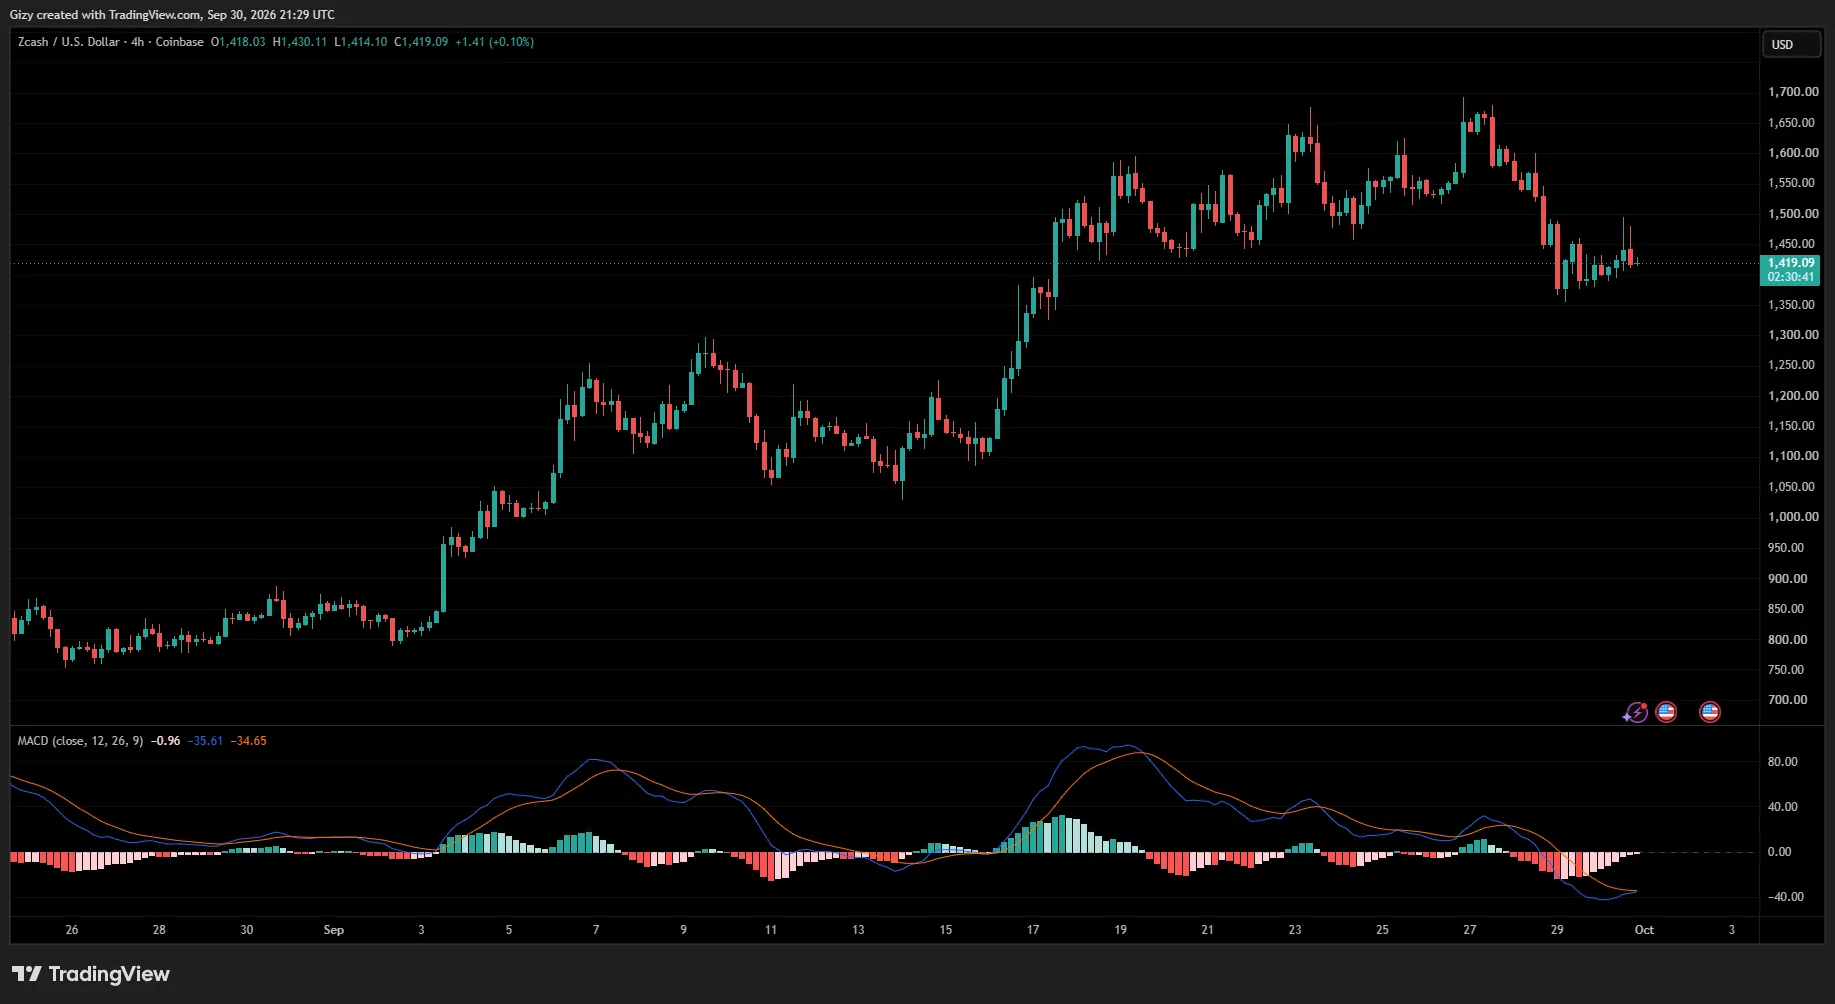
If the bulls sustain the recovery, ZEC could attempt to reclaim $1,500. However, the likelihood of such a move remains limited in the near term, as the altcoin has yet to decisively break above $1,480.
A sustained breakout above $1,480 could open the door to a move toward $1,570.
Conversely, if the recovery loses momentum, ZEC could retrace toward the $1,370 support level.