ETH is trading significantly lower than it started the day, as it saw another round of massive selloffs. It’s on a downtrend following its milestone the previous day.
In terms of volume, the coin is seeing an over 126% spike. However, the current price indicates that a bulk of the volume is from sellers.
The global crypto market is declining as several major assets are on a downtrend. It started Monday at $3.90 trillion and retraced after a slight uptick. The value retraced to $3.78 trillion but shows signs of recovery.
There are speculations about why the market is seeing such levels of corrections. One X user blamed the price declines on Binance, saying they are manipulating the market and liquidating some long positions. Nonetheless, a sweep through the social media platform indicates that several others agree with his assertion.
One user took a step further, claiming that Coinbase has joined the manipulation scheme and that the exchange is dumping more BTC and ETH.
Concerning fundamentals, there is no big news at the time of writing. Trading actions suggest there is cascading from the previous day when a whale dumped 12000 BTC. The selling frenzy continues, with more investors joining.
The market is off to a bad start. How will it affect prices in the coming days?
BTC/USD
Bitcoin had a massive retracement on Sunday, dropping to a low of $110,671. It recovered and ended the day with losses of almost 2%.
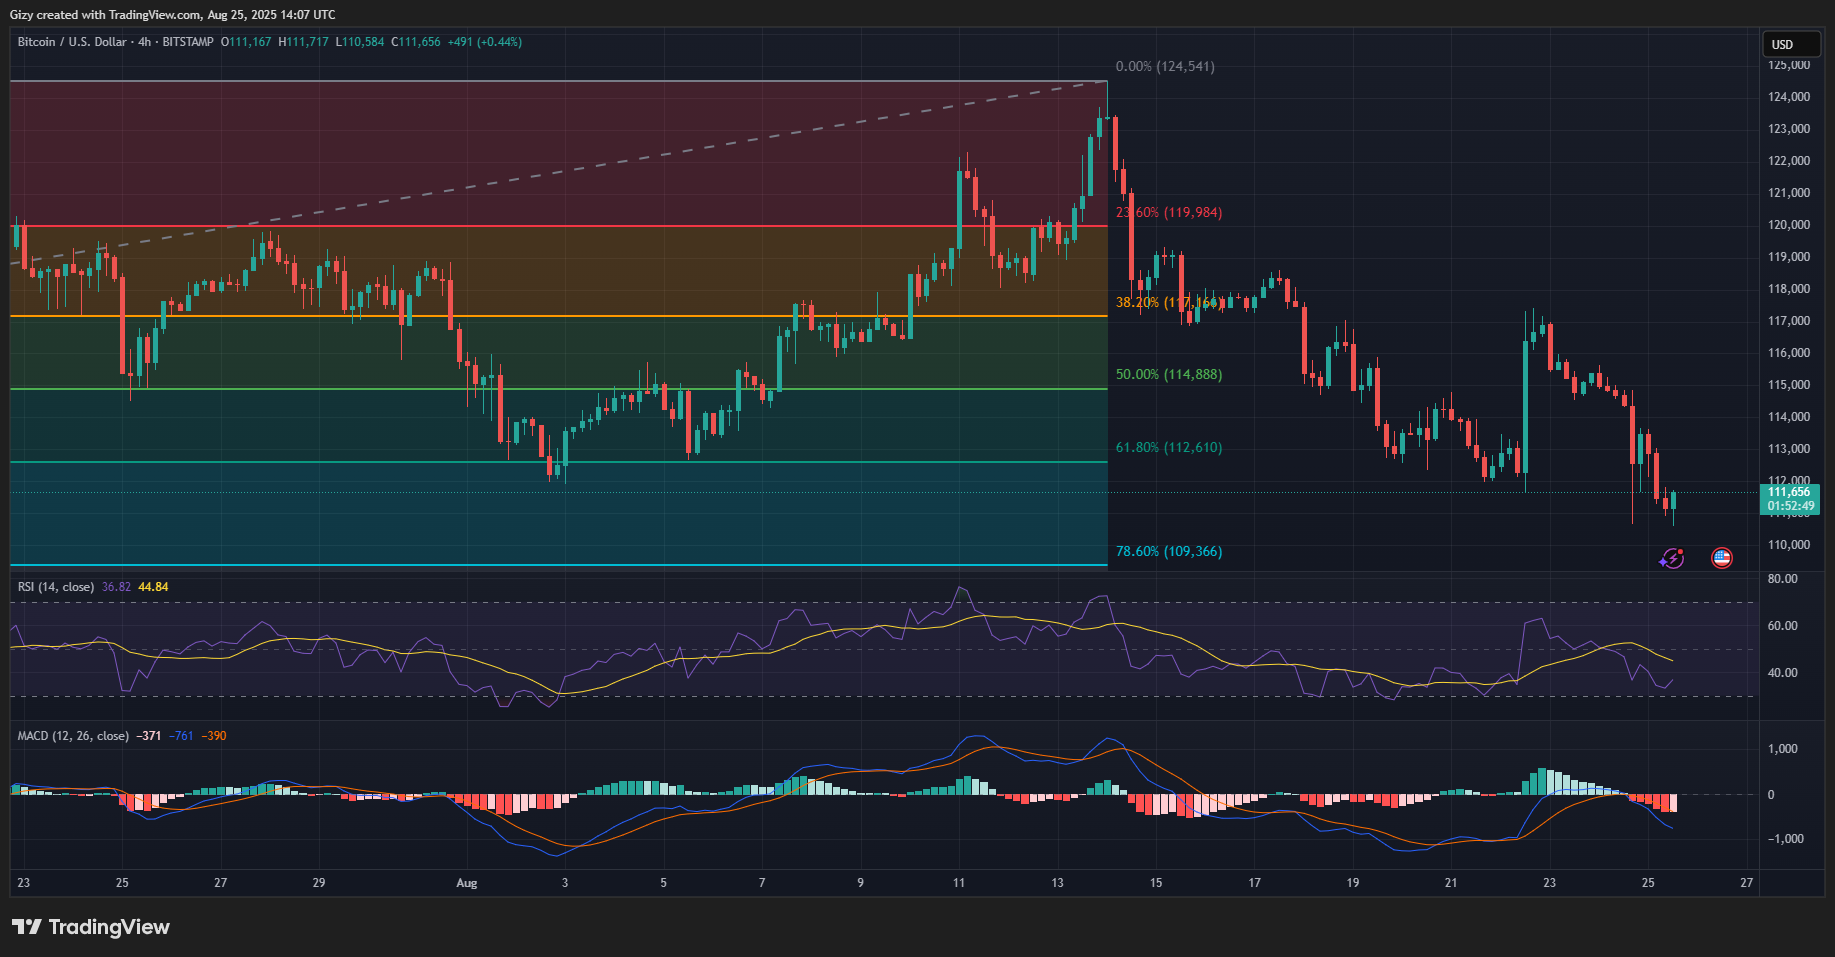
The bears continued the selling on Monday, causing another retracement close to the previous day’s low. However, the current price indicates a slight attempt at recovery.
The 4-hour chart suggests that the apex coin will continue upward following its rebound. A closer look at the chart shows that the asset bounced off $110,900 a few hours ago. It prints its first green after three red candles as the bulls stage a buyback. Nonetheless, the rising RSI aligns with the previous assertion.
If the uptrend continues, BTC will reclaim $114k. Previous price movements point to further attempts at $116k. Conversely, a drop below $110k remains likely if the selloff continues.
ETH/USD
Ethereum saw another wave of selling a few hours ago. As a result, it retraced to a low of $4,519 before rebounding. It is worth noting that the first wave started on Sunday when the coin attained a new all-time high. The latest decline was due to more traders taking a profit.
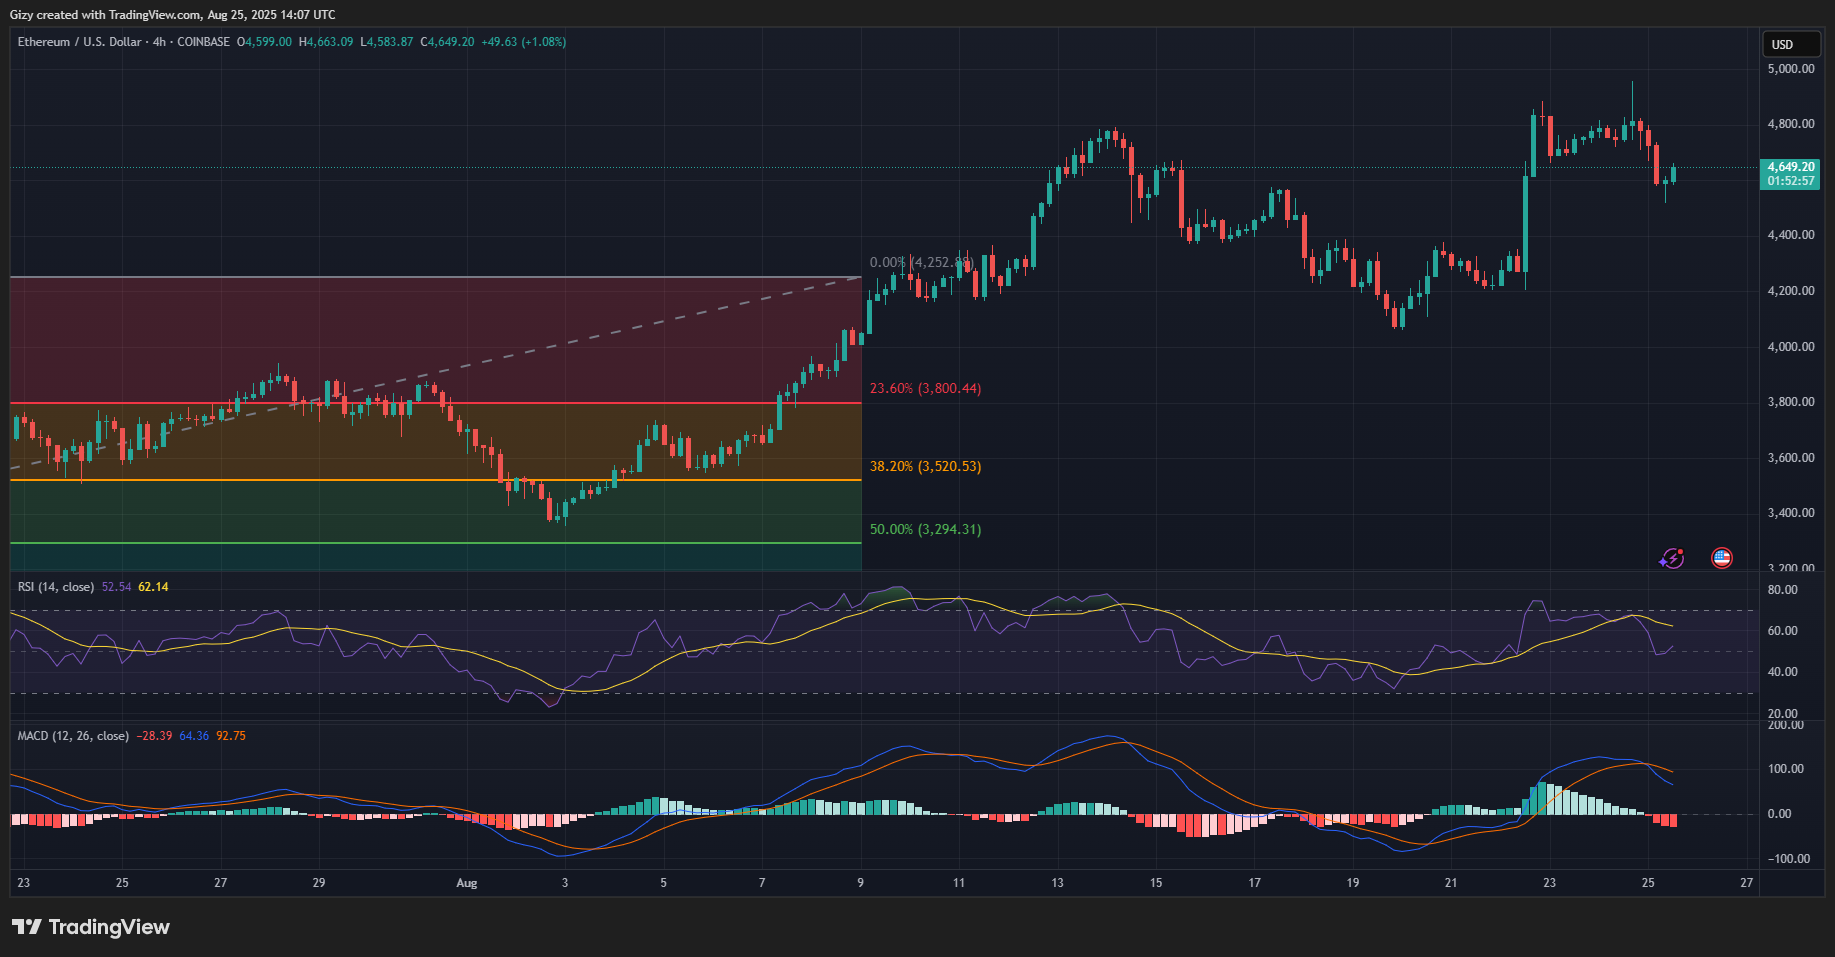
Nonetheless, ETH has shed more than half its previous losses. It trades at $4,627 at the time of writing, with the 4-hour chart indicating that the hike will continue.
The previous candle depicts the massive dip and the recovery. The latest candle depicts a continued uptick, and indicators are reacting to it. One such is the relative strength index, which is rising due to buying pressure.
Previous price movement points to $4,700 as the next price mark. The mark has served as a tough in recent times, and the bulls will look to reclaim it. ETH may continue upward, retesting $4,800 in the coming days.
XRP/USD
The 1-day chart shows that XRP is heading for its third day of consecutive losses. It is having its biggest decline on Monday, dropping to a low of $2.91 a few hours ago.
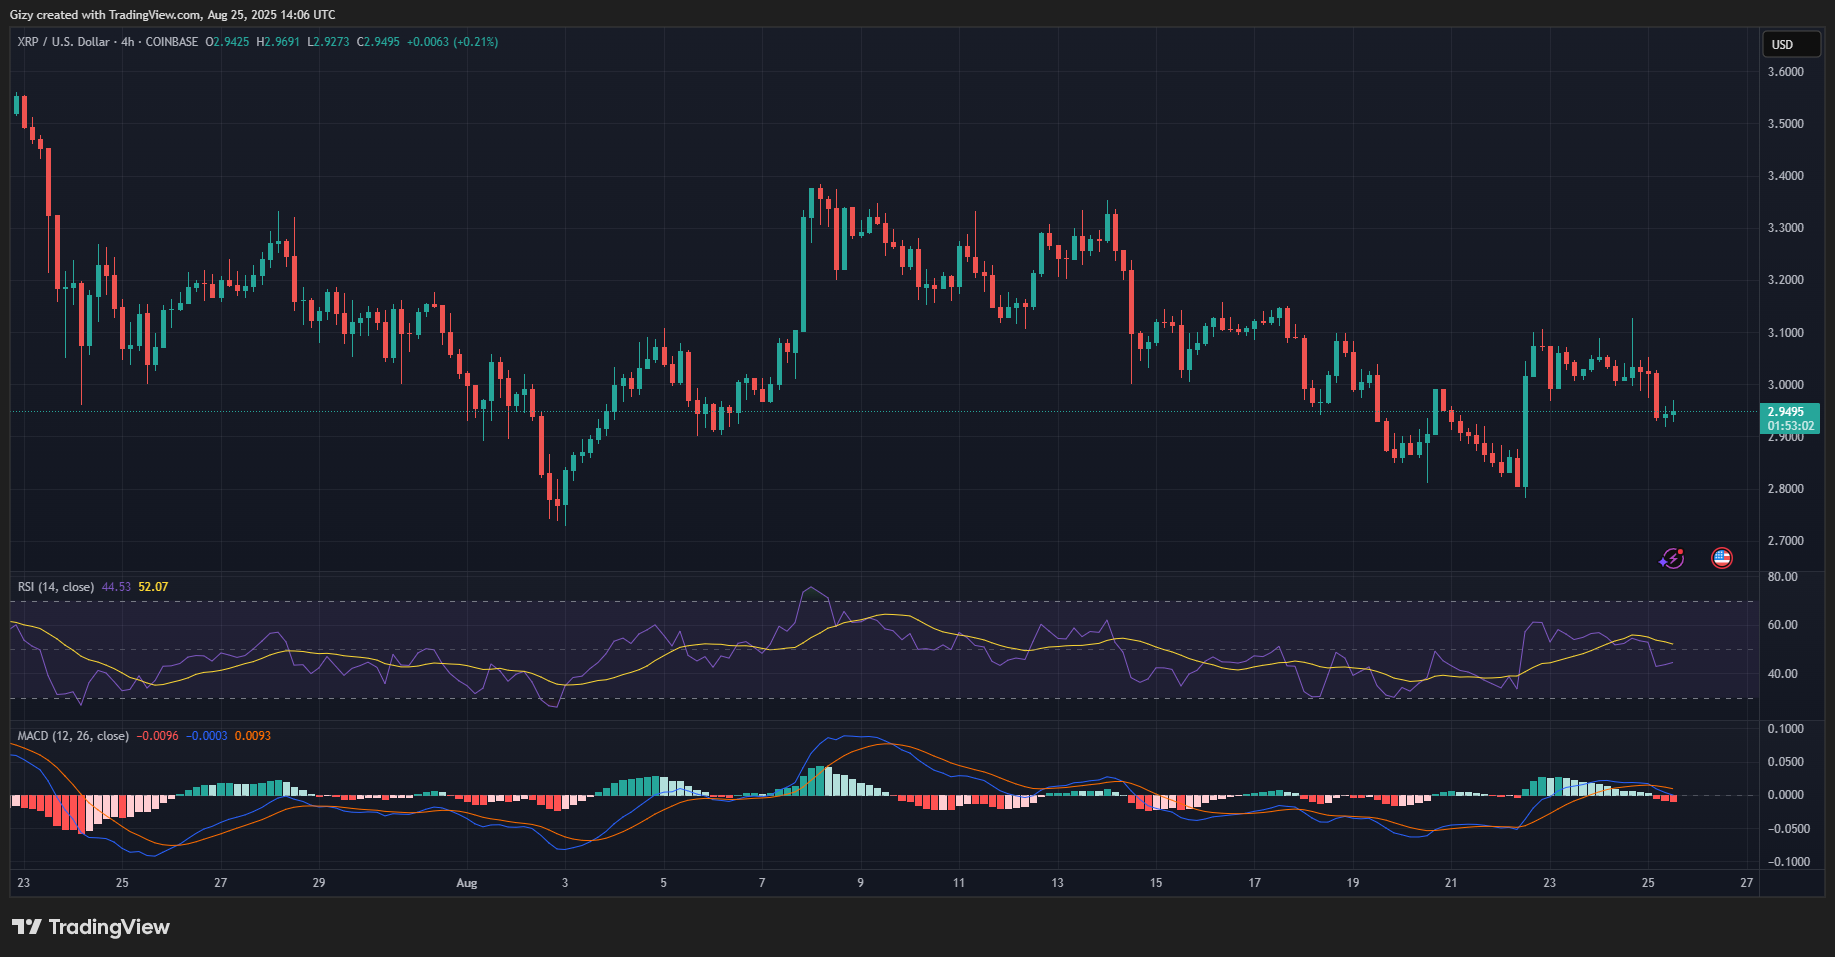
However, like ETH, the 4-hour chart is flashing green signals at the time of writing. RSI is at 45, indicating a slight improvement from its previous reading as the coin sees more buying pressure. The metric is reacting to a buyback attempt.
The change in RSI shows a chance of further increases in the coming days. XRP will look to reclaim $3 if the trend continues. It may surge as high as $3.10 after it reclaims this level.
BNB/USD
The 4-hour chart shows that BNB had a massive decline in the session starting at 4:00 UTC. It lost over 2% and dipped further in the next candle. However, it prints its first green candle of the day as bullish sentiment returns to the market.
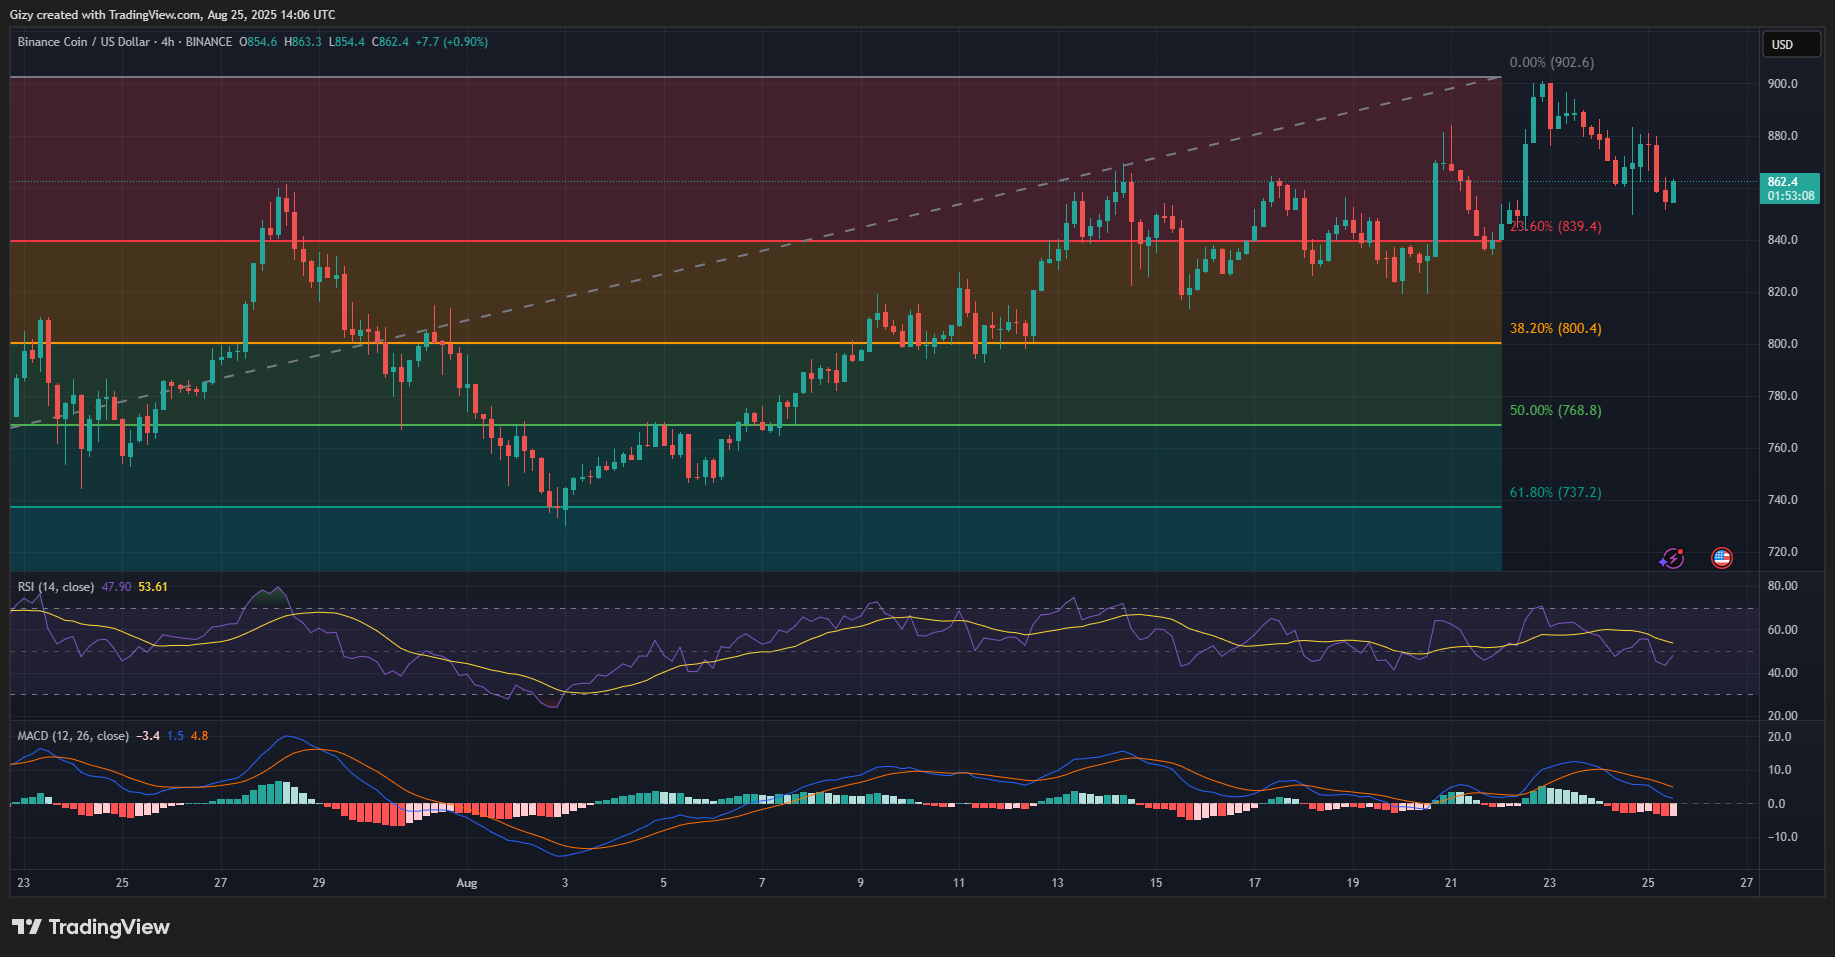
RSI is rising as buying pressure continues. If the trend continues, the altcoin will look to erase its entire losses.
Previous price movements indicate that BNB is trading at $860. It is grappling with slight selling pressure at the mark. However, decisively flipping it will result in an attempt at $880.
SOL/USD
Solana prints a doji on the 4-hour chart. The candle indicates that the asset is still grappling with slight selling pressure amid the buyback attempts.
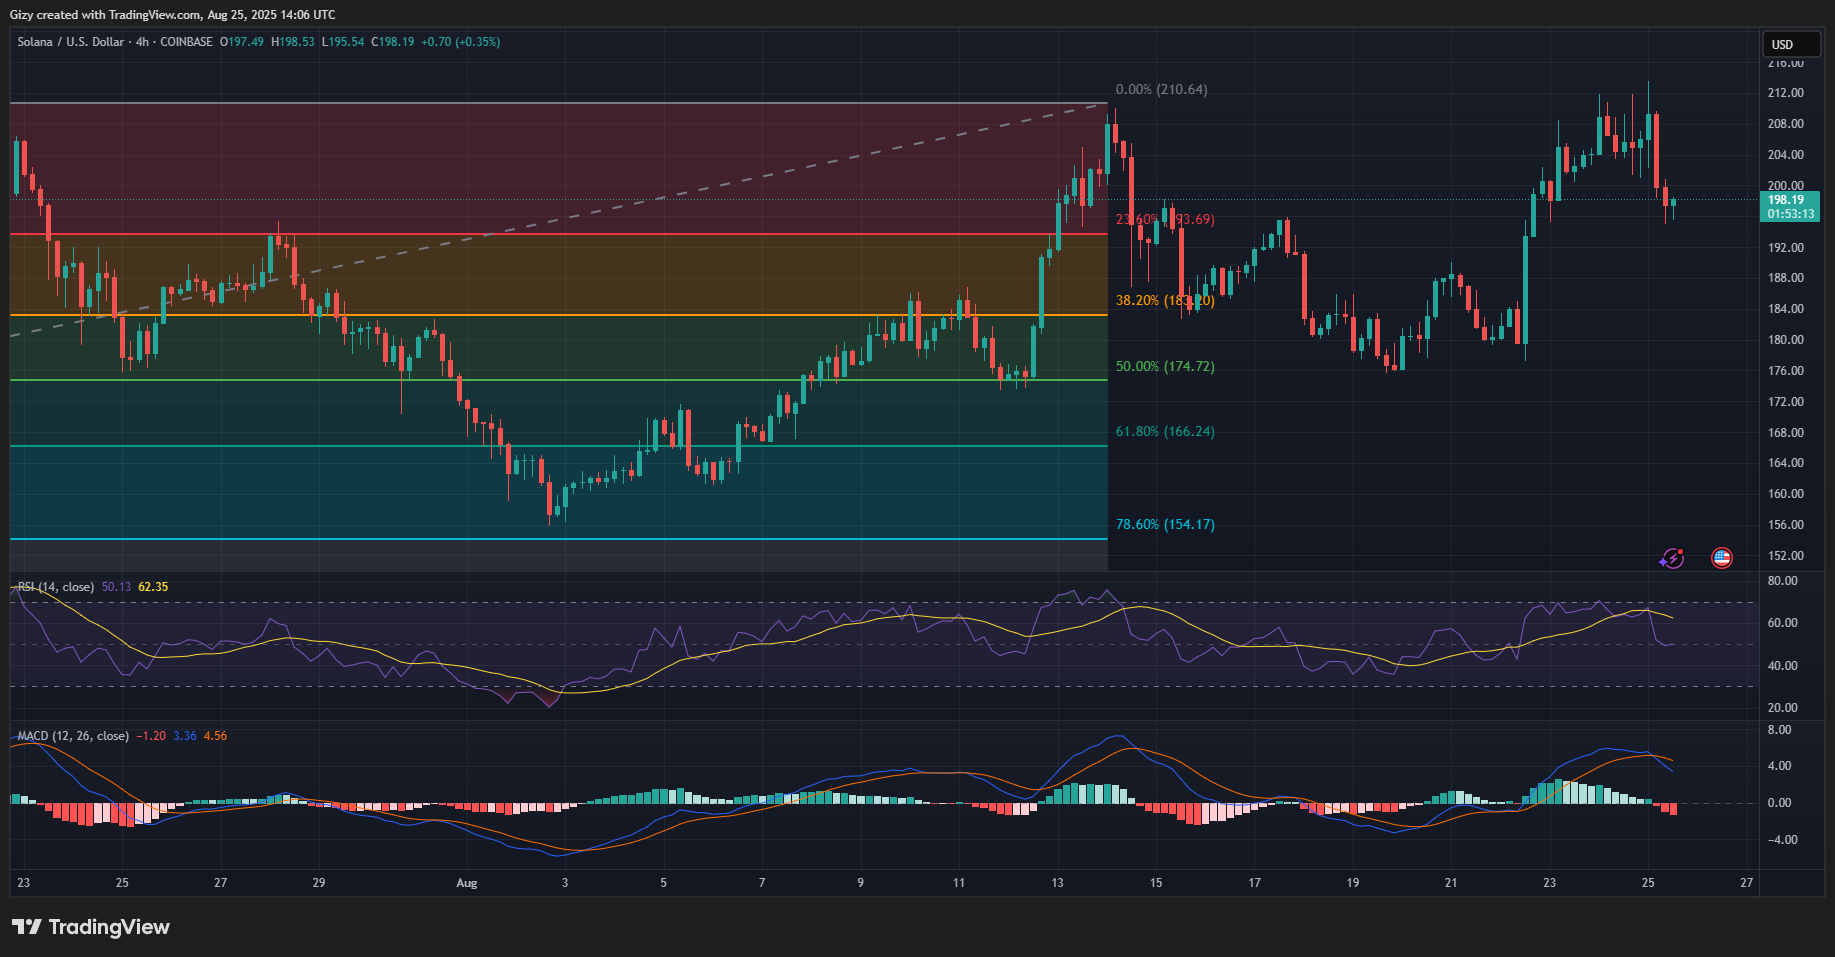
Nonetheless, RSI slowed its descent as selling slowed down. SOL recently had a 4% drop, and it dropped from 67 to 52. Its current trend offers a glimmer of hope that prices may recover.
A closer look at the chart indicates that the coin rebounded at a critical support. Previous price movement demonstrates that the altcoin may retest $210 in the coming days. However, a slip below $195 may result in a drop to $180.
DOGE/USD
DOGE is fast approaching its previous low. The 4-hour chart shows that it recently dropped to a low of $0.216 but rebounded. Its latest price action suggests that it is yet to find support and continue its downtrend. Nonetheless, it’s important to note that selling has slowed down following the 4% decline earlier.
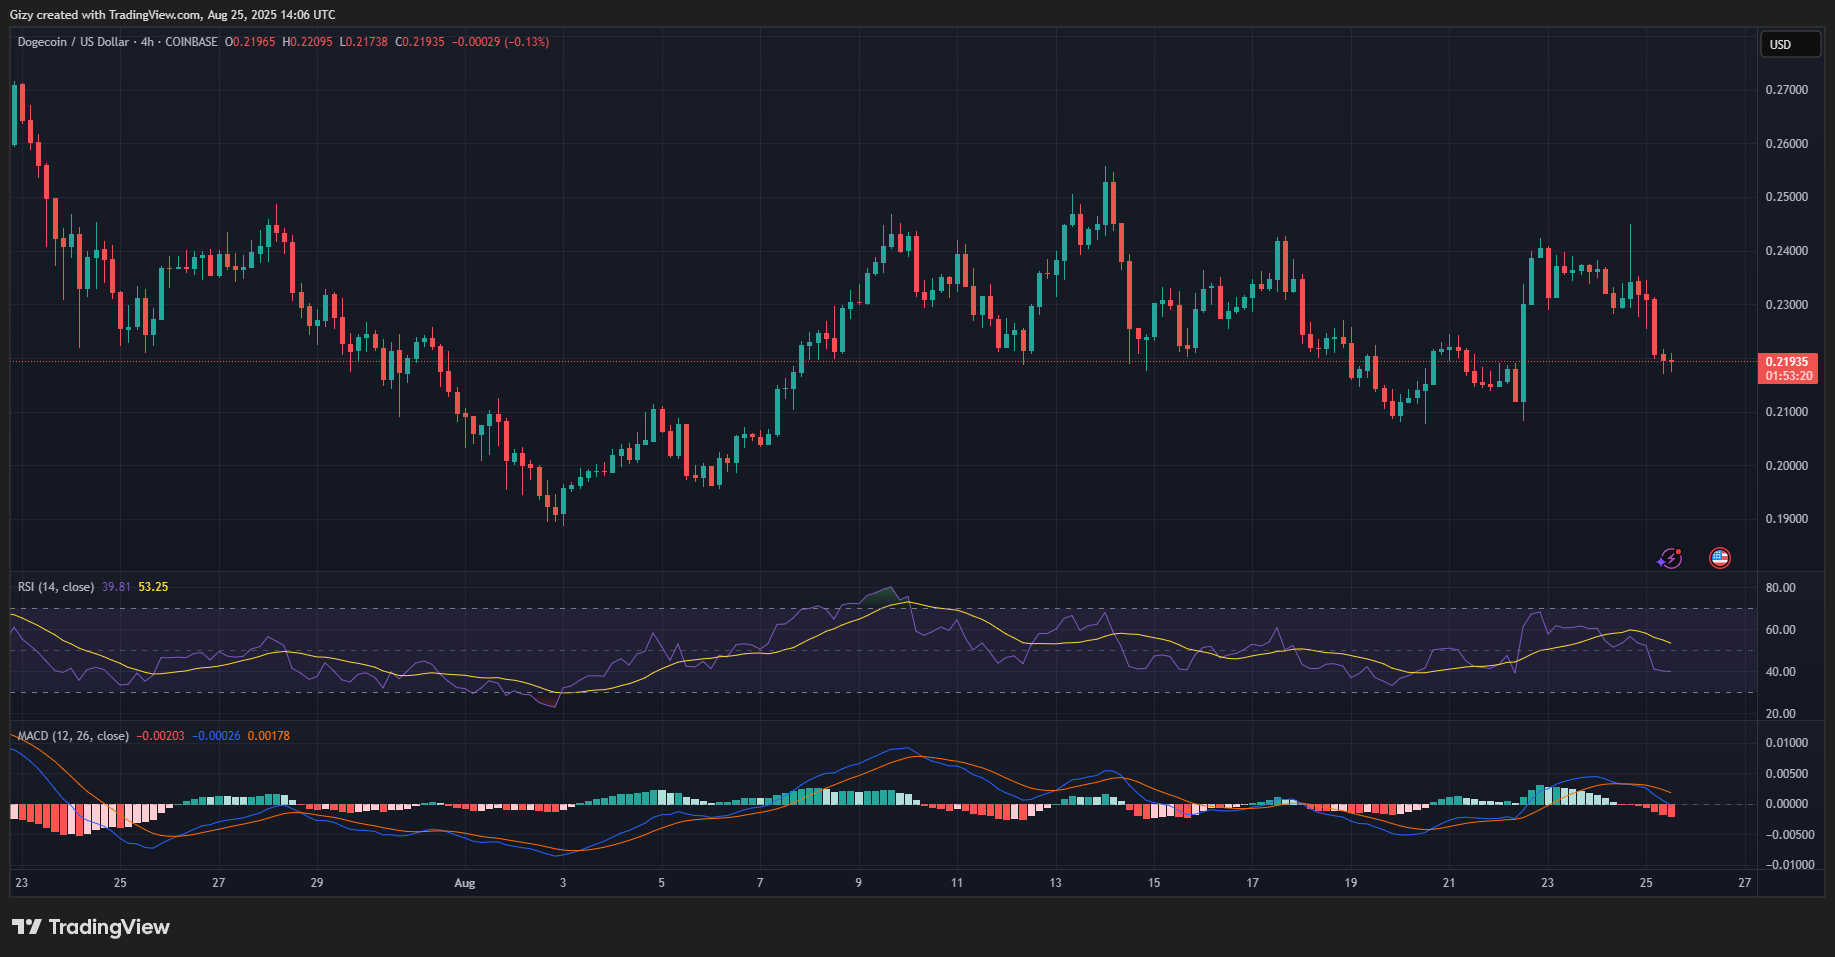
The declining RSI indicates that the bears are still in control as selling continues. Additionally, the growing bars on the MACD histogram suggest that the memecoin may retrace further. If that happens, DOGE will drop below $0.21.
However, it is crucial for the coin to hold $0.216 as it served as support and a launchpad for an attempt at $0.23.
ADA/USD
Like ETH, ADA had a massive retracement in the session starting at 4:00 UTC. It lost over 5% during that period and has since grappled with notable selling pressure.
Although the last two candles on the 4-hour chart show a slowed price descent, the asset is yet to surge. Nonetheless, it is essential to note that the candle rebounded at $0.855. The bulls may stage a buyback at this level, sending prices higher.
However, previous price movement suggests that losing the mark will send the asset as low $0.82.