XRP is down by over 3% in the last 24 hours; however, trading volume is up by 4% as the bulls attempt recovery.
XRP is experiencing a similar trend to the rest of the top 10 cryptocurrencies. Most of them are yet to register any significant increase since the day started.
The global cryptocurrency market cap is seeing a similar trend, dropping to a low of $3.77 trillion, while volume is up by almost 10%. The change in its valuation suggests that investors are becoming increasingly bearish.
Other metrics, like the fear and greed index, are at their lowest in the last seven days. It’s 63, 7 points down from its previous readings last Tuesday. A look at ETFs data indicates a massive decline in inflows. The investment funds registered $220 million on Monday, one of the lowest in the last 30 days.
Nonetheless, a few altcoins are rising. CFX resumed its uptrend after several days of consolidation. It opened trading at $0.194 and surged to a high of $0.27. Although it trades slightly lower, it has gained over 37% since the start of the day.
TRX follows closely behind with a more than 6% increase after it surged from $0.322 to a high of $0.350.
The sluggish movement of assets in the top 10 raises concern about the next price action. Let’s examine some key levels to watch.
BTC/USD
The 4-hour chart reveals a slight increase in selling pressure. Nonetheless, the apex coin grapples with notable selling congestion above $118,500.
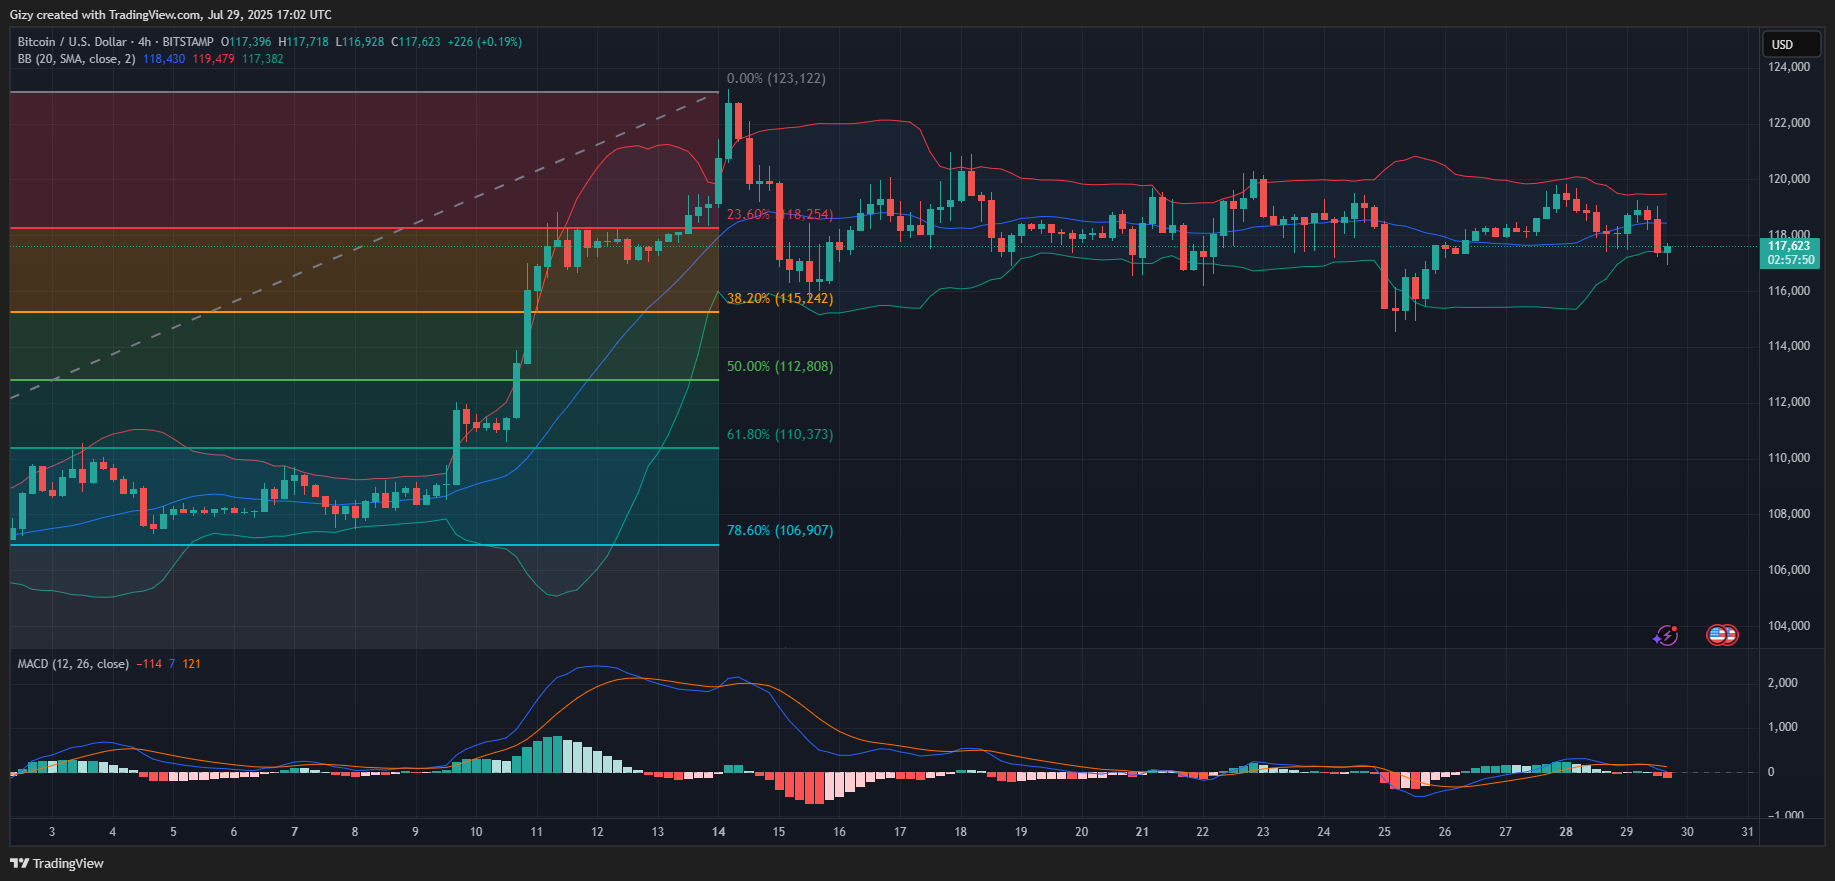
Previous price movement suggests that the asset may not hold on to this level for long, as there’s no notable demand concentration around it. It favours the $117,500 mark as a tougher level.
Other indicators support this prediction. The asset currently trades above the Bollinger middle band and may retrace lower as BTC loses momentum. It may drop to the lower band, which is around the highlighted price.
The moving average convergence divergence prints sell signals at the time of writing. The 12 EMA intercepted the 26 EMA in a bearish crossing. Both indicators point to further downtrends that may see the apex coin drop below $117,500.
ETH/USD
ETH prints a doji on the 1-day chart. It grapples with notable selling congestion around $3,820, and indicators point to an impending decline.
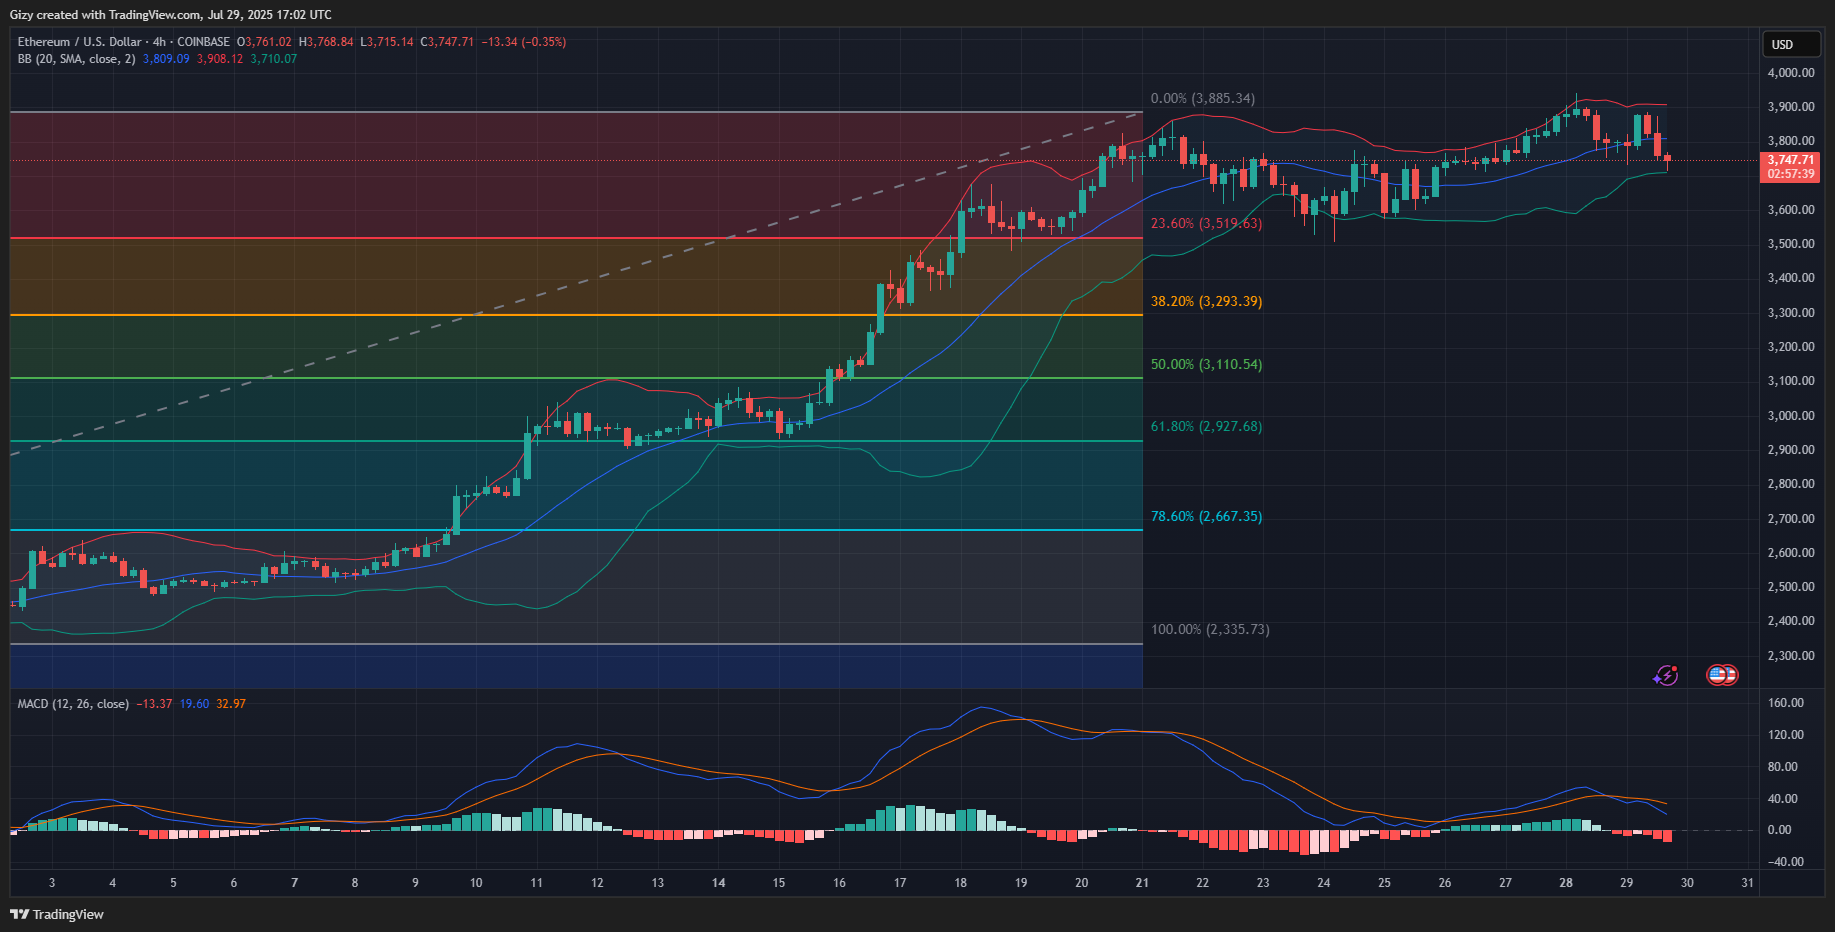
MACD’s 12 EMA is in contact with the 26 EMA. Both metrics have been on the uptrend for most of the last 30 days. A bearish crossing may herald the start of a downtrend.
The 4-hour chart shows the start of the downward trend. The previous candlestick indicates that the asset lost almost 2%. It is worth noting that the altcoin tried breaking above $3,880 twice in the last eight hours.
Additionally, the moving average convergence divergence displayed a negative crossing a few hours ago. It is also worth noting that the asset trended around bollinger’s middle band over the last 24 hours.
Its constant trend around the metric suggests that the bulls are struggling to keep prices above $3,800. However, they failed on several occasions as the asset dropped to a low of $3,731 a few hours ago. Previous price movement suggests an impending retest of $3,700 mark.
XRP/USD
XRP has trended sideways for most of the last 7 days. It maintains trading above Bollinger’s middle band but slipped below it a few hours ago.
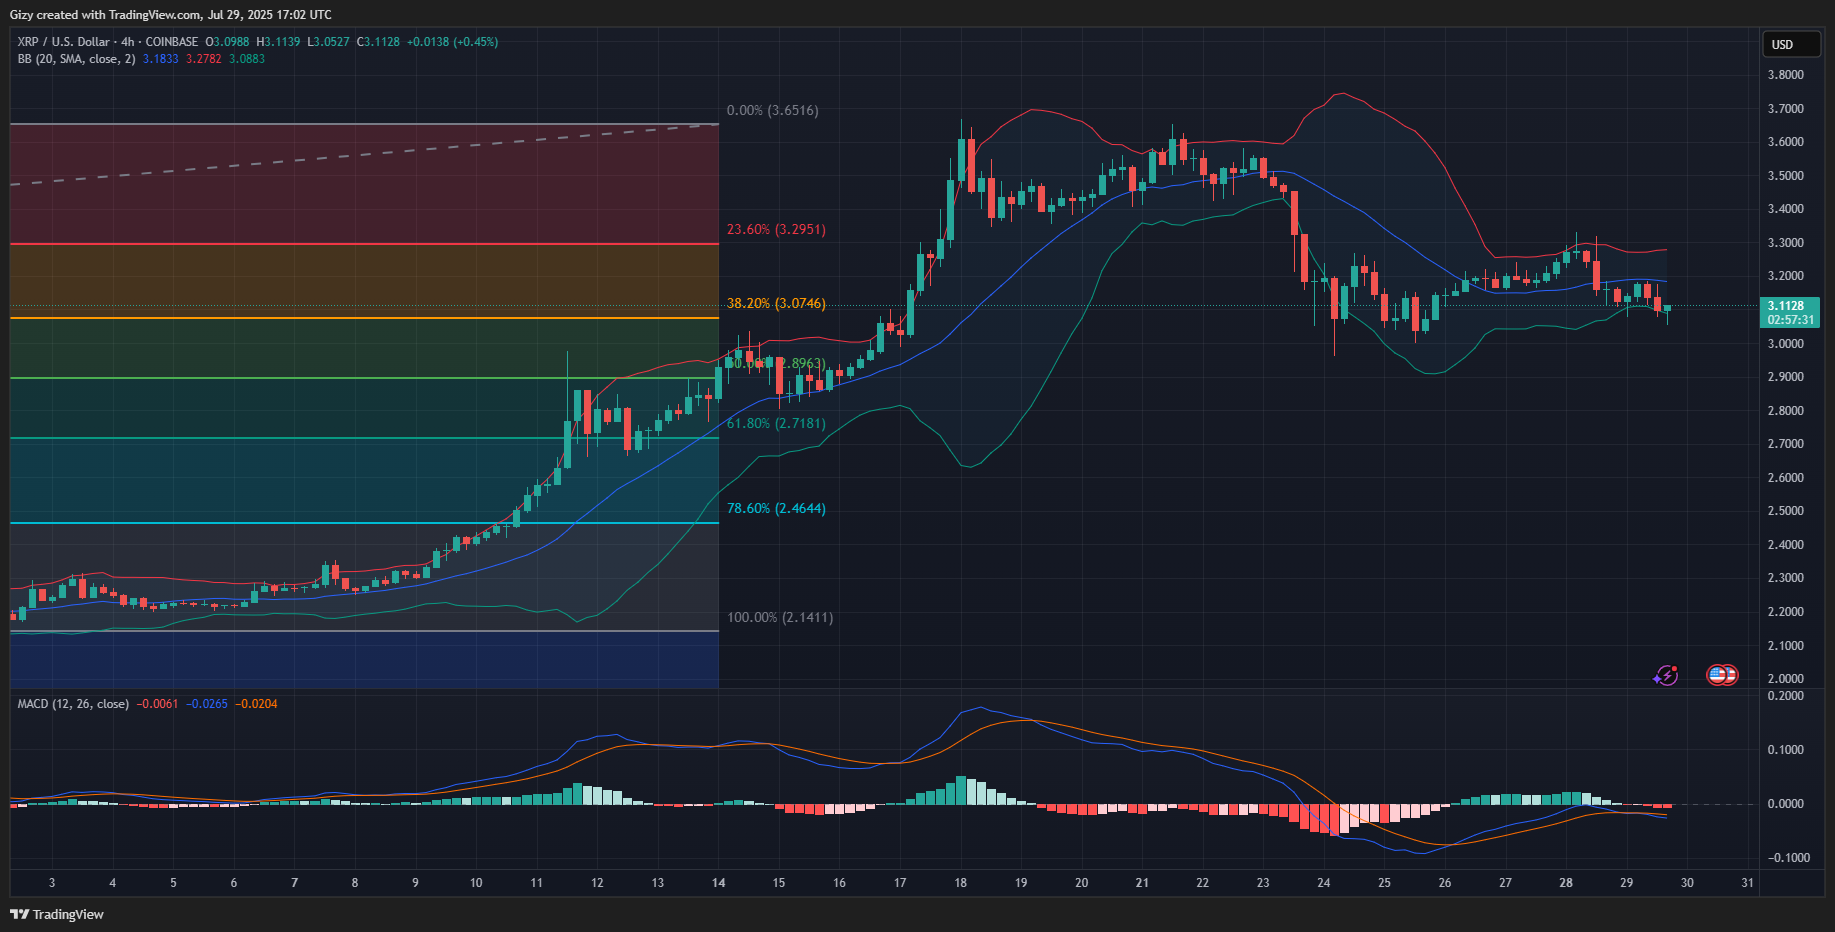
It is worth noting that the altcoin had a bearish divergence on the MACD last week. The indicators continue the sell signal as the 12 EMA and 26 EMA have continued downwards, indicating that the bears are edging in the struggle for dominance.
If trading conditions worsen, the asset may drop below $3. Nonetheless, the Fibonacci retracement levels point to notable demand concentration around the 50% mark at $2.91.
BNB/USD
BNB broke above its Bollinger band on Monday but retraced and lost over 2%. It currently trades below the upper band at the time of writing, but has registered no significant price change since the start of the day. The asset prints a doji as a result.
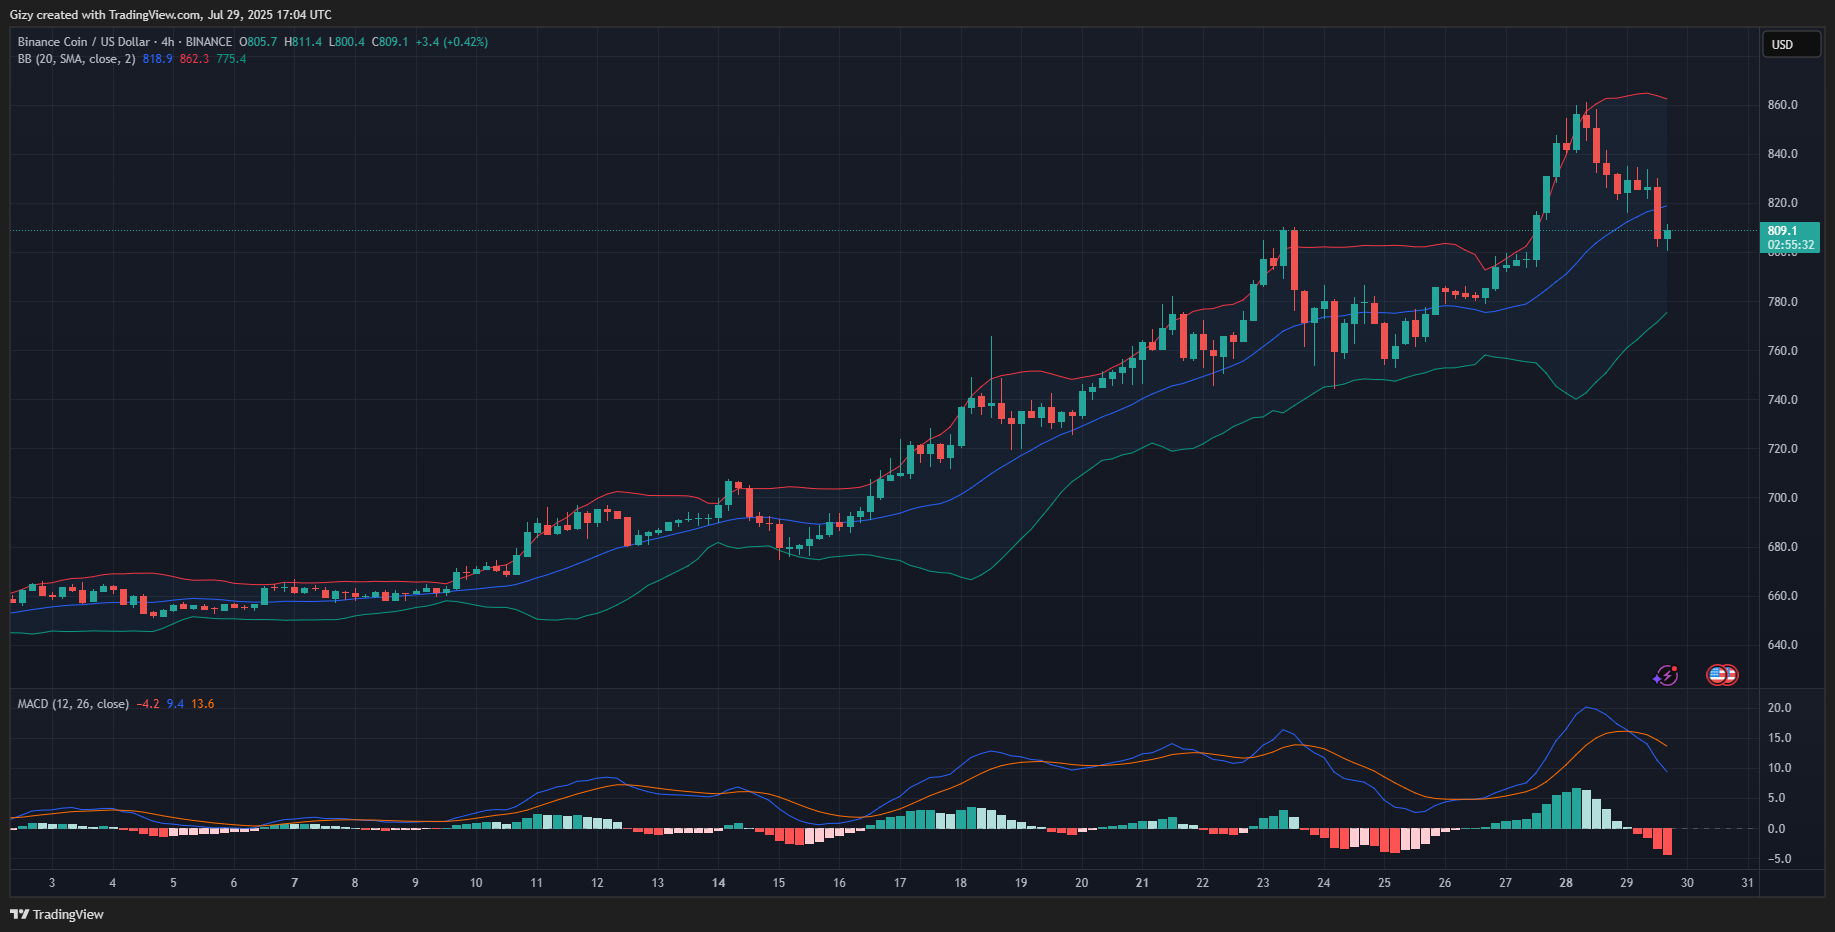
However, the 4-hour chart reveals that the altcoin traded sideways for most of the last 24 hours. It edges closer to testing Bollinger’s SMA. Previous price movement suggests that it may dip below the metric.
MACD supports this prediction as it displayed a bearish divergence a few hours ago. Previous price movement suggests that if the bulls fail to hold prices above $820, BNB could slip below $800.
SOL/USD
Like XRP, SOL registered a notable decline on Monday. It lost almost 3% as it retraced from $195 to $188. The asset grapples with notable selling pressure as it struggles to break above $185.
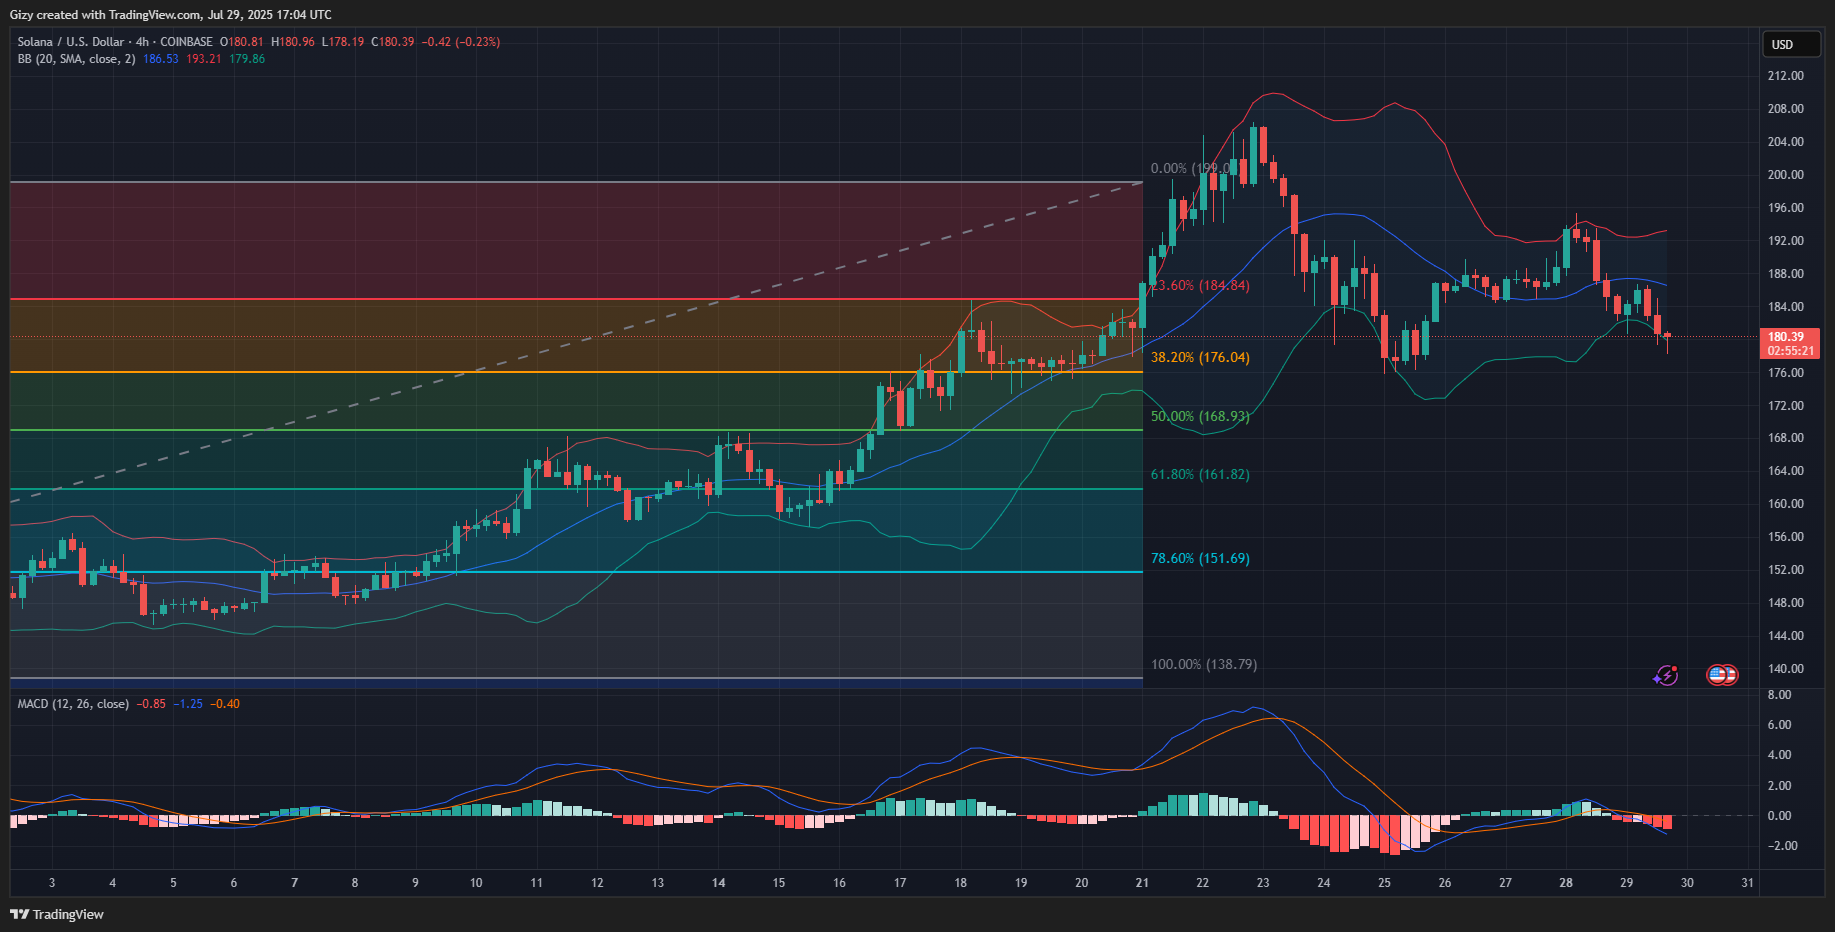
However, the 4-hour chart shows an impending uptick. SOL trades closer to Bollinger’s lower band and slipped below it a few hours ago. A slip below this indicator typically suggests the end of a downtrend.
If this metric holds, the asset will surge, breaking above the middle band at $187. It may continue upwards, edging closer to $192.
DOGE/USD
Data from CoinMarketCap indicates a 4% increase in trading volume. This increase reflects on prices as DOGE is up by almost 2%. However, its current figure is less than half of the losses incurred on Monday.
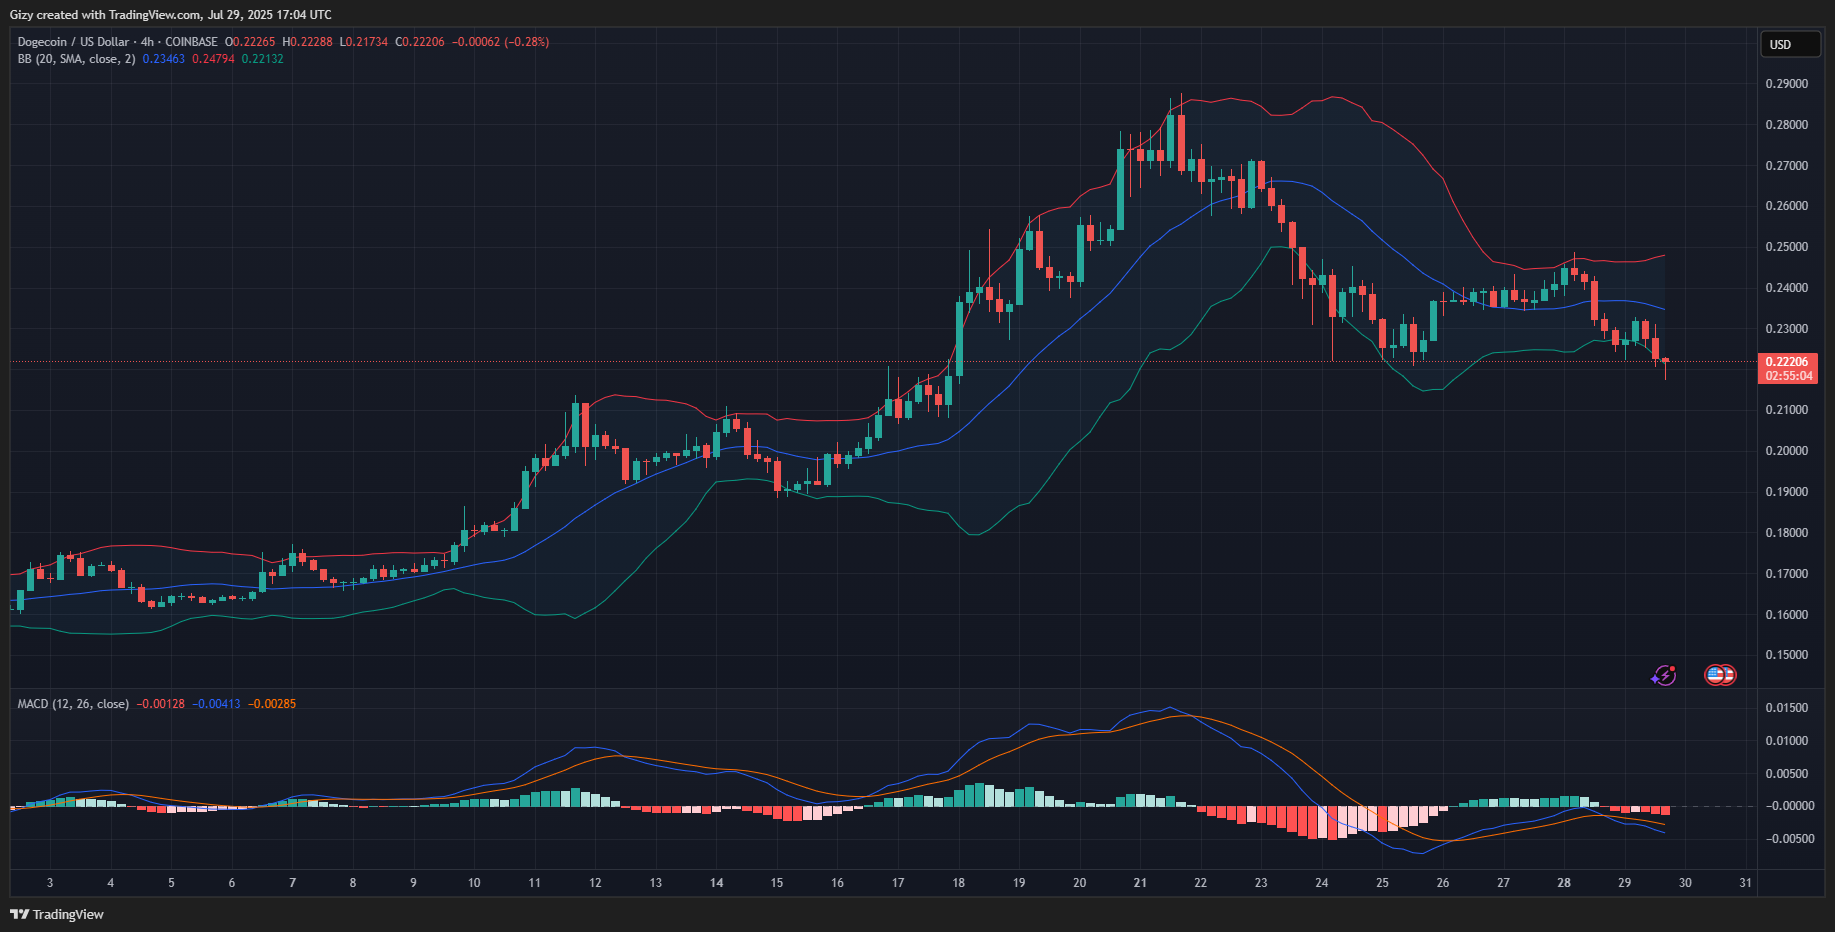
Like XRP, the 4-hour chart shows that the coin is due for a significant upward move. The MACD prints buy signals at the time of writing as the 12 EMA and 26 EMA approach a bullish divergence.
The asset will look to break above $0.235. Previous price movement suggests that this mark might be a launchpad for an attempt at $0.25.
ADA/USD
The Bollinger Bands show ADA trading above its SMA following its almost 5% drop on Monday. The coin prints one of the smallest candles in the last 7 days as it is yet to register any significant price move in the previous 14 hours.
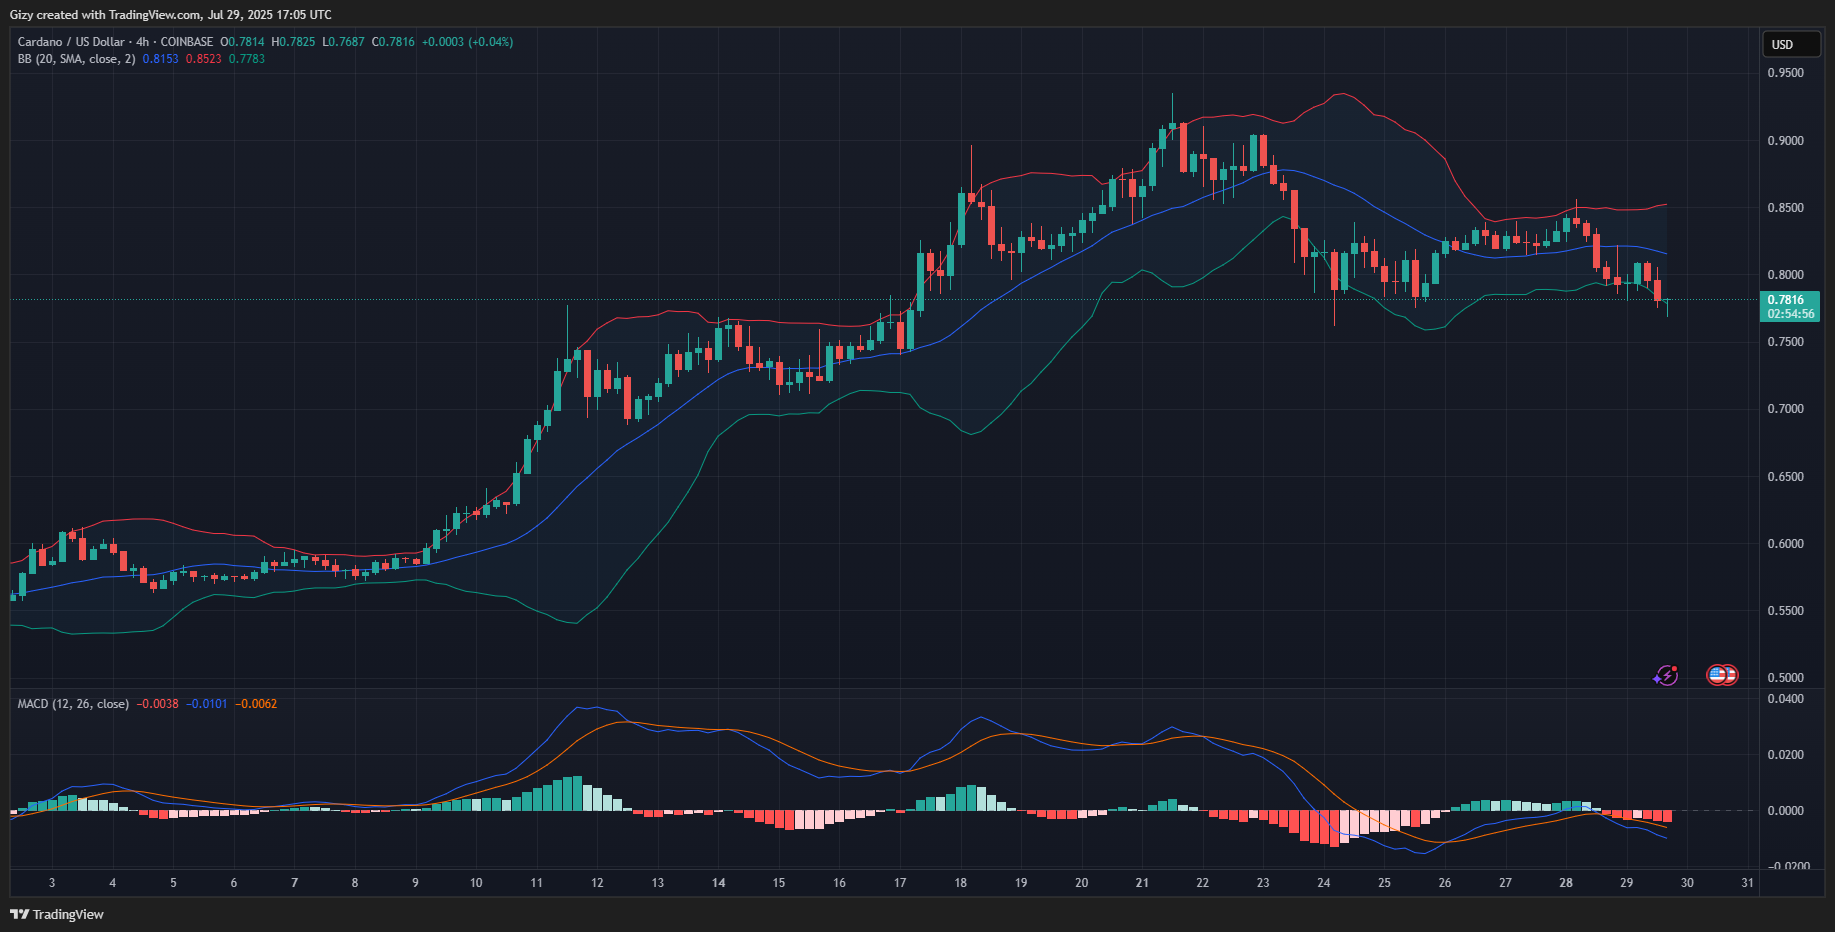
However, like XRP, it trades closer to Bollinger’s lower band on the 4-hour timeframe. The chart reveals several failed attempts at breaking about $0.81. Nonetheless, the indicator points to a high likelihood of a surge to $0.82.
Conversely, MACD is yet to respond to the slight increase in buying pressure, which may indicate bearish presence. The coin risk drops below $0.78 if trading conditions worsen.