BTC is gradually taking a back seat following its previous run. The apex coin had one of its biggest surges last week, attaining one new level after another.
However, Bitcoin trades notably lower than its previous high. It grapples with massive demand concentration on Tuesday, causing prices to plummet.
The crypto market is moving past the previous day’s selloffs, with several assets resuming their uptrend. Interestingly, key metrics such as the fear and greed index have yet to reflect the latest improvement in traders’ psychology.
The indicator is at 68, two points down from the previous day’s reading. Volume has yet to return as buying and selling is down by over 25% at the time of writing.
Nonetheless, fundamentals are positive, as the United States has announced plans to move forward with several bills that would provide more structure for crypto regulation. While the House initially voted against it, some members later changed their minds.
Institutional accumulation continues as several firms are massively stacking up BTC and ETH. The trend will continue as other companies see the benefits of holding these cryptocurrencies.
Nonetheless, traders remain uncertain about how prices will unfold in the coming days. Let’s examine some key levels.
BTC/USD
BTC had its biggest decline on Tuesday, plummeting to a low of $115,729. It opened trading at $119,862 and has yet to return to this valuation.
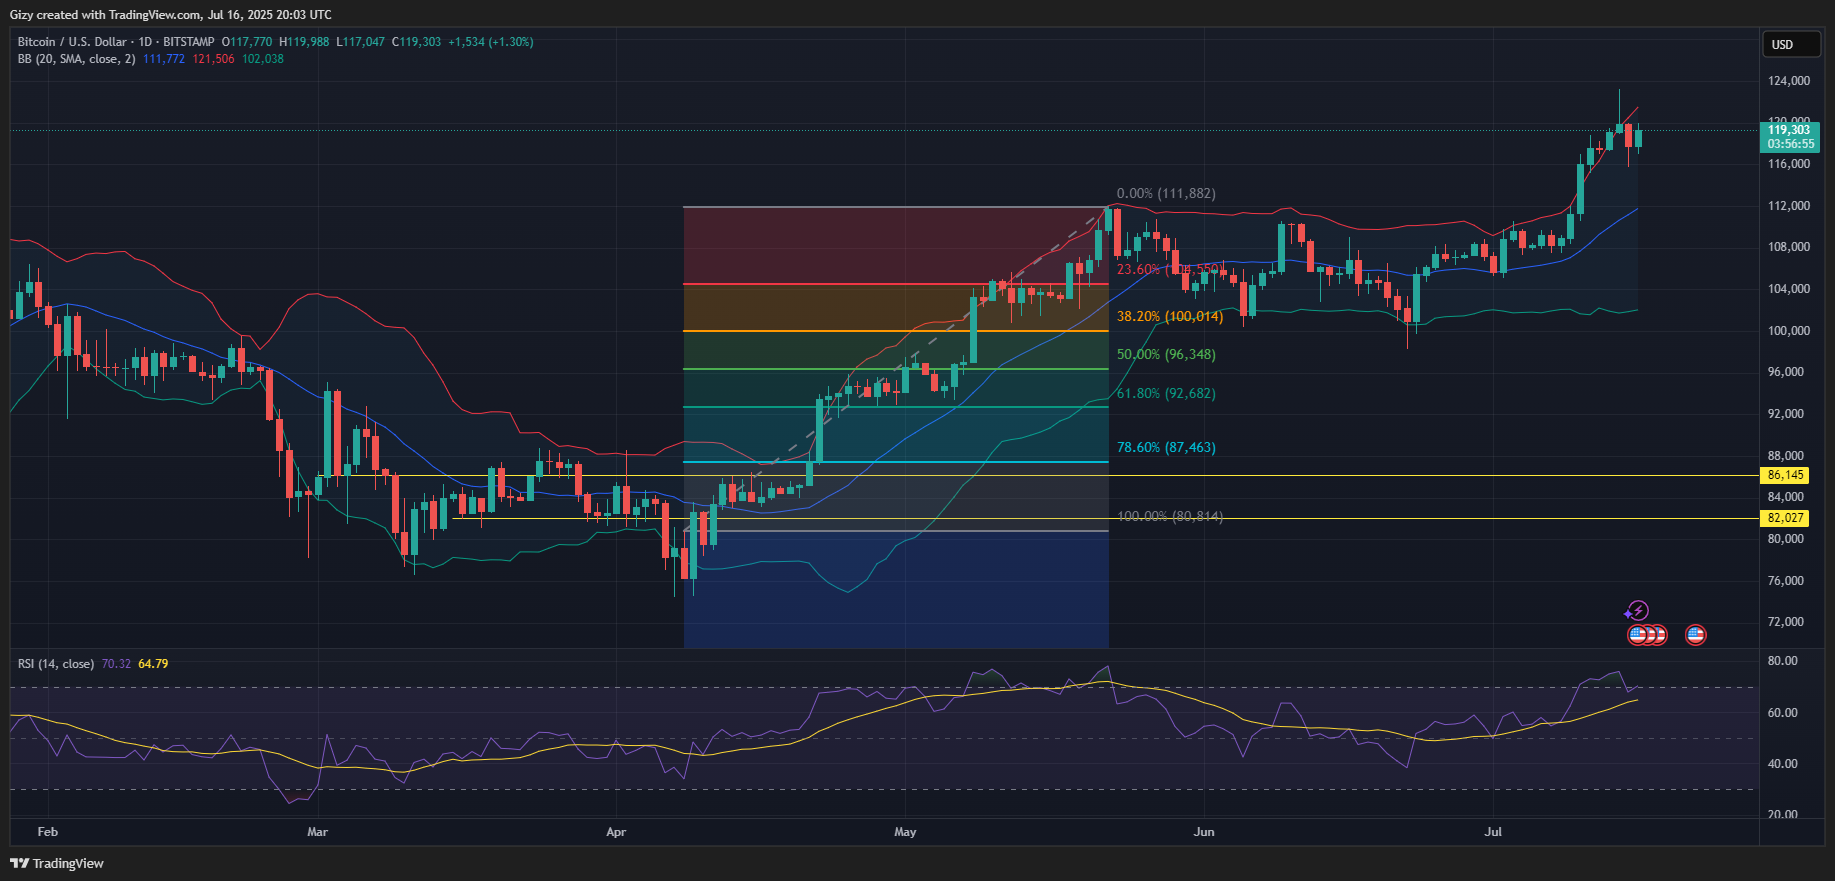
Traders worry that the apex coin may continue heading downwards following its recent failure. Nonetheless, it peaked at $119,310 a few hours ago. It attained the mark after its slight retracement.
The bollinger bands hint at further declines ahead. Bitcoin broke above the upper band last week and reached its highest point on Monday while trading above the metric. It returned within the band on Tuesday. However, previous price action suggests that BTC will retrace further.
Nonetheless, the previous day’s low indicates growing demand concentration around $115k. The bull must defend this mark, as a flip will send the coin to $ 112,000.
Declining trading volume may indicate a reduction in investor interest. BTC is experiencing a 45% decline in this metric, contributing to the growing concern about further downtrends.
ETH/USD
Ethereum has been on the rise for more than a week. The 1-day chart shows no notable decline this week. Nonetheless, the altcoin dropped to a low of $2,933 on Tuesday before rebounding and ending the session with gains exceeding 4%.
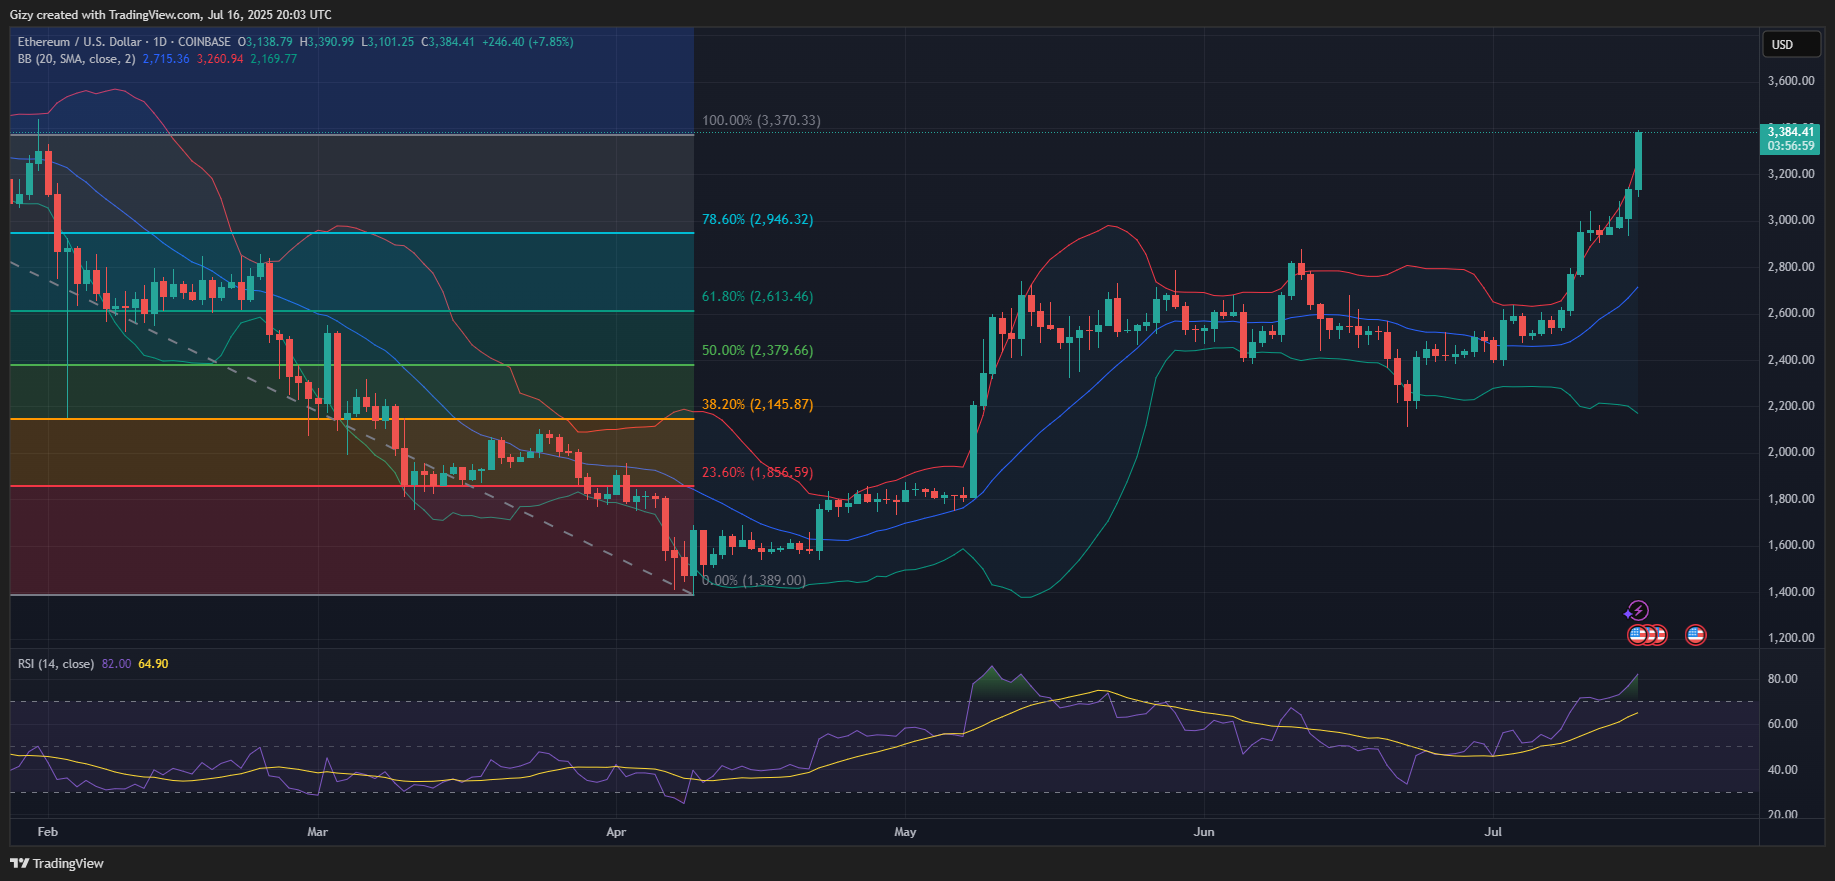
The largest altcoin continued its uptrend on Wednesday, surging to its highest value since January. It trades at $3,298 at the time of writing and shows no signs of slowing down.
Indicators on the chart are largely positive, with the average directional index surging higher. The moving average convergence divergence prints a similar signal.
Nonetheless, the Fibonacci retracement levels indicate that the coin is trading above the 78% mark. It edges closer to breaking above the 100% fib level. Breaking above the level may seal a retest of $3,400.
However, the relative strength index is at its highest mark since May. Currently at 80, the altcoin is overbought, increasing the likelihood of a retracement.
XRP/USD
XRP struggled to hold $3 since flipping it. It saw significant selling pressure during the previous intraday session, dipping to a low of $2.80. However, it recovered, closing with a little loss.
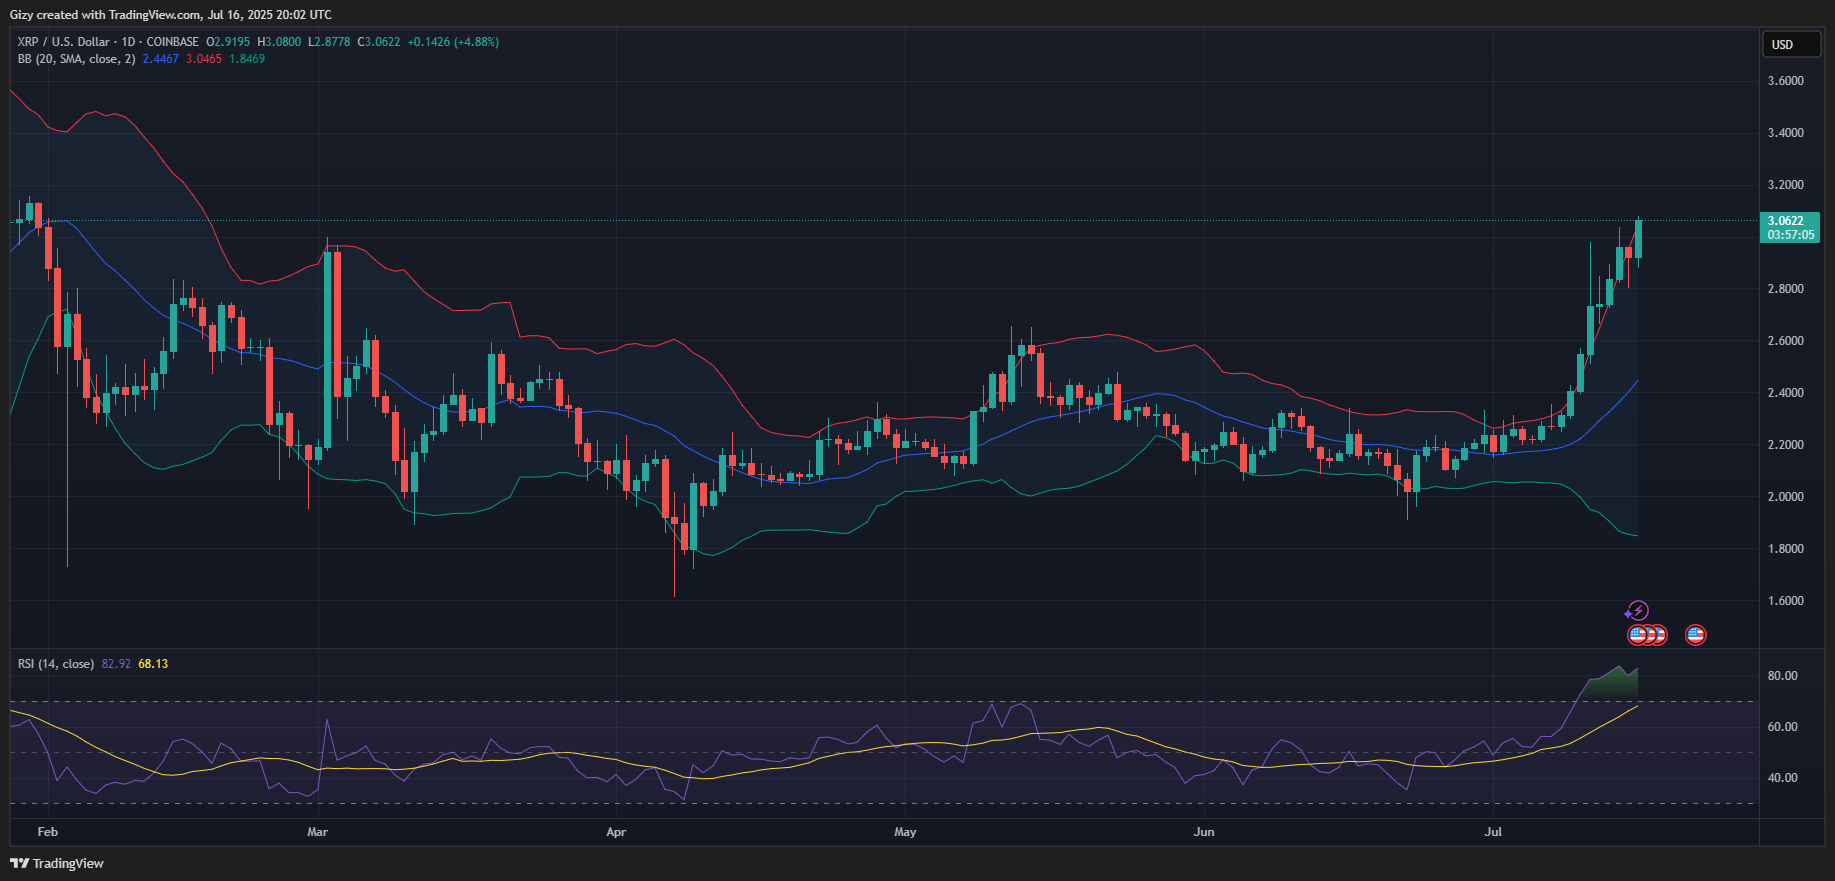
Like BTC, the altcoin had a slight decline earlier on Wednesday. It rebounded, surging to its highest mark since January.
The third-largest cryptocurrency is up by over 3%. It trades at $3 after peaking a little higher. Nonetheless, it broke above the bollinger bands a few hours ago. The 1-day chart shows the altcoin traded above this mark for most of the last seven days.
It may see further decline as it’s currently overbought. Trading action over the last three days points to growing demand concentration around $2.80.
BNB/USD
Volatility returns to the market after several days of range-bound movement. BNB dropped to a low of $674 on Tuesday before rebounding.
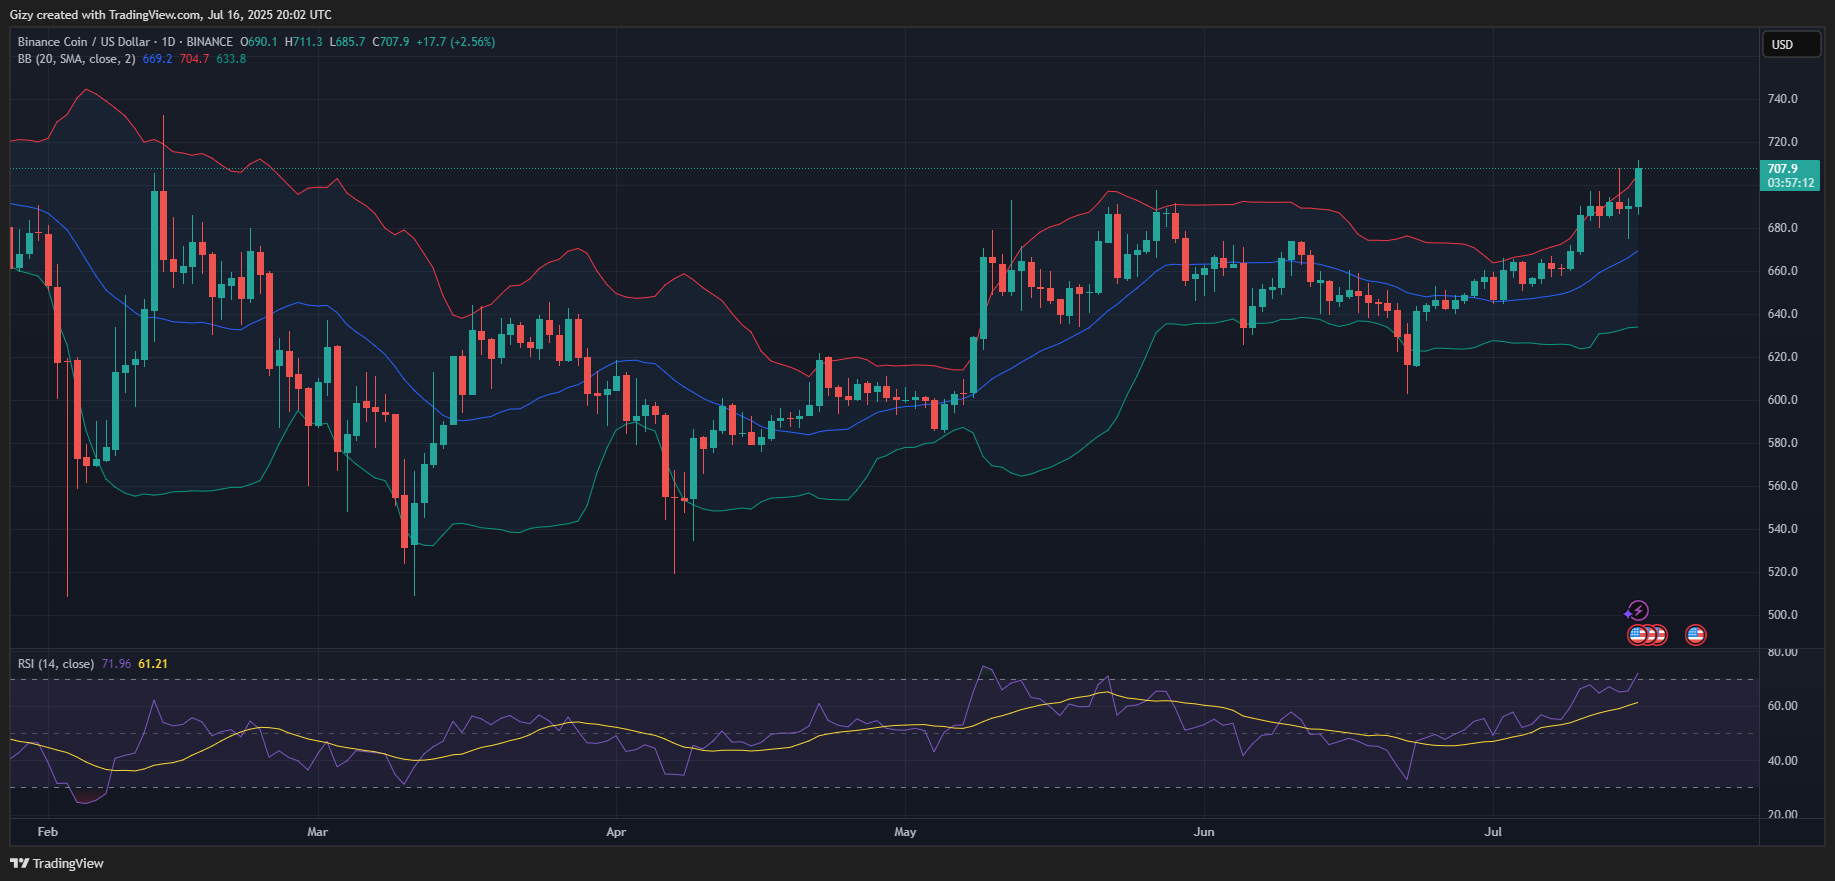
The altcoin broke above $700, reaching a peak of $711 on Wednesday. Up by almost 3%, traders are anticipating more. However, the asset broke above the bollinger bands, which may indicate an impending trend reversal.
Previous price movements suggest a potential retracement to $680. However, failure to defend the highlighted mark will result in a drop to $670. Readings from the relative strength index indicate that the asset is overbought, which increases the likelihood of a downtrend.
SOL/USD
SOL is having its biggest increase in almost a month. It surged to a high of $174 after starting the day at $164. Up by nearly 6%, fears of retracement are reaching new levels.
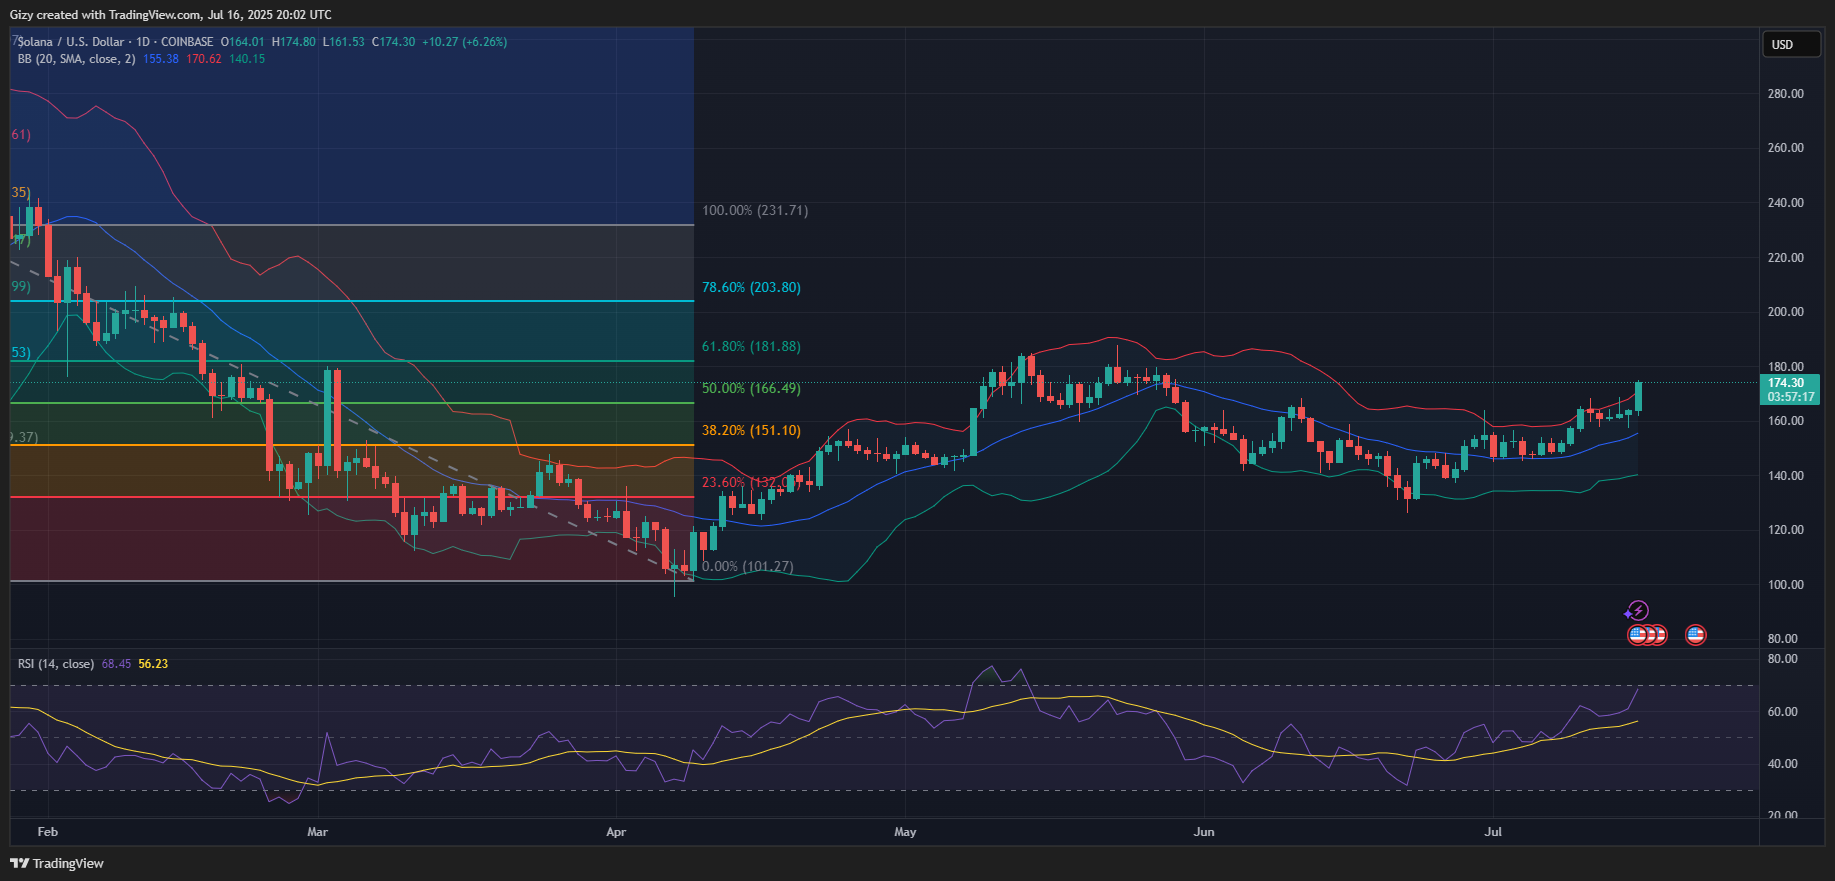
Nonetheless, Wednesday’s trading action suggests that the bulls shrugged off Tuesday’s decline. The relative strength index points to room for further increases. Previous price movements point to an impending attempt at $180.
On the other hand, the bollinger bands suggest an impending correction. The altcoin risks slipping $170 if it loses momentum. SOL may retrace to $160 before rebounding.
DOGE/USD
DOGE broke above the bollinger bands on Monday, peaking at $0.21. However, it retraced and ended the session with slight losses.
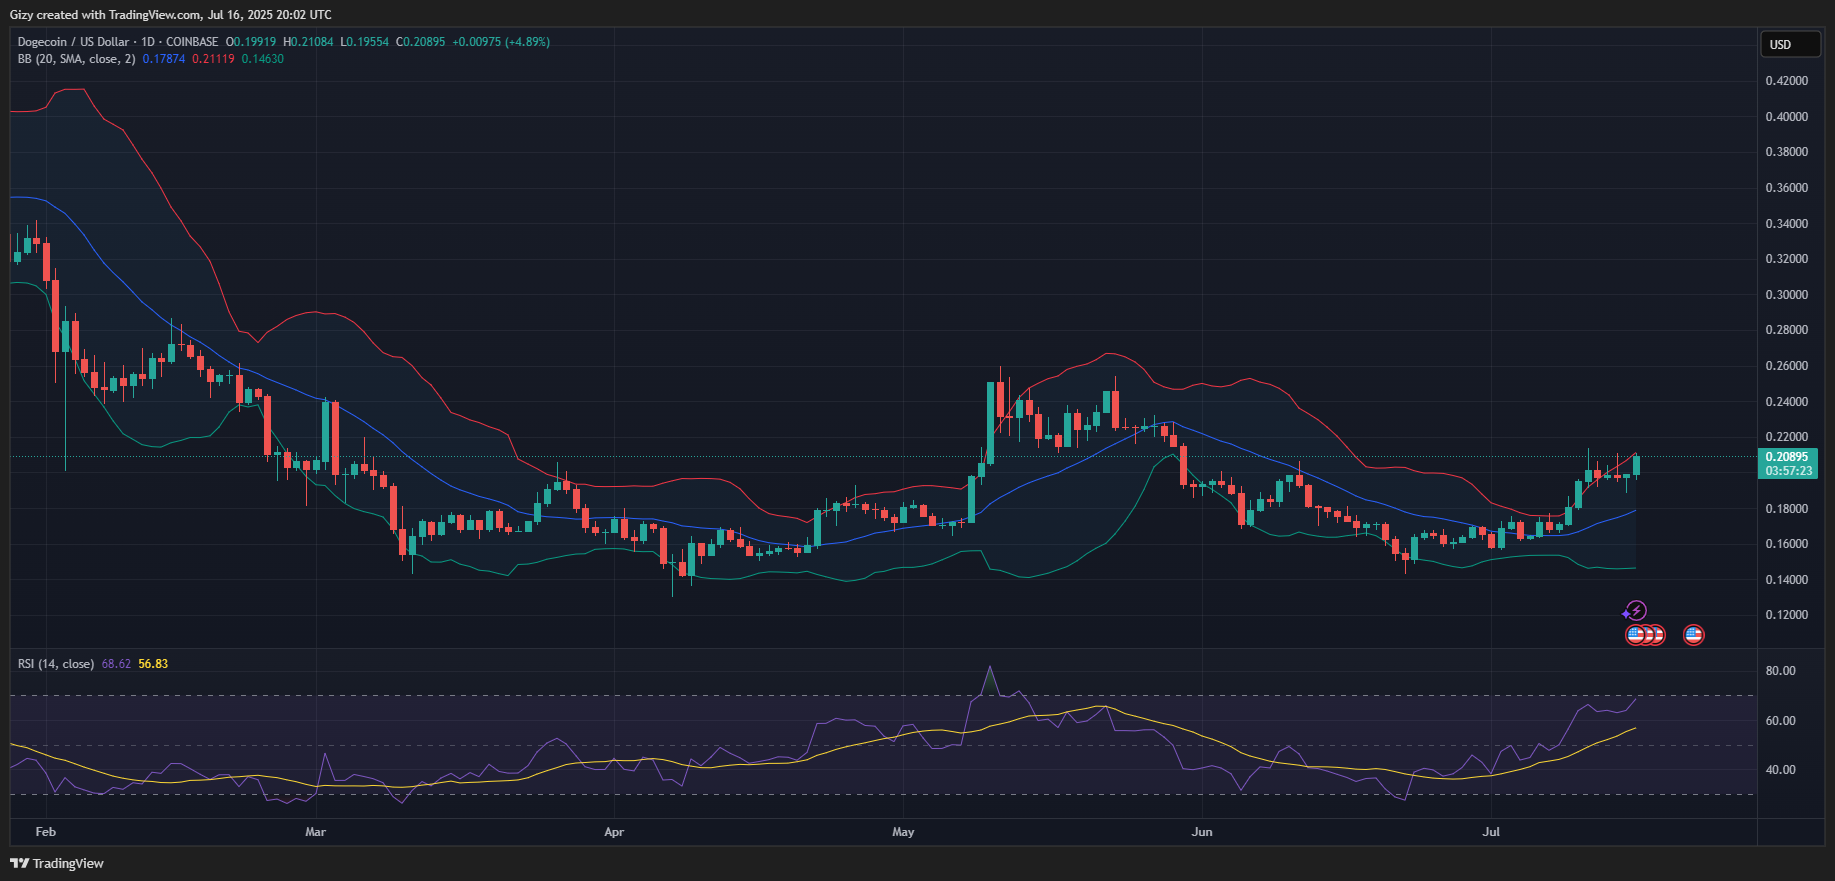
The selling pressure worsened on Tuesday, causing prices to plummet as low as $0.188 before rebounding. Trading action at the time of writing indicates that traders shrugged off the previous day’s selloffs.
Dogecoin returned to Monday’s high but struggles to maintain its upward momentum. The asset is experiencing slight selling pressure due to rejections around the highlighted mark.
The current attempt will be DOGE’s third attempt at advancing above $0.20. However, it has yet to record any notable success. Its constant failure to decisively break the mark may indicate growing selling congestion that may translate into massive corrections.
ADA/USD
A closer look at the 1-day chart shows that Cardano is gradually losing momentum. The unfolding momentum may indicate a gradual drop in trading volume. This may be the case, as data from CoinMarketCap reveals that the asset is experiencing an 8% drop in buying and selling pressure.
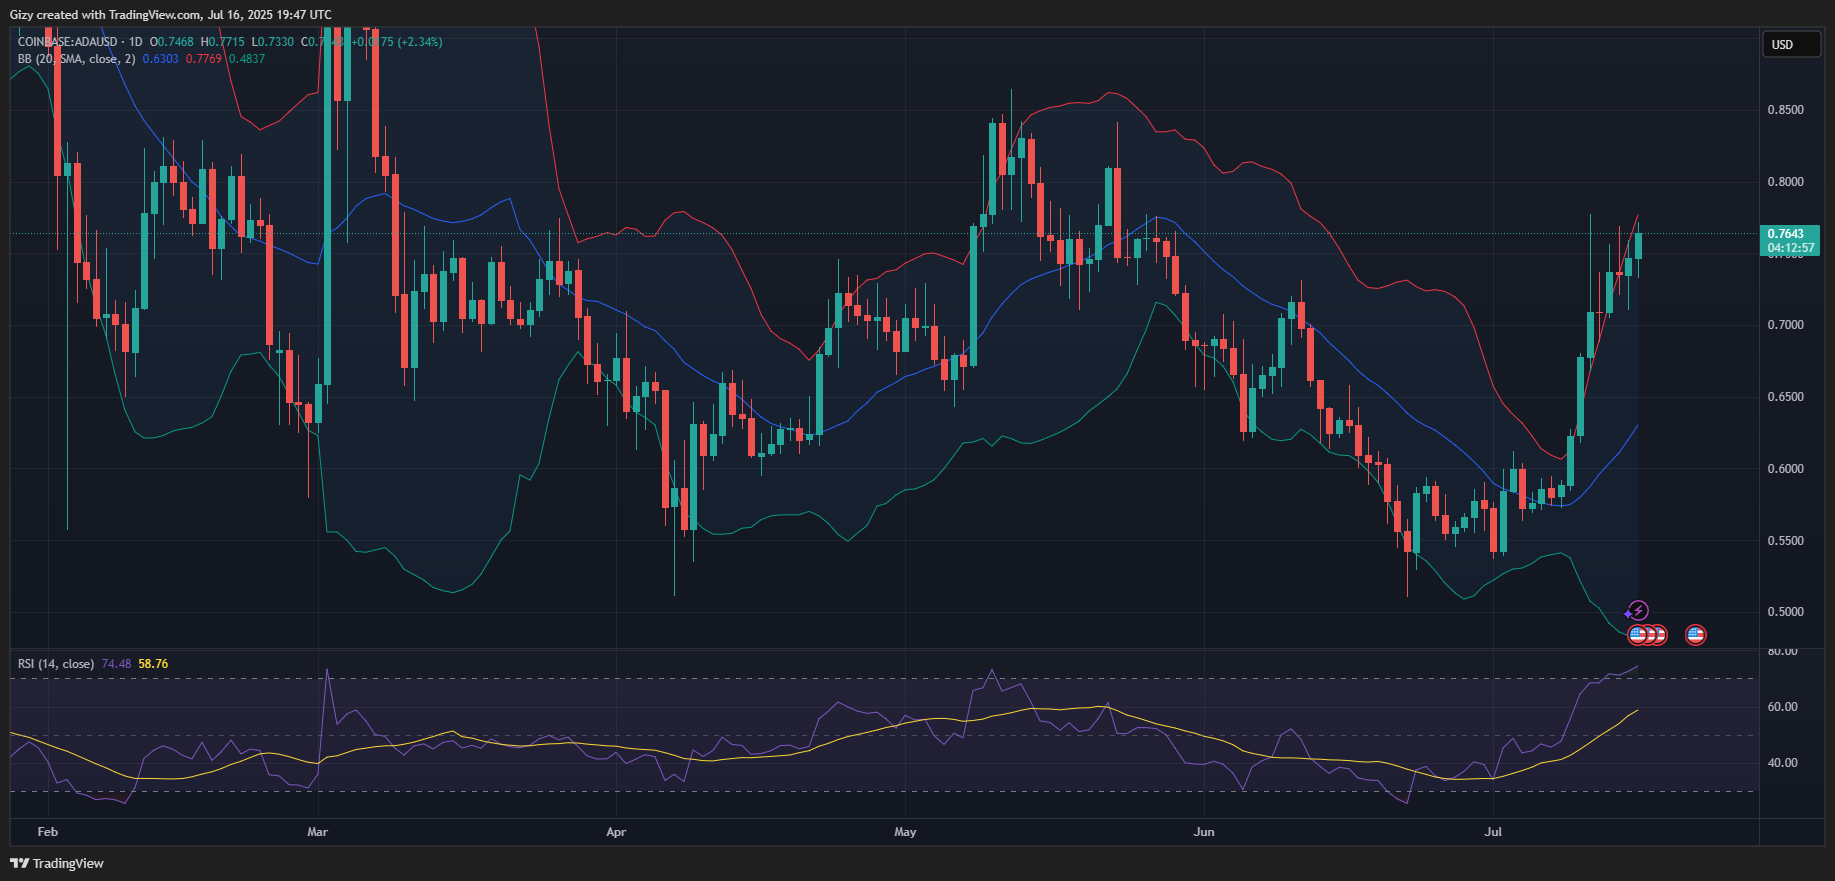
A drop in interaction may mean that investors are gradually becoming exhausted, and a trend reversal may be imminent. The bulls must defend the $0.70 or risk a decline to $0.65.