
BNB struggled to maintain its parabolic run over the last six days, succumbing to several waves of selloffs.
It had joined the rest of the market in the prevailing bearish trend and had yet to achieve a significant increase. Questions arise about whether the uptrend is over, and a previous analysis concluded that, based on available data, BNB may have ended its run.
Nonetheless, the global cryptocurrency market cap took a plunge this week, retracing from $3.96 trillion to $3.66 trillion. Although it trades slightly higher than its low, the reduced trading volume seals the red candle, marking its second consecutive red candle.
However, the sentiment across the crypto market has dropped to its lowest levels in the last 30 days. Investors were optimistic but lost confidence following Monday’s price action. The bullish sentiment slowly disappeared, and the fear and greed index dropped to 32, the lowest reading since April.
The dwindling bullish confidence is reflected in nearly every cryptocurrency. As a result, a comb through the 100s reveals fewer than 10 cryptocurrencies with notable increases.
A brief overview of the market indicates that the global cryptocurrency market has been predominantly bearish over the last six days. Let’s examine how some assets in the top 10 performed during this period.
BTC/USD
Bitcoin is currently experiencing slight volatility as trading volume plummets. However, it threatens to erase Friday’s gains if current conditions persist.
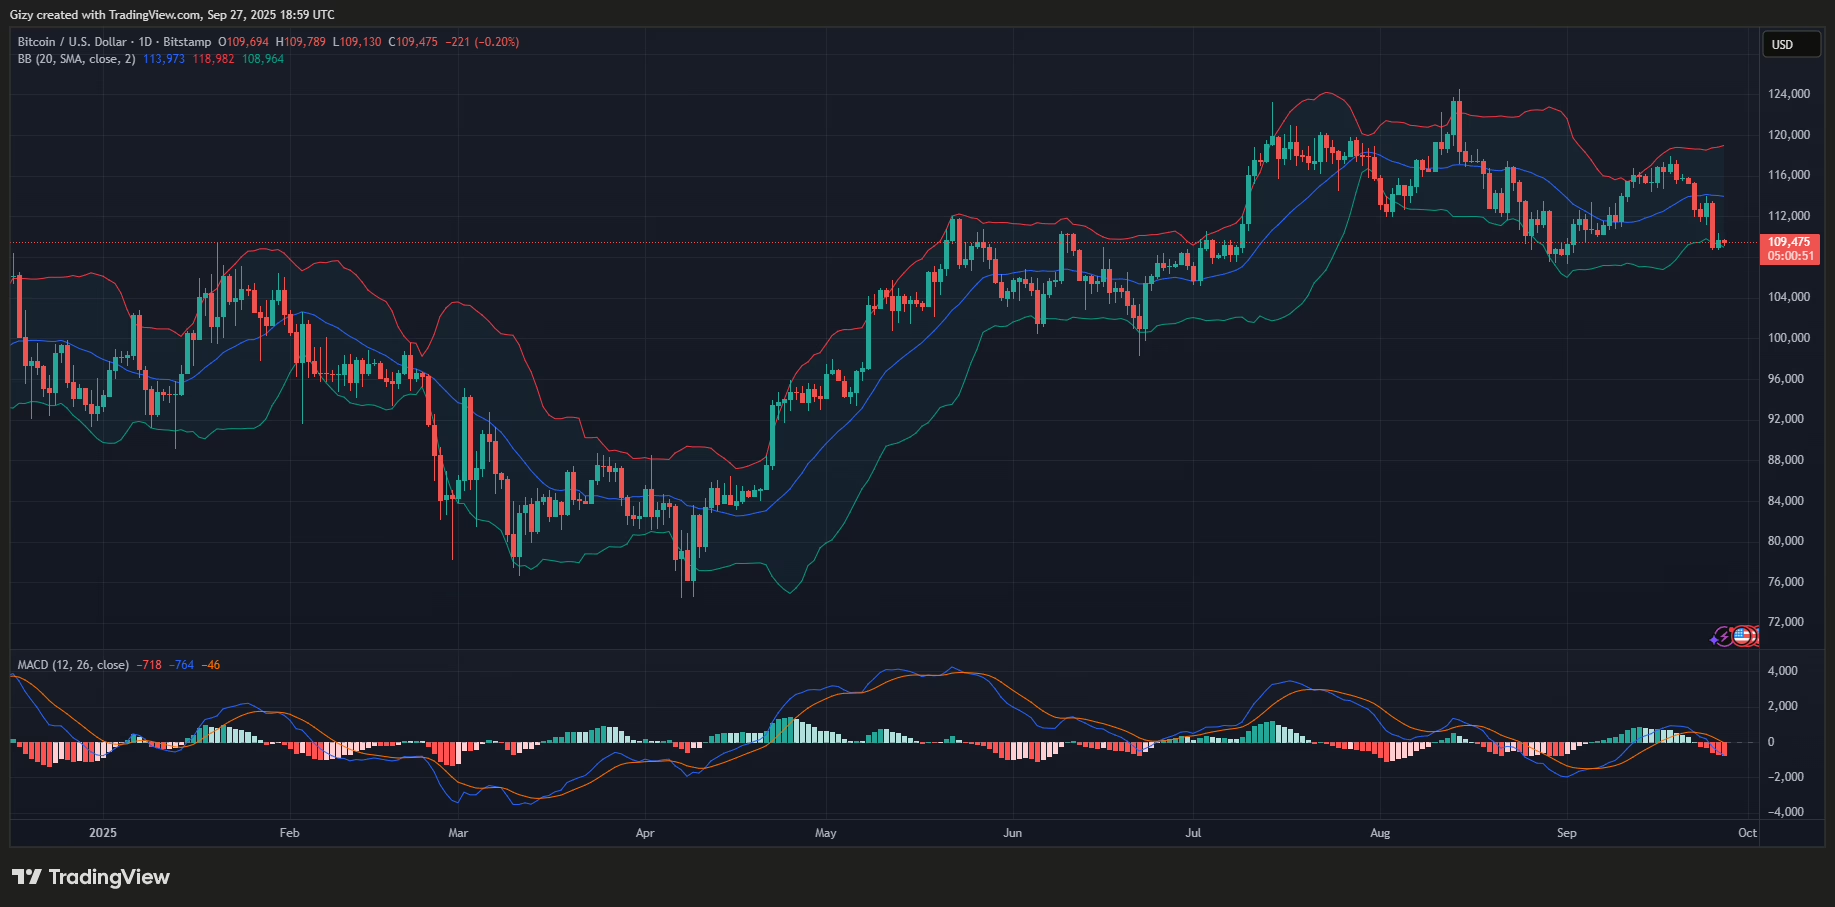
The 1-day chart shows that the apex coin registered three losses of the last five days, with the most recent happening on Thursday. It lost almost 4% during this period, dropping to a low of $108,652 before rebounding.
BTC is heading for a 5% decline on the weekly scale, and investors are expecting the downtrend to end soon. However, it remains to be seen if this wish will come true. Nonetheless, the apex coin appears to be forming a demand level at $108,600, rebounding above it twice in the last three days.
Aside from the new support, the 1-day chart reveals that the largest cryptocurrency retraced below the bollinger bands on Thursday. It has since rebounded after its brief slip and trades slightly above the lower band.
The moving average convergence divergence had a bearish crossover on Monday. The divergence between the 12- and 26-day EMAs is reaching levels similar to those seen during the previous crossover. However, the metric prints no new green signal as the histogram displays a longer red candle.
ETH/USD
Ethereum is experiencing a slight pullback after Friday’s increase. It reclaimed the $4k mark, peaking at $4,071 during the previous intraday session.
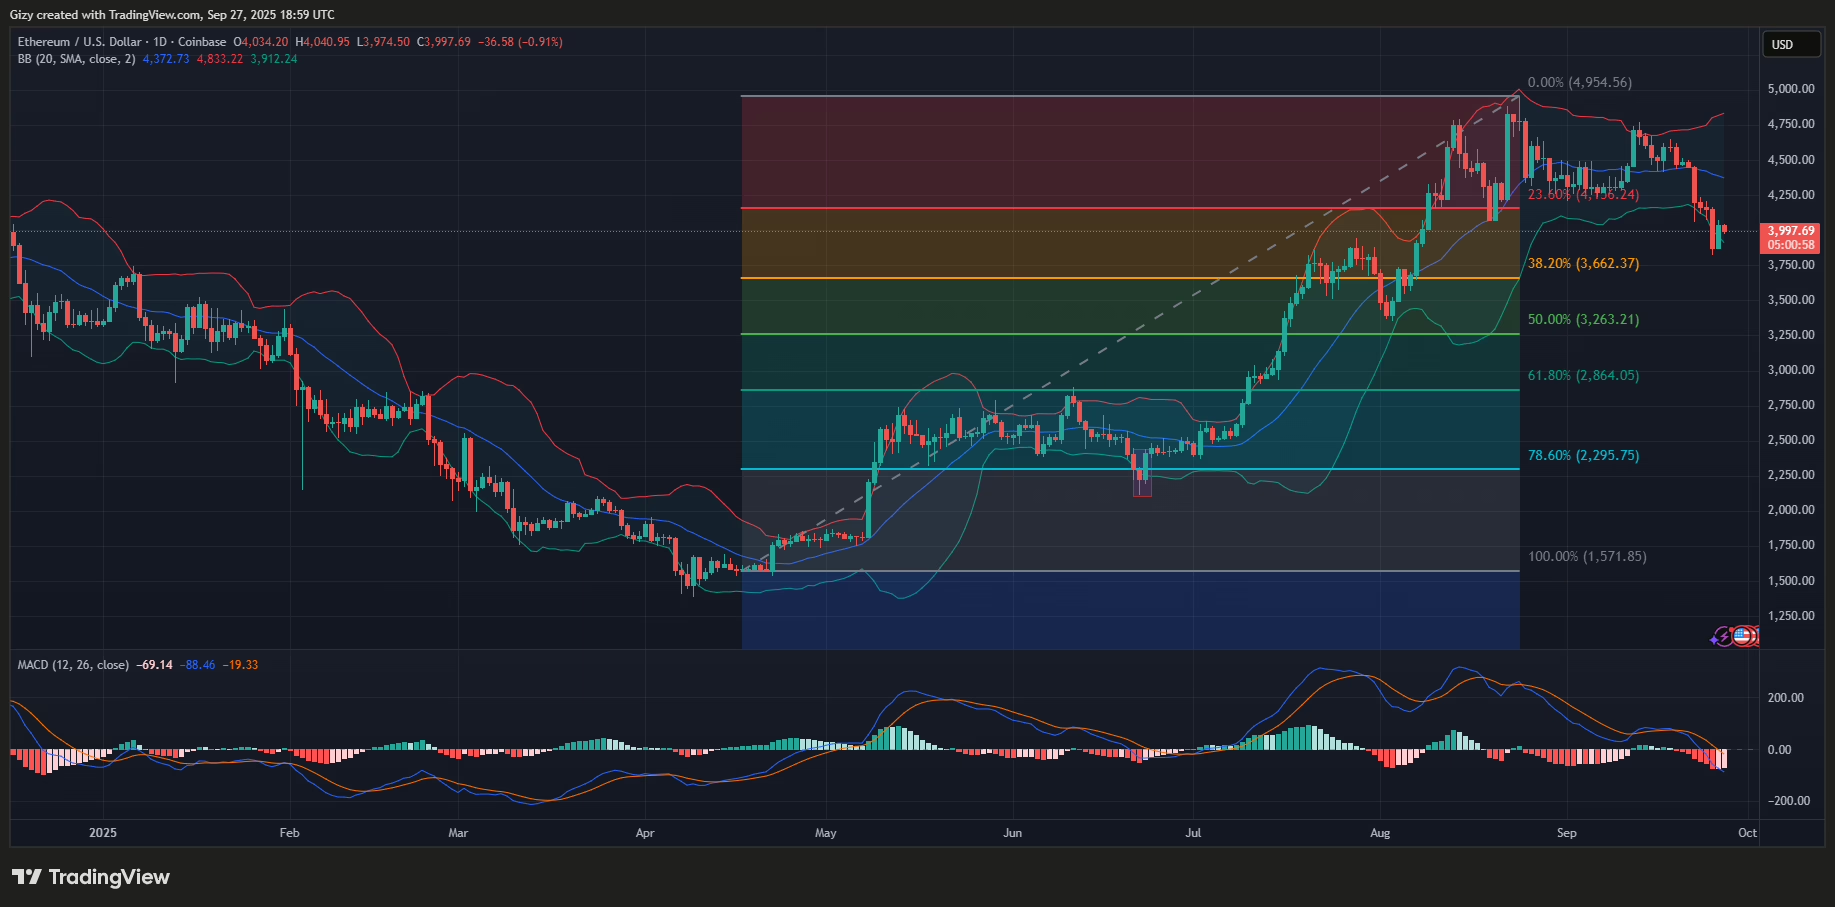
However, the altcoin appears to have resumed its decline following Thursday’s price action. It dropped from $4,153 to $3,825, representing a loss of almost 7%. The 1-day chart reveals that the massive decline is not an incident, as the coin had a similar decline on Monday. Interestingly, Friday was the only green day this week.
Nonetheless, indicators remain largely negative following price action in the last five days. For example, MACD had a bearish divergence the previous week and continued the trend. The histogram shows that the coin has experienced massive selloffs, resulting in some of its longest candles on the chart.
The bollinger bands show the ETH trading slightly above the lower band following its previous incursion below it. The metric failed to rebound at the mark but formed a new demand level at $3,900.
XRP/USD
XRP prints a doji at the time of writing as it experiences the normal low volatility during the weekend. Nonetheless, some traders may consider the latest trend as an extension of Friday’s price action. The asset retraced to a low of $2.70 during the previous intraday session but rebounded, ending with notable gains.
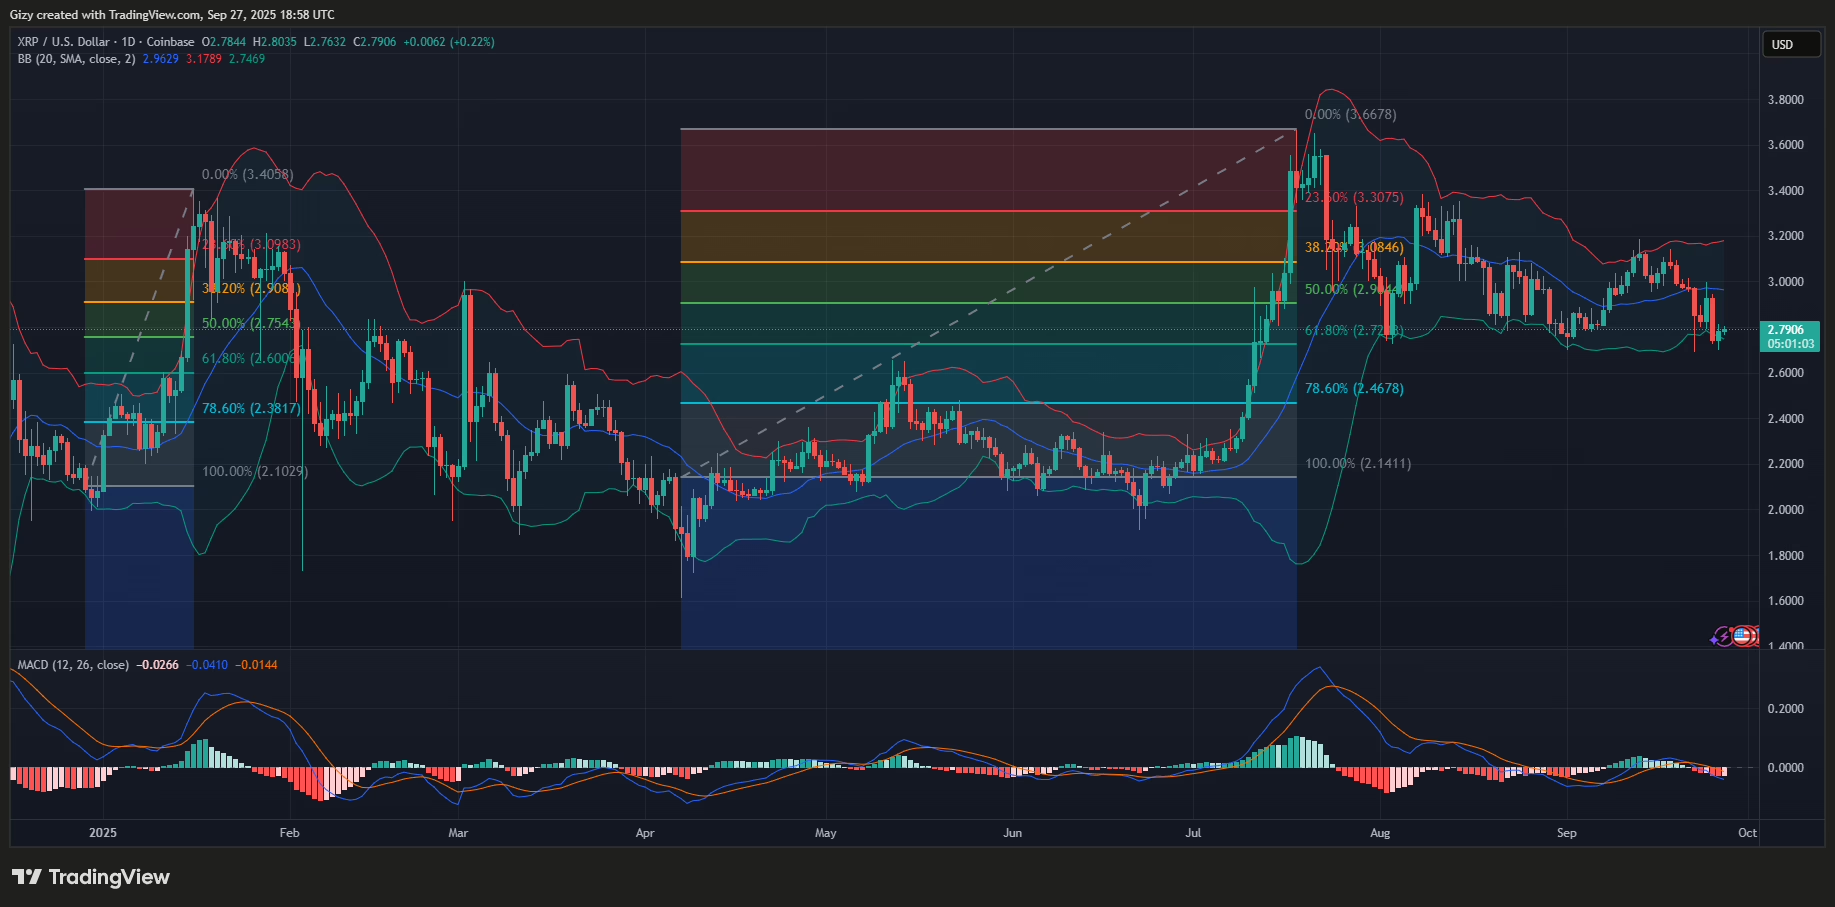
Like BNB and the rest of the market, XRP experienced notable selling pressure starting Monday, when it lost nearly 4%. The downtrend continued, and the asset is down by over 6% on the 1-week scale. Amidst the losses, it is worth noting that the asset rebounded off $2.70 twice in the last five days, making it a short-term support level.
Regarding indicators, the MACD exhibited a bearish divergence the previous week and continued the trend. It currently shows strong signs of changing its trajectory despite the recent recovery in prices. However, the relative strength index is on the rise in response to the latest increase in buying pressure.
BNB/USD
BNB saw an end to its quest for new ATHs on Monday as it retraced, dropping by over 5%. It dipped even lower on Tuesday, hitting a low of $963 before rebounding. However, it wasn’t exempt from the massive retracement on Thursday.
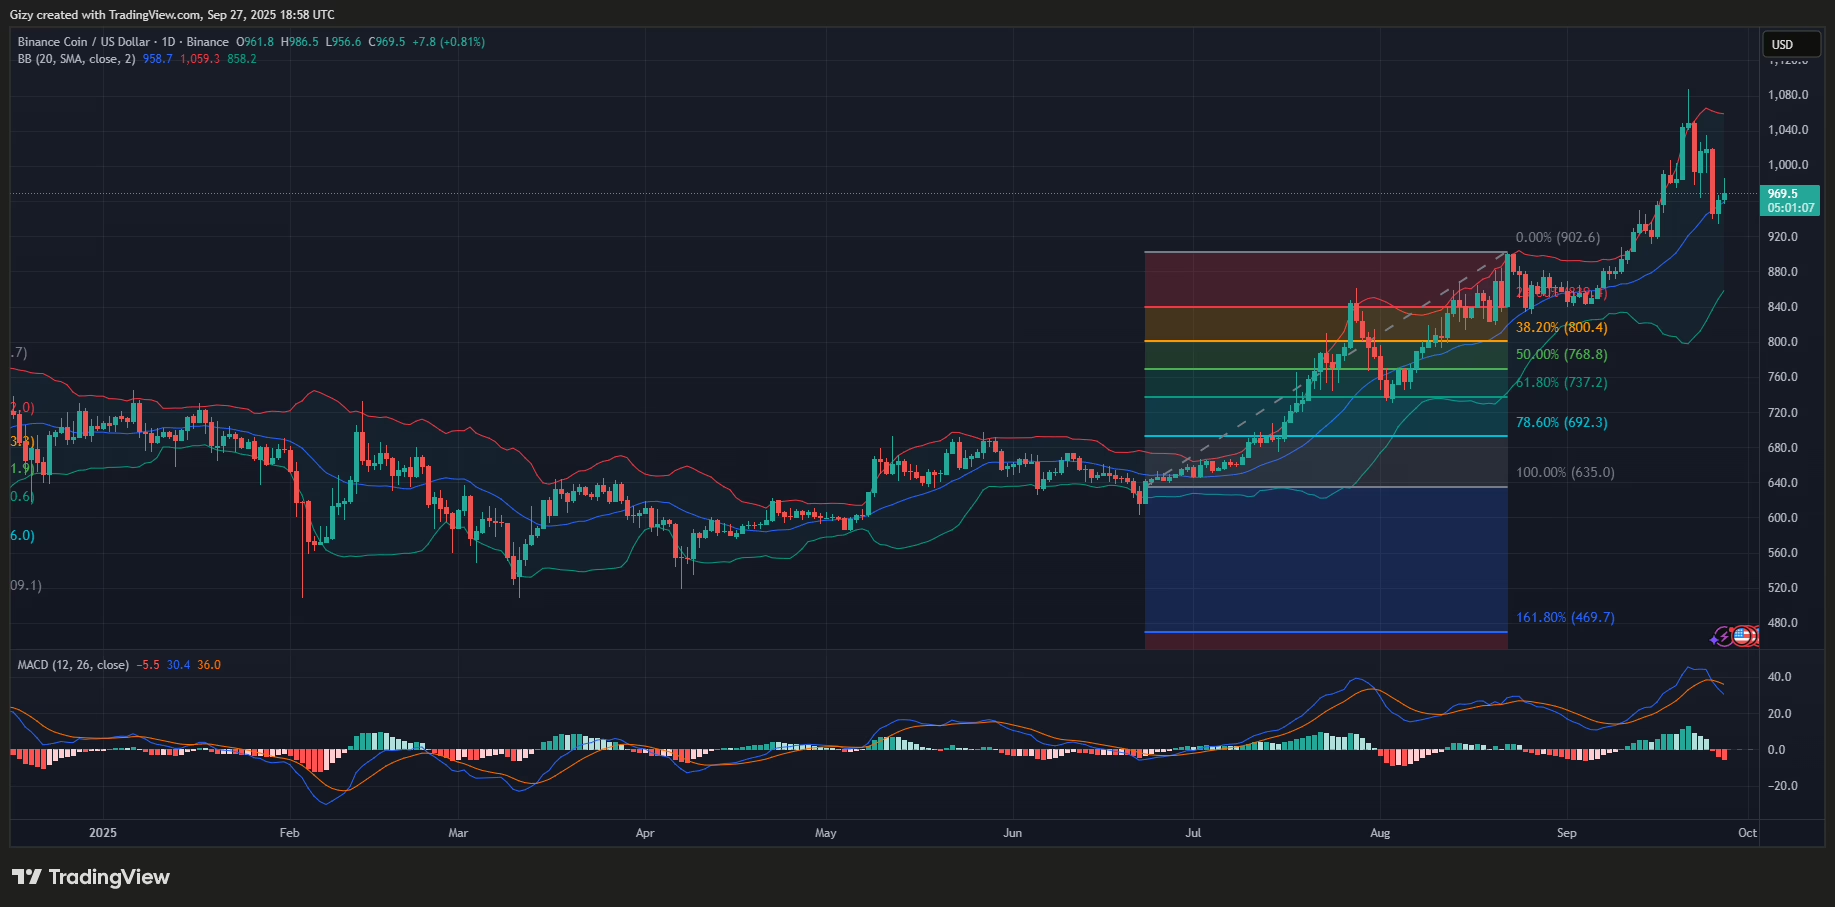
BNB opened the fourth day of the week at $1,019 and experienced massive selling that resulted in a dip to $939. It is recovering at the time of writing, marking its second consecutive green, having peaked at $986.
Nonetheless, it remained close to Bollinger’s middle bands during the decline, and the current price suggests that it served as support. However, the moving average convergence divergence showed a bearish crossover a few days ago.
The 1-day chart indicates that BNB was overbought last week. RSI surged above 70 and peaked at 80. Trading actions over the past five days resulted in the metric dropping to a low of 51, but it is now trending at 54 following the recent buyback.
SOL/USD
Solana is trading at $201 and is experiencing notable selling pressure. It is down by 2% on Saturday following its retracement from $205. The coin is pulling back some of the gains it had on Friday when it surged by over 6%.
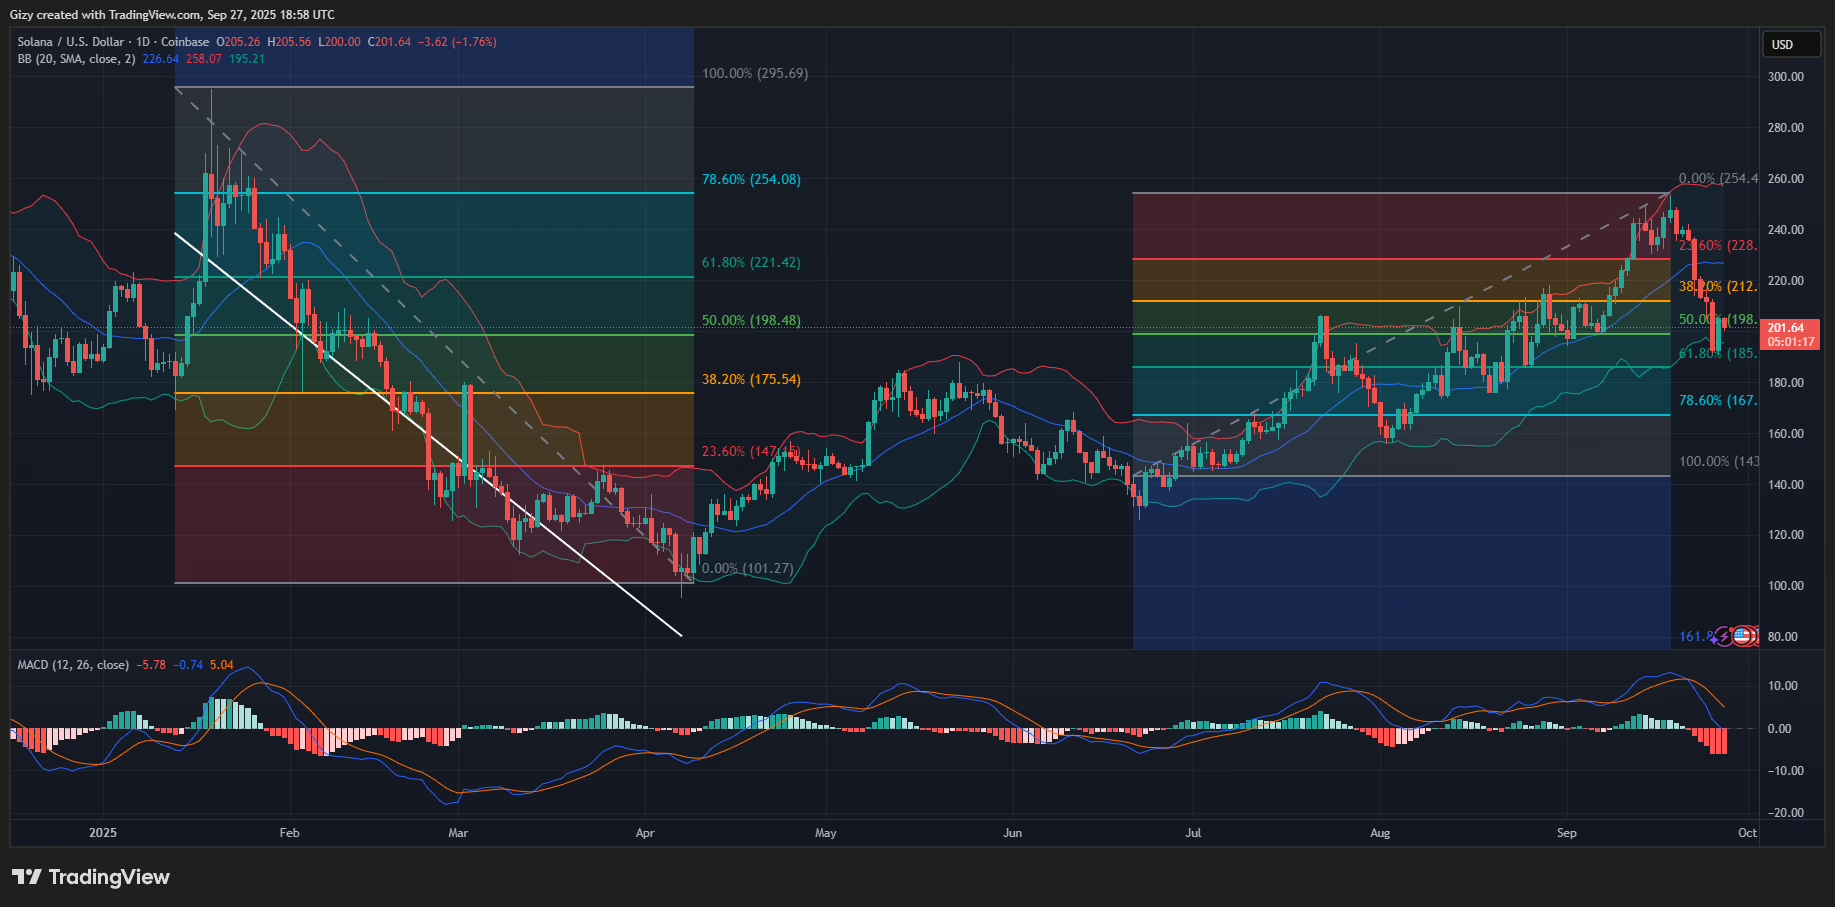
Nonetheless, the asset has been on a downtrend since the week started. Like BNB and the rest of the market, it had a bearish start to the session and is down by over 14% on the 1-week scale.
However, the Bollinger Bands indicate that SOL is trading above the lower band, following its previous incursion below it. Additionally, the relative strength is reacting to the most recent buyback, halting its retracement.
Nonetheless, the moving average convergence divergence had a bearish crossover on Monday. The divergence between the 12- and 26-day EMAs is reaching levels higher than those seen during the previous crossover.