
ETH is on the move again. Its current price suggests that the largest altcoin is on the verge of attaining another key milestone.
The 1-week chart shows a notable increase over the last two weeks. Nonetheless, the continual revival of price momentum by large buys indicates that institutional interest remains strong.
Data from CoinMarketCap reveals a slight increase in trading volume since the start of Sunday. However, on the 24-hour scale, volume is down by almost 33%.
BTC and other major assets are experiencing a similar decline in trading activity. The cryptocurrency market cap remains close to $3.90 trillion, with a slight increase.
Nonetheless, investors are hopeful of further price increases. The Fear and Greed Index is at 68, indicating a high level of greed.
Fundamentals were significantly bullish over the last six days. The week started with Donald Trump’s “Happy Crypto Week” remark. Another key event was the signing of several bills aimed at fostering the growth of the crypto industry across the U.S.
While the market may be going through a cooldown at the time of writing, some altcoins are seeing notable increases. One such is Tezos. The asset has made a comeback, surging by over 45% in the last 24 hours. Conflux follows closely with gains of almost 40%.
Several cryptocurrencies experienced significant price fluctuations over the past six days. Let’s see how some in the top 10 performed.
BTC/USD
The 1-day chart shows that Bitcoin mostly consolidated for most of the week. It surged to its highest value on Monday, reaching a peak of $123,236. However, it lost momentum, retracing to its opening price.
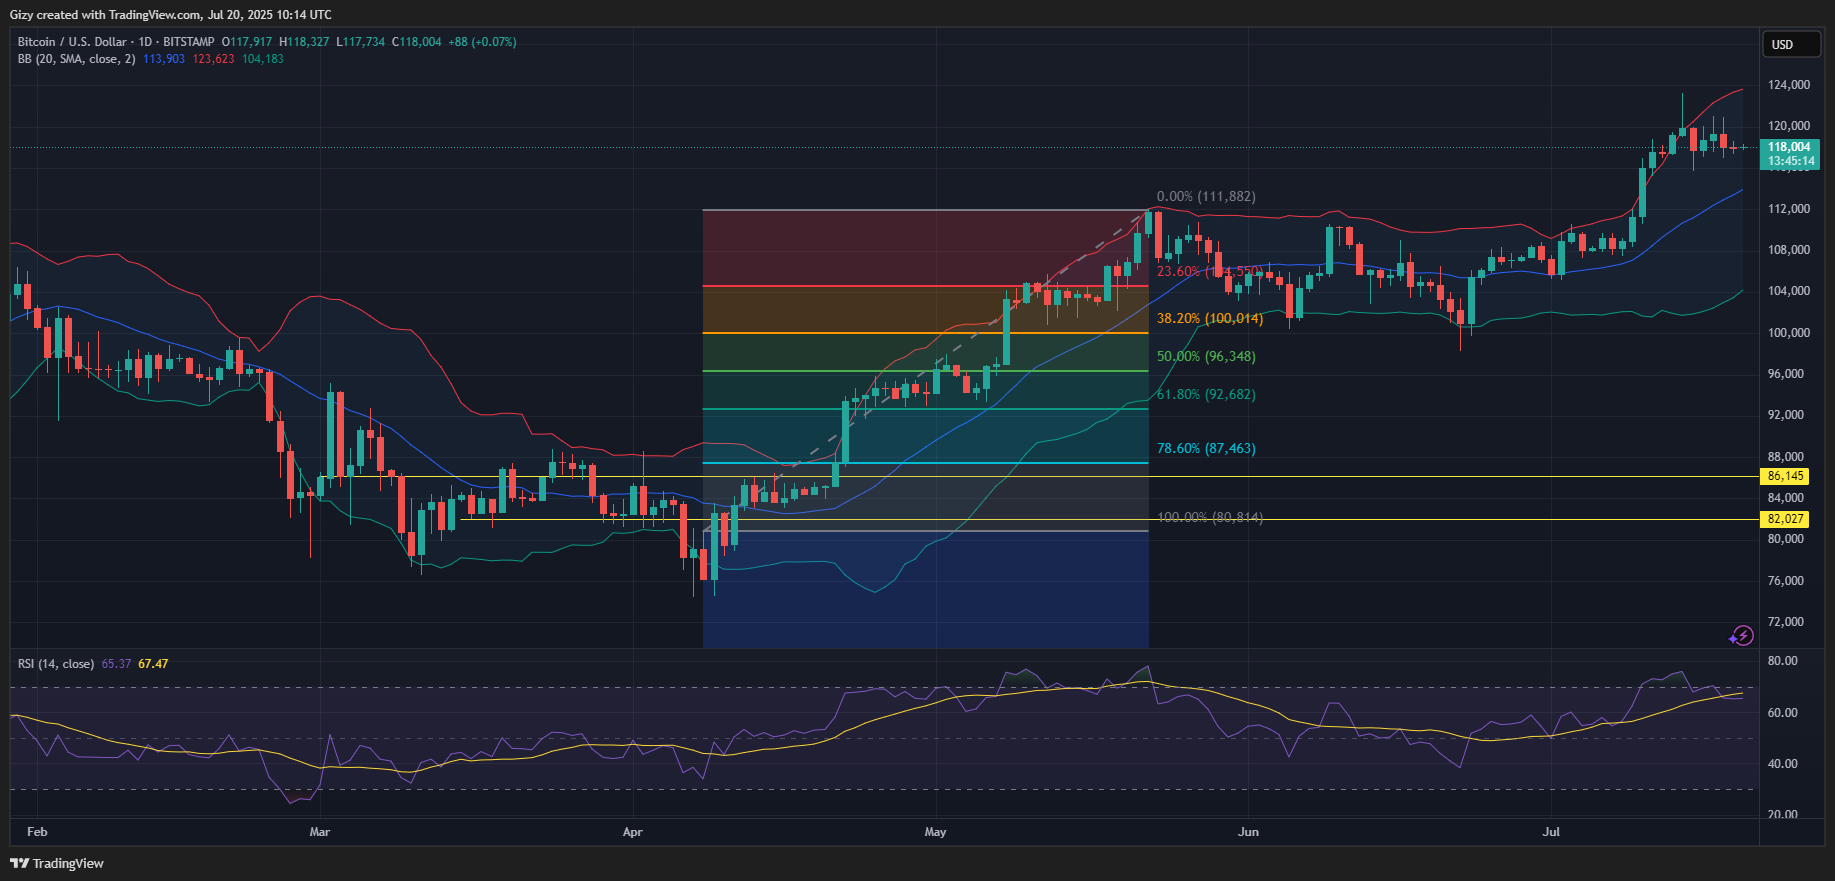
Tuesday was the most bearish for the apex coin as it experienced a notable decline. Several news reports of whales selling their bag made the rounds, spreading panic. The relative strength index dipped to 67 from 75 during the session.
BTC recovered the next day. However, it has since failed to end the day above $120k. The trend worsened over the weekend as the asset saw reduced volatility.
A closer look at the relative strength index suggests that the apex coin registered almost equal buying and selling volumes over the last 48 hours—the metric trended in a straight line during this period.
Nonetheless, Bitcoin surged above its bollinger bands on Monday. It returned below the upper band the next day and remained within it for the rest of the week.
The 1-week chart shows that the apex coin registers its first red candle after three consecutive green candles. Although it’s a doji, concerns that it may lead to further declines are high.
ETH/USD
Ethereum garnered significant attention over the last two weeks, flipping one resistance level after another. A closer look at the 1-day chart suggests that the altcoin has registered no red candles since Jul 12.

While the candlesticks collectively indicate notable increases, there were times when they carried no significant price change.
ETH had a less thrilling performance on Monday, reclaiming $3k and peaking at $3,083. It ended the session with no notable increase as it retraced. Nonetheless, it gained momentum on Tuesday, surging to a high of $3,144.
The 1-day chart shows another massive surge on Wednesday, the biggest of the week. ETH opened trading at $3,138 and reached a peak of $3,425. It closed with gains exceeding 7%.
RSI indicates that Ether is overbought. The metric is at 86, the highest in months. However, the altcoin’s consistent proximity to the bollinger’s upper band raises fears of an impending reversal. It broke above it on several occasions.
XRP/USD
XRP was on another massive run, similar to ETH. It had a decent start to the week, surging by over 4% on Monday. Itv resumed its uptick after a slight decline, gaining another 4% on Wednesday.
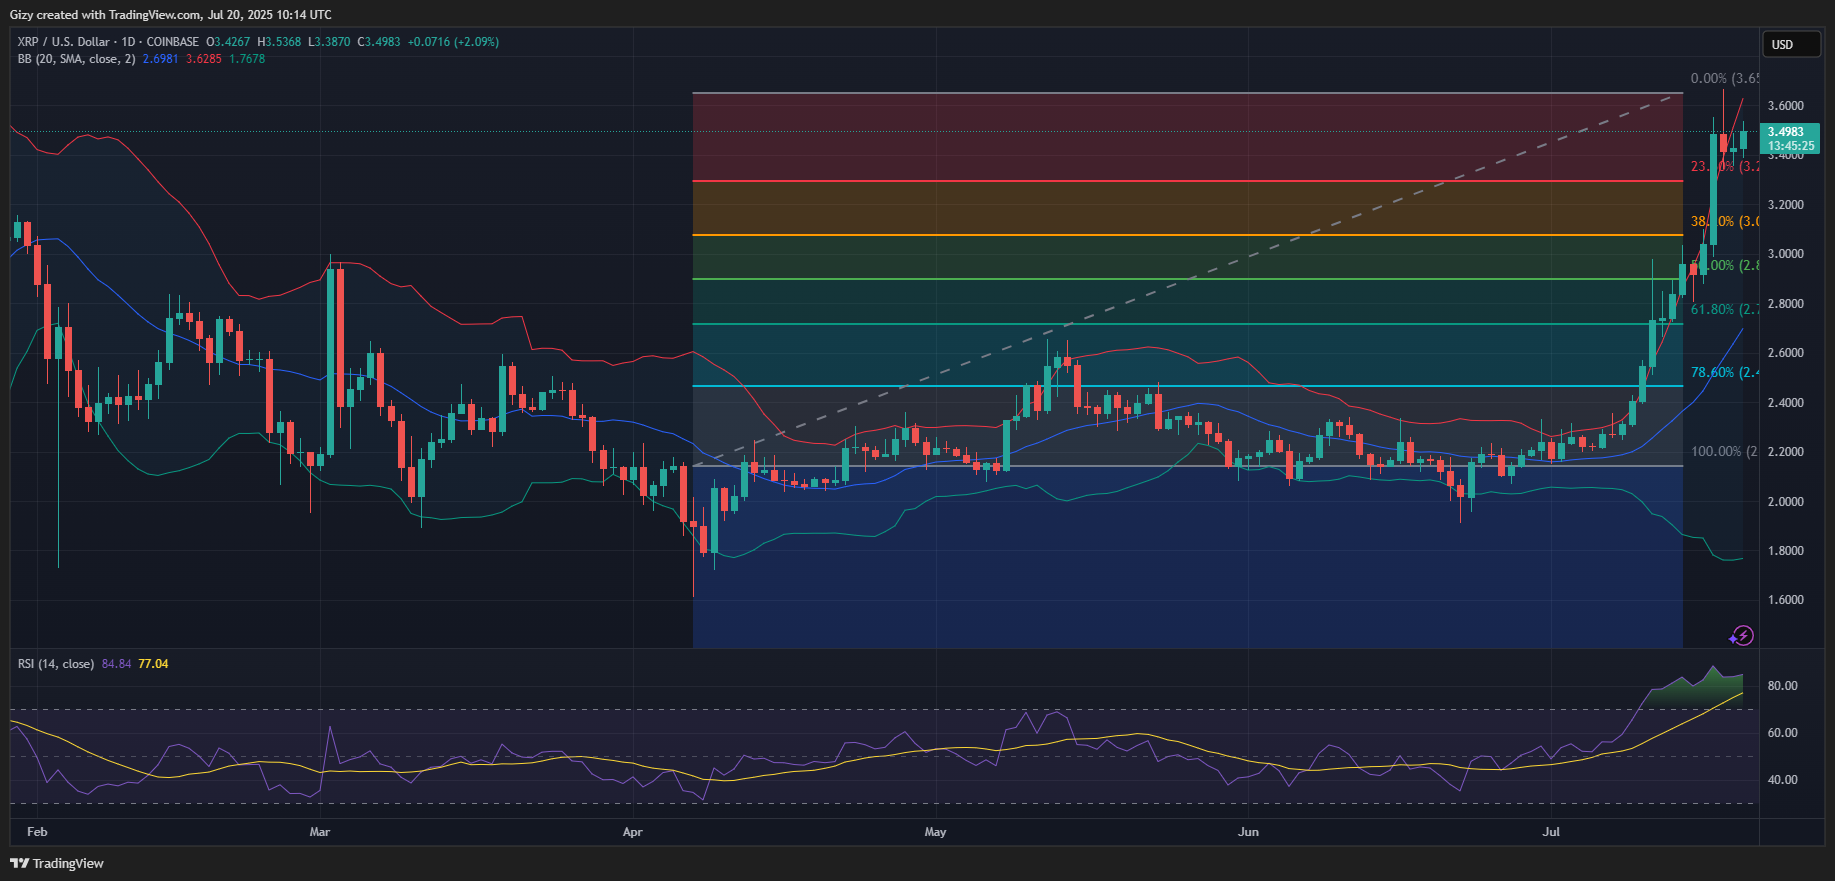
Thursday was the most bullish for the asset. It opened the session at $3 and surged, breaking above $3.50 for the first time ever. The altcoin closed with a whopping 14% increase.
The bulls tried to continue the run the next day with limited success. Nonetheless, XRP recorded another all-time high, reaching a peak of $3.66. It retraced afterward and lost almost 2%.
Price action over the last 48 hours suggests that the asset is consolidating. It continues to struggle above $3.50. However, the relative strength index indicates that the altcoin is overbought. The metric is at 84 amid the unfolding trend.
Nonetheless, it broke above the bollinger bands on Thursday and traded above them for most of Friday. It is back within the bands at the time of writing.
BNB/USD
Binance coin ended the last three days of the 0f the previous week with no notable change in value. However, the trend changed on Monday when it broke above $700 for the first time since February.
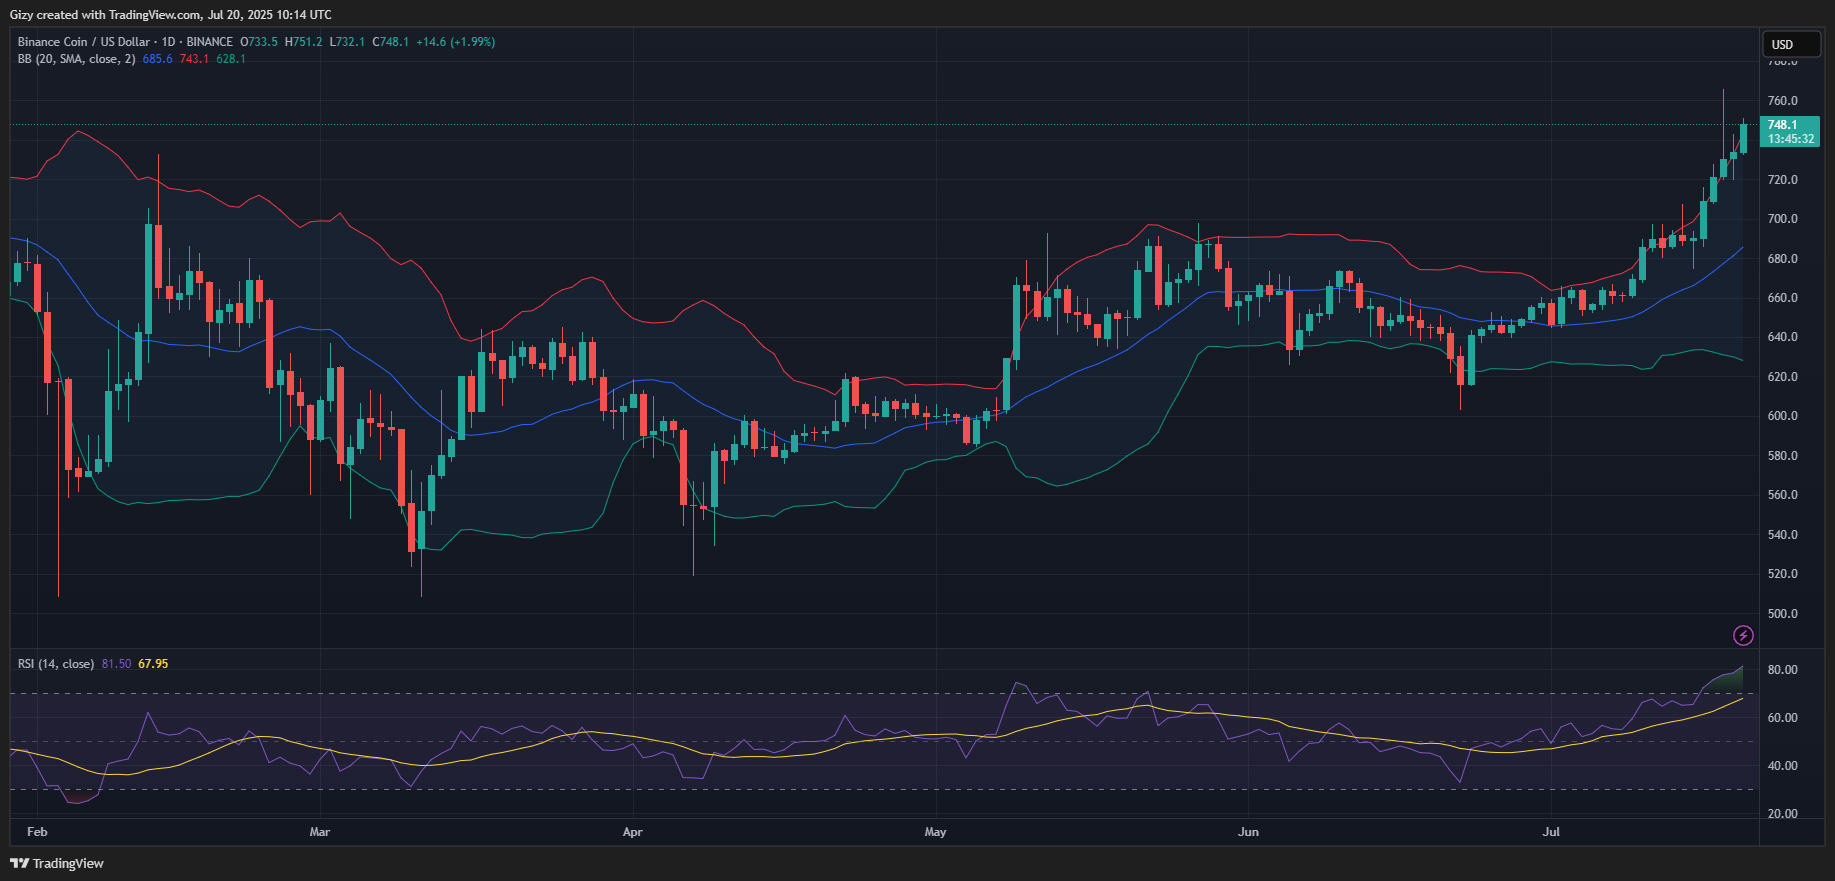
The coin experienced notable corrections after reaching a peak of $707. The downtrend continued into the next day, with the asset dropping to a low of $674.
Nonetheless, it had one of its most significant surges on Wednesday, breaking above $700 again, and peaking at $715. Another massive increase occurred on Friday, when the altcoin reached a high of $765. News of a firm adding the asset to its treasury no doubt fueled enormous optimism.
Like ETH, RSI is currently above 70. It broke out on Wednesday, and it is trending at 81 at the time of writing. BNB is on the move again as buying volume soared. Up by more than 2%, it heads for one of its most bullish closes in weeks.
SOL/USD
The 1-day chart indicates that Solana enjoyed massive volume over the last six days. While the first two days of the week failed to yield the desired results, the trend shifted on Wednesday, when it experienced its biggest surge.
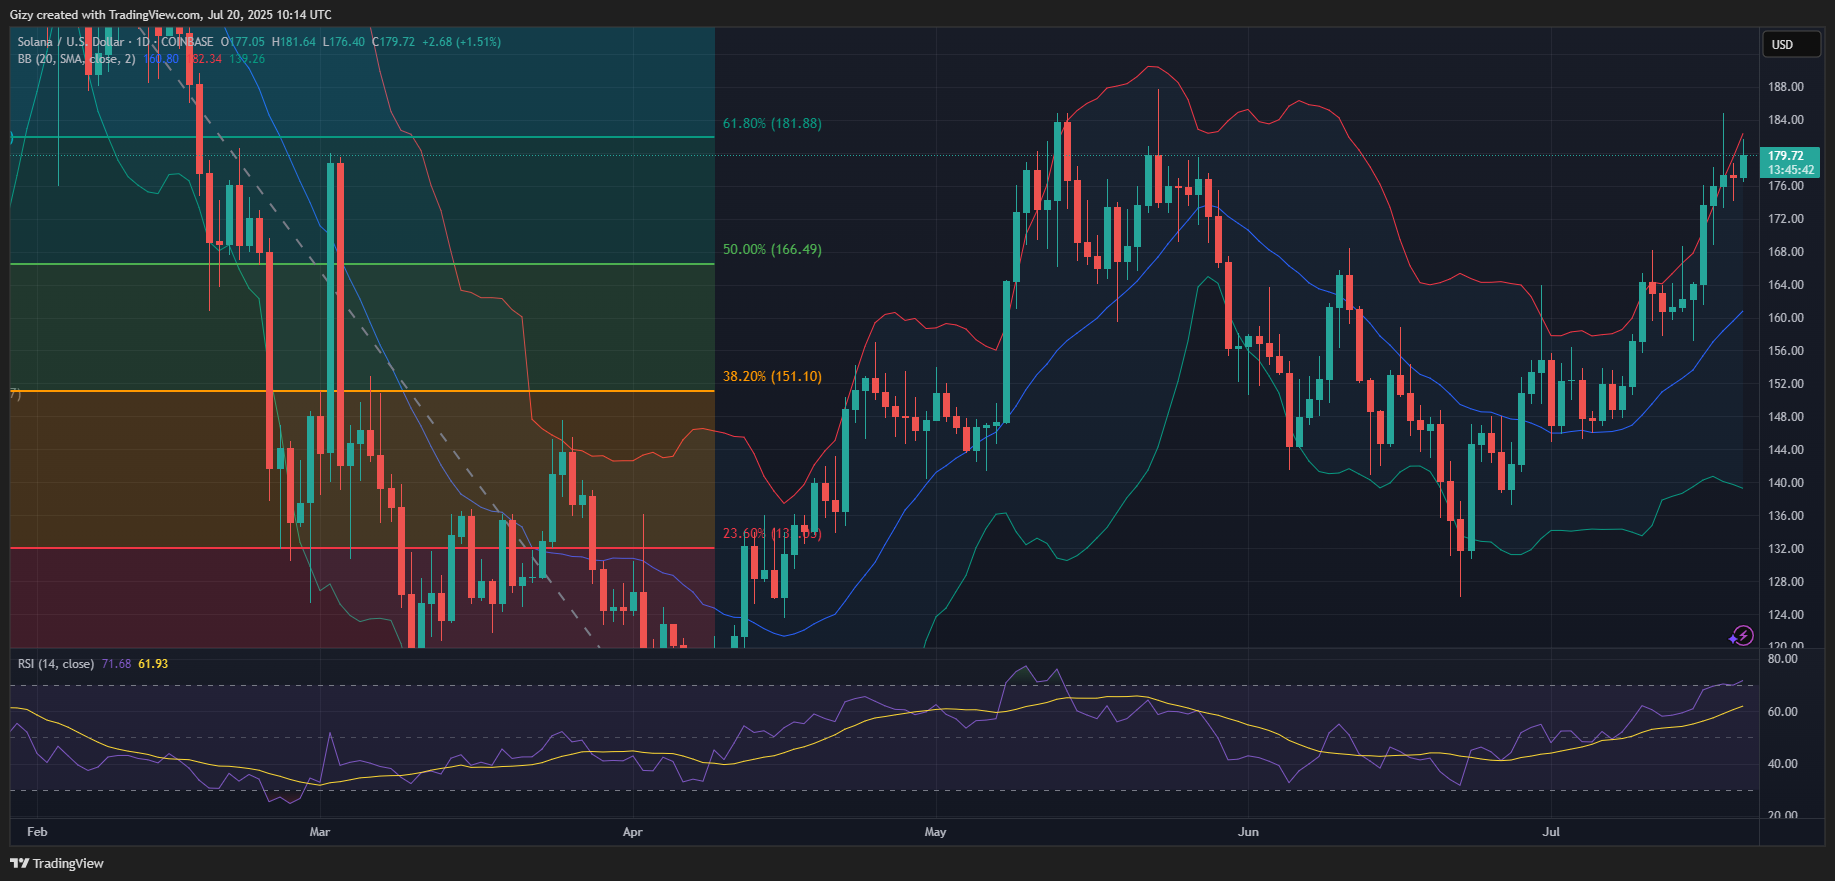
It opened at $164 and broke above the thirty-day high at $168. It continued upward, peaking at $176 and closing with gains of almost 6%. The chart shows that the coin saw further price increases over the next two days, surging to another high on Friday.
SOL broke above $180 and surged to a high of $184. RSI indicates that the asset became overbought during this period. The metric is currently at 71, continuing its trend of being overbought.
Sunday is off to a strong start for the asset, as it peaked at $18 earlier. Its current value suggests that it is up by almost 12% on the weekly scale.


