
LINK grappled with significant selling pressure over the last six days. It had a series of notable declines during this period, resulting in substantial losses.
LINK sees less volatility with a stronger downward push. However, the global cryptocurrency market remained almost the same from the start of the week. The altcoin’s price movement suggests that it saw lesser trading volume.
Nonetheless, the crypto fear and greed index slightly improved during the week. The metric peaked at 43, the highest in the last two weeks. However, it’s somewhat lower than when the seven-day period started.
Some altcoins saw massive increases amid the almost neutral sentiment across the market. FTM, which rebranded into Sonic, saw a significant inflow, resulting in a nearly 60% increase. The asset edged closer to $1 but faced notable resistance after slightly breaking it.
Maker has seen similar massive price increases in the last seven days. The one-day chart shows no red candle during this period as the bulls sustain the uptrend. The asset surged higher a few hours ago, breaking above $1,600. It gained almost 55% this week.
The neutral state of the crypto market sees some cryptocurrencies grapple with reduced volatility. Let’s examine how some in the top 20 performed in the last seven days.
ADA/USD
Cardano is on the verge of closing the week with no significant change in value. The one-week chart shows that it experienced notable volatility during this period. However, the bulls failed to hold on to reclaimed levels.
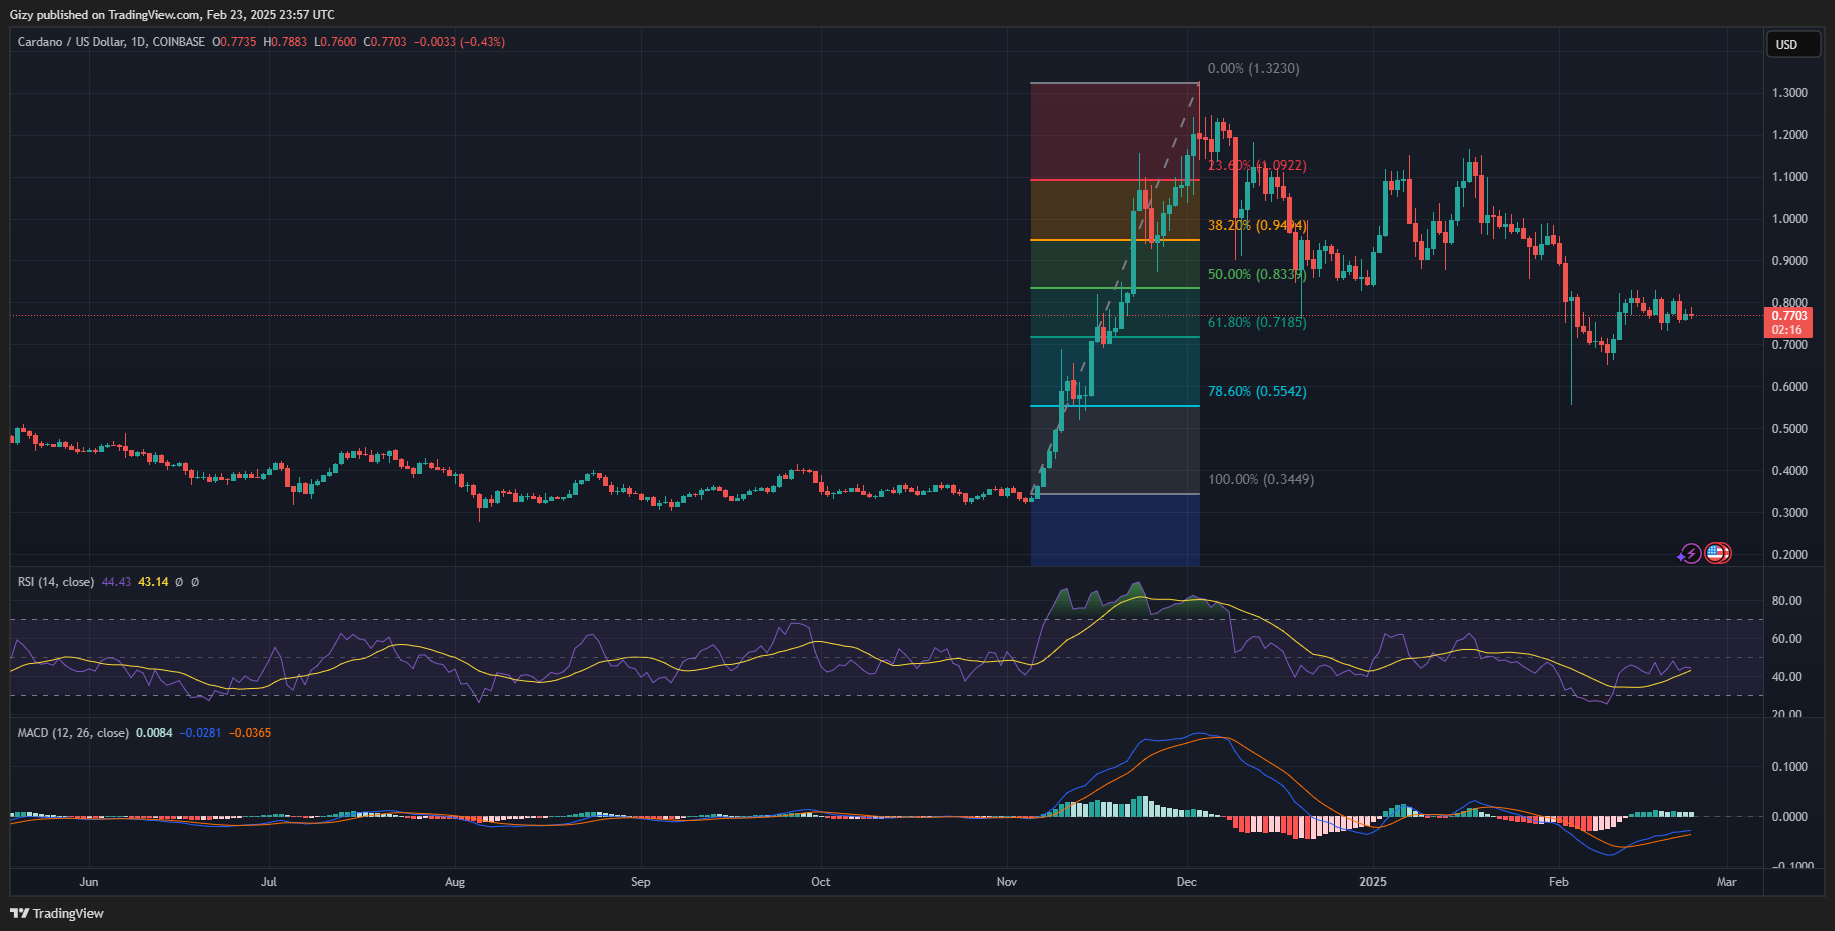
The one-day chart shows the coin’s most significant decline on Tuesday. It opened trading at $0.80 but retraced after a slight uptick. It broke below the $0.75 support, hitting a low of $0.73 and losing almost 7%.
The coin met buyback over the next two days but retraced on Friday to $0.75 and has since struggled to breakout. ADA continues its rangebound movement that saw it trend between $0.82 and $0.73.
The relative strength index mirrors the price trend as buyers and sellers remain locked in a struggle for dominance. However, MACD remains positive as the 12-day EMA continues its uptrend, with the 26-day EMA following closely.
The Fibonacci retracement level indicates that the coin is trading above the 61% fib level, a mark with notable demand concentration.
TRX/USD
The one-week chart shows Tron printing its smallest candle in the last three months. The coin sees less trading volume, resulting in less volatility. Nonetheless, it displays a doji, indicating no significant changes to prices.
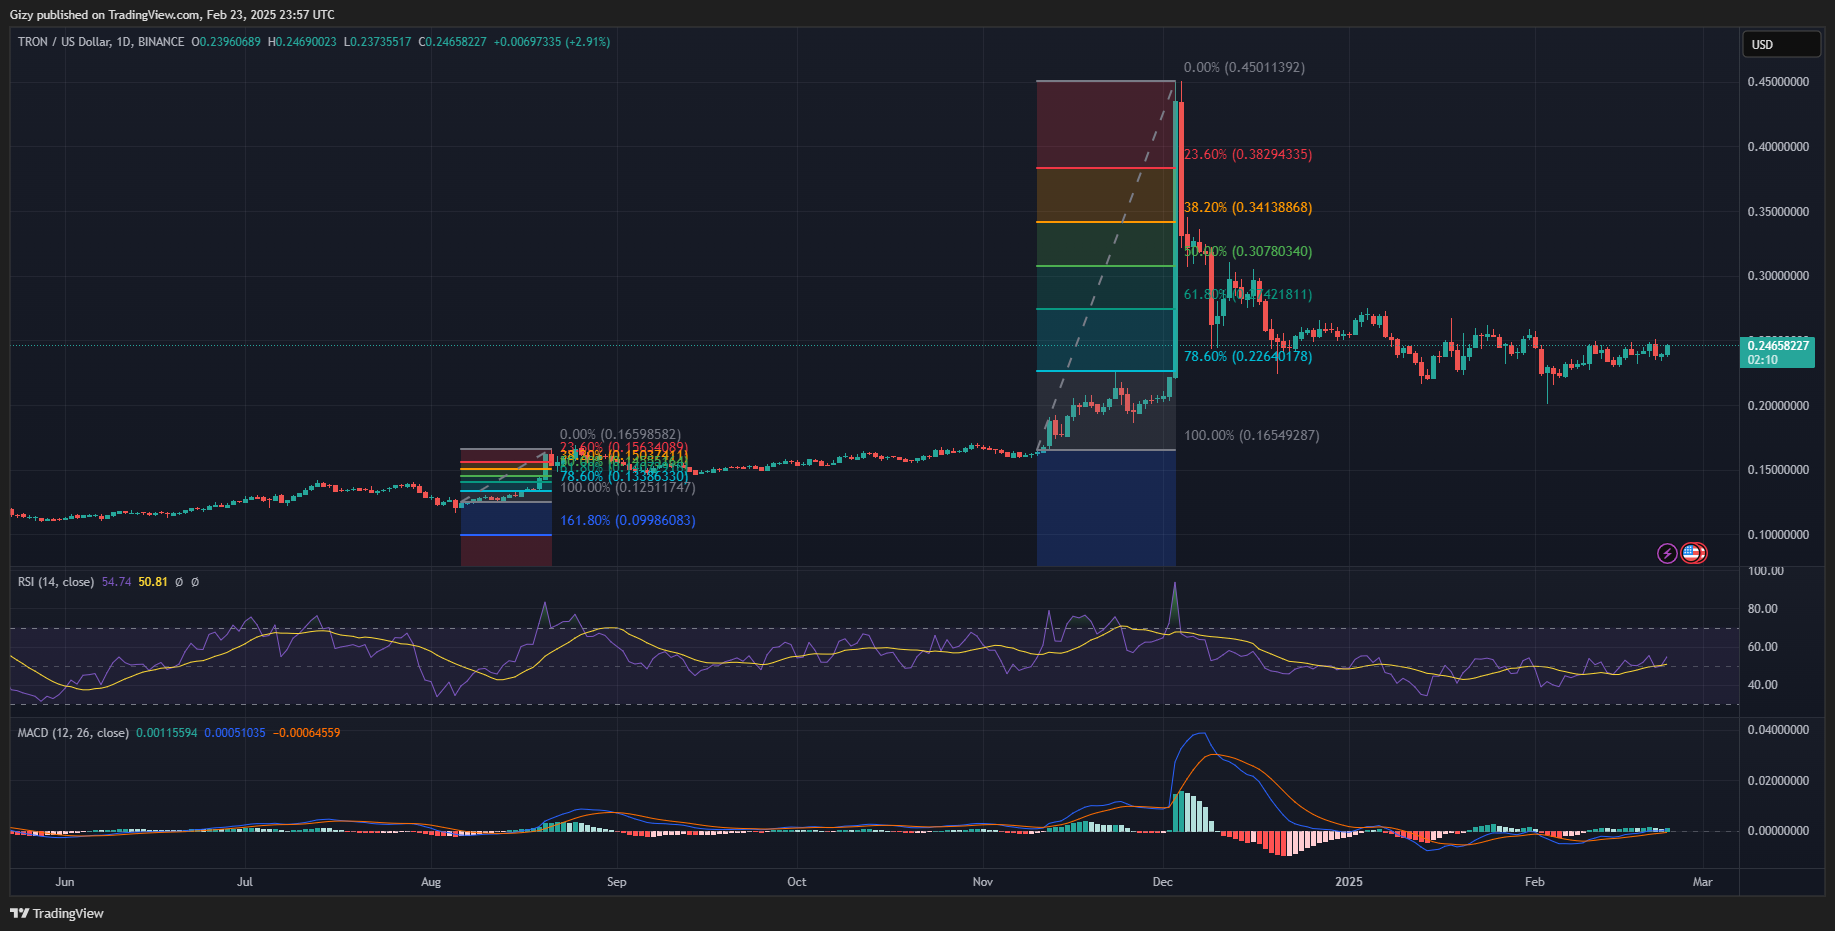
The cryptocurrency tested its fourteen-day high at $0.250 but fell short at $0.248 due to a sudden spike in selling pressure. It broke above the mark on Friday but faced massive rejection afterward.
TRX opened the fifth day of the week at $0.247 after a two-day recovery. It retraced to a low of $0.23 and closed with losses exceeding 3%. Sunday may be a bullish day for it as it’s up by almost 2%.
Nonetheless, the moving average convergence continues upward amid Tron rangebound movement. However, the histogram associated with the metric points to a gradual fluctuation in the buying pressure. The 12-day EMA surges higher, with the 26-day EMA following.
LINK/USD
MACD suggests that LINK is due for a rebound. However, it sees less buying volume over the last seven-days. The metric shows the 12-day EMA and 26-day EMA trending close to each other for most of the week. Nonetheless, the histogram shows a small green bar, indicating the start of a bullish divergence.
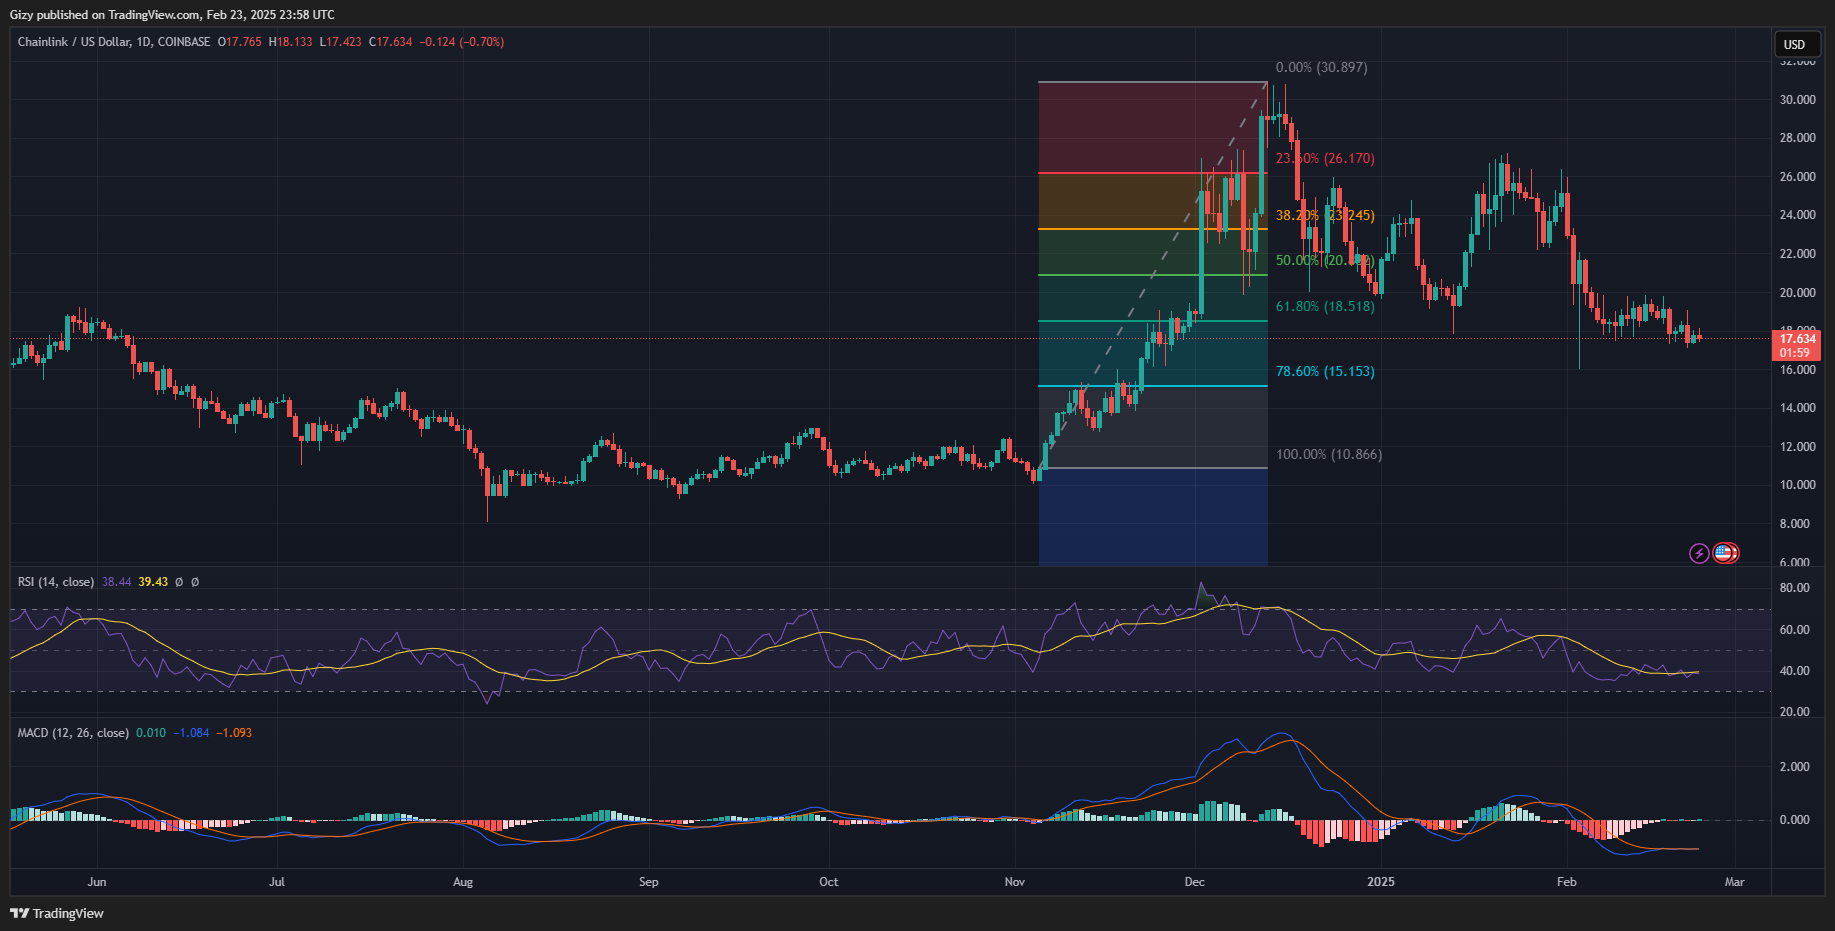
The relative strength index maintains a neutral trend with massive upside or downward push as the coin sees lesser trading volume. It trades close to its 61% Fib level and holds on to the critical $17.5 support.
LINK has been down by over 6% over the last seven days. The one-week chart shows the asset continuing its decline after a short break last week. Nonetheless, it remained within a rangebound movement for most of the session.
SUI/USD
SUI averted a bullish divergence a few days ago due to a shift in trading sentiment. The moving average convergence divergence displayed a bearish convergence a few days ago. However, the 12-day EMA resumed its uptrend after the coin saw a spike in buying pressure.
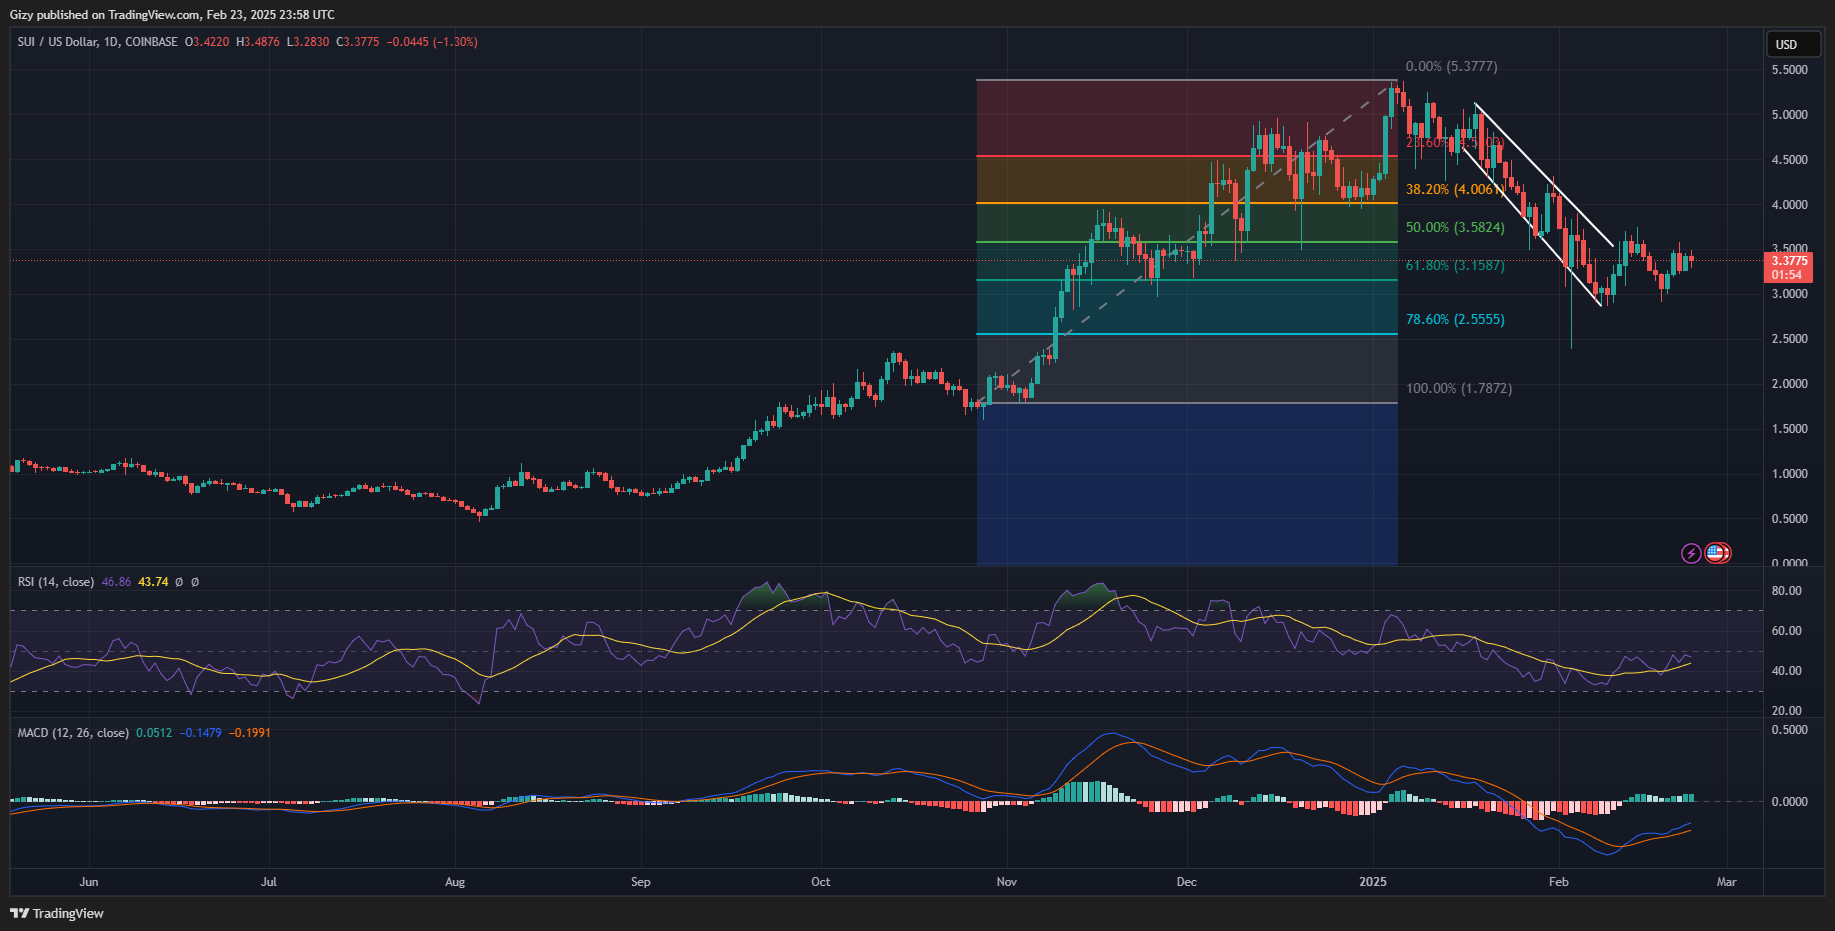
The relative strength index surged from 37 on Tuesday to 43 the next day, attesting to the sudden shift. The coin rebounded after it slipped below the 61% fib level at $3.15 and gained over 12% in two days.
However, the one-week chart shows SUI printing a doji. Over the last seven days, it retraced to a low of $2.91 and peaked at $3.57. Nonetheless, it failed to retest its fourteen-day high and remains in its two-week rangebound movement.
AVAX/USD
Avalanche prints another red candle on the one-week chart. Like LINK, it grapples with notable selling pressure, slipping lower. Nonetheless, trading actions on this scale hint at lessening bearish action. Currently printing a doji, its low over the last seven days is significantly higher than two weeks ago.
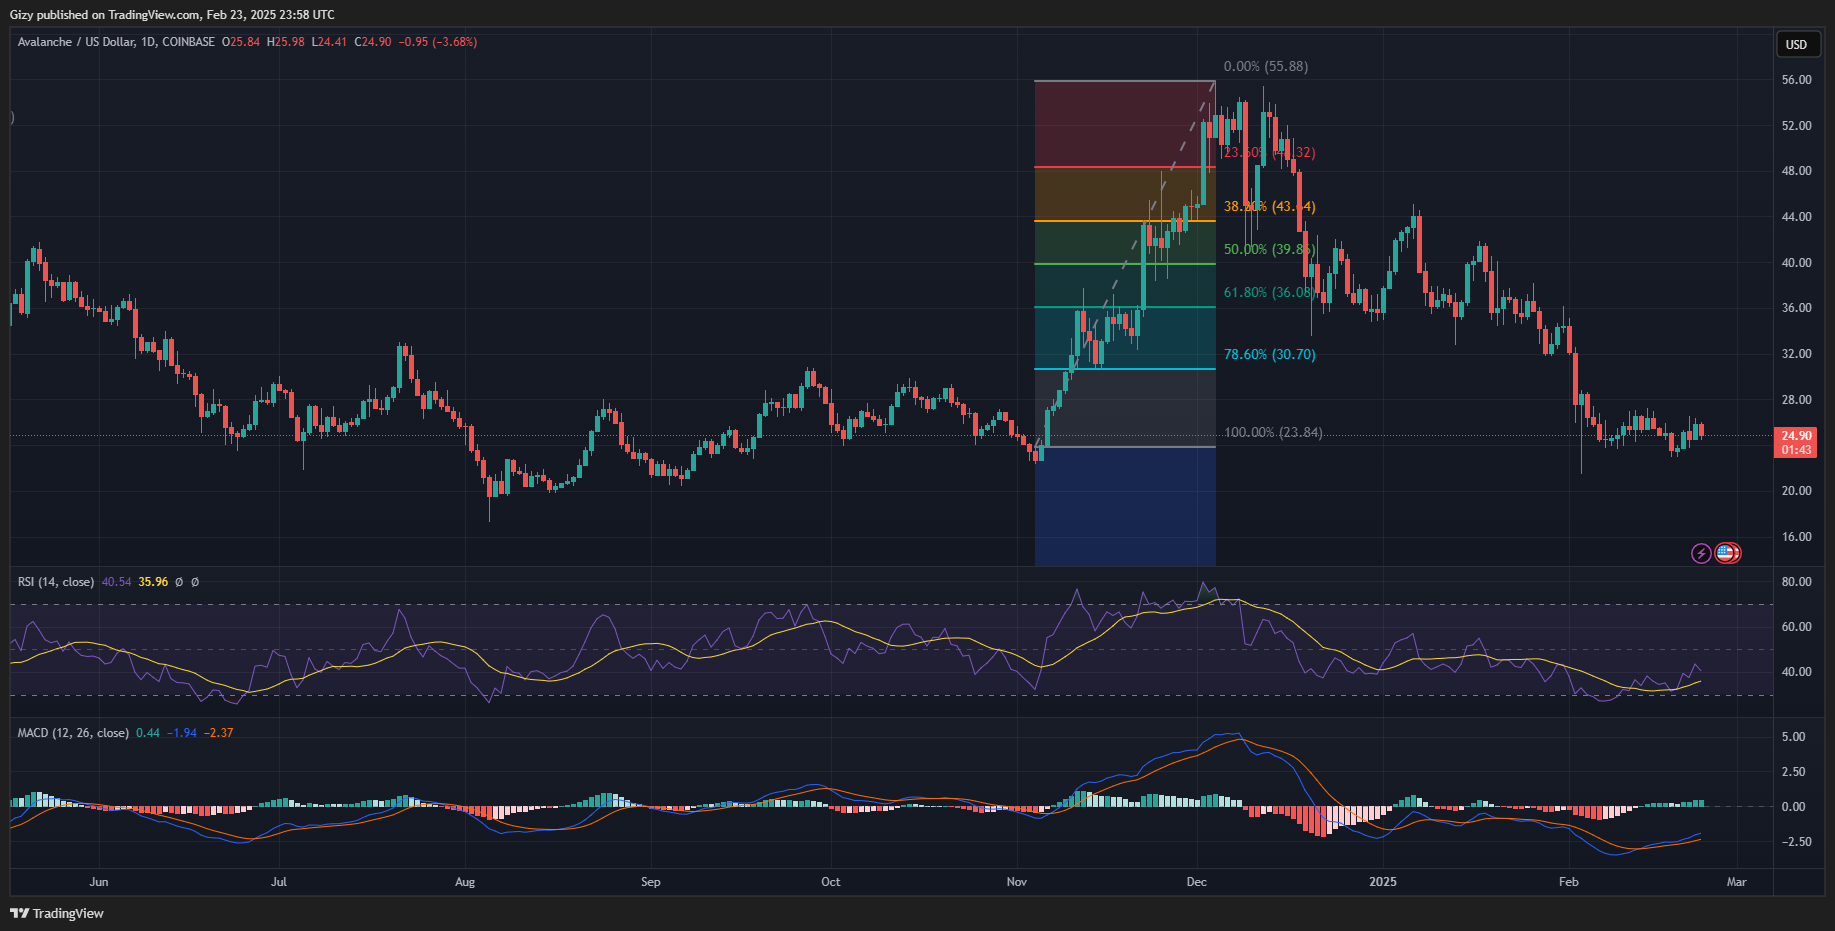
The one-day chart shows the asset erasing the previous day’s gains. It trades at $24.5 at the time of writing but maintains its upward trajectory. It remains locked in its rangebound movement below $27.
MACD is unaffected by the notable decline in the last 24 hours. The 12-day chart continues its uphill movement, with the 26-day chart following behind. RSI echoes the upward price trend over the last seven days as buying pressure increases.
XLM/USD
Stellar Lumen edged closer to testing its fourteen-day high on Thursday but failed. The attempt followed a significant surge the previous day when it opened trading at $0.32 and surged to a high of $0.34.
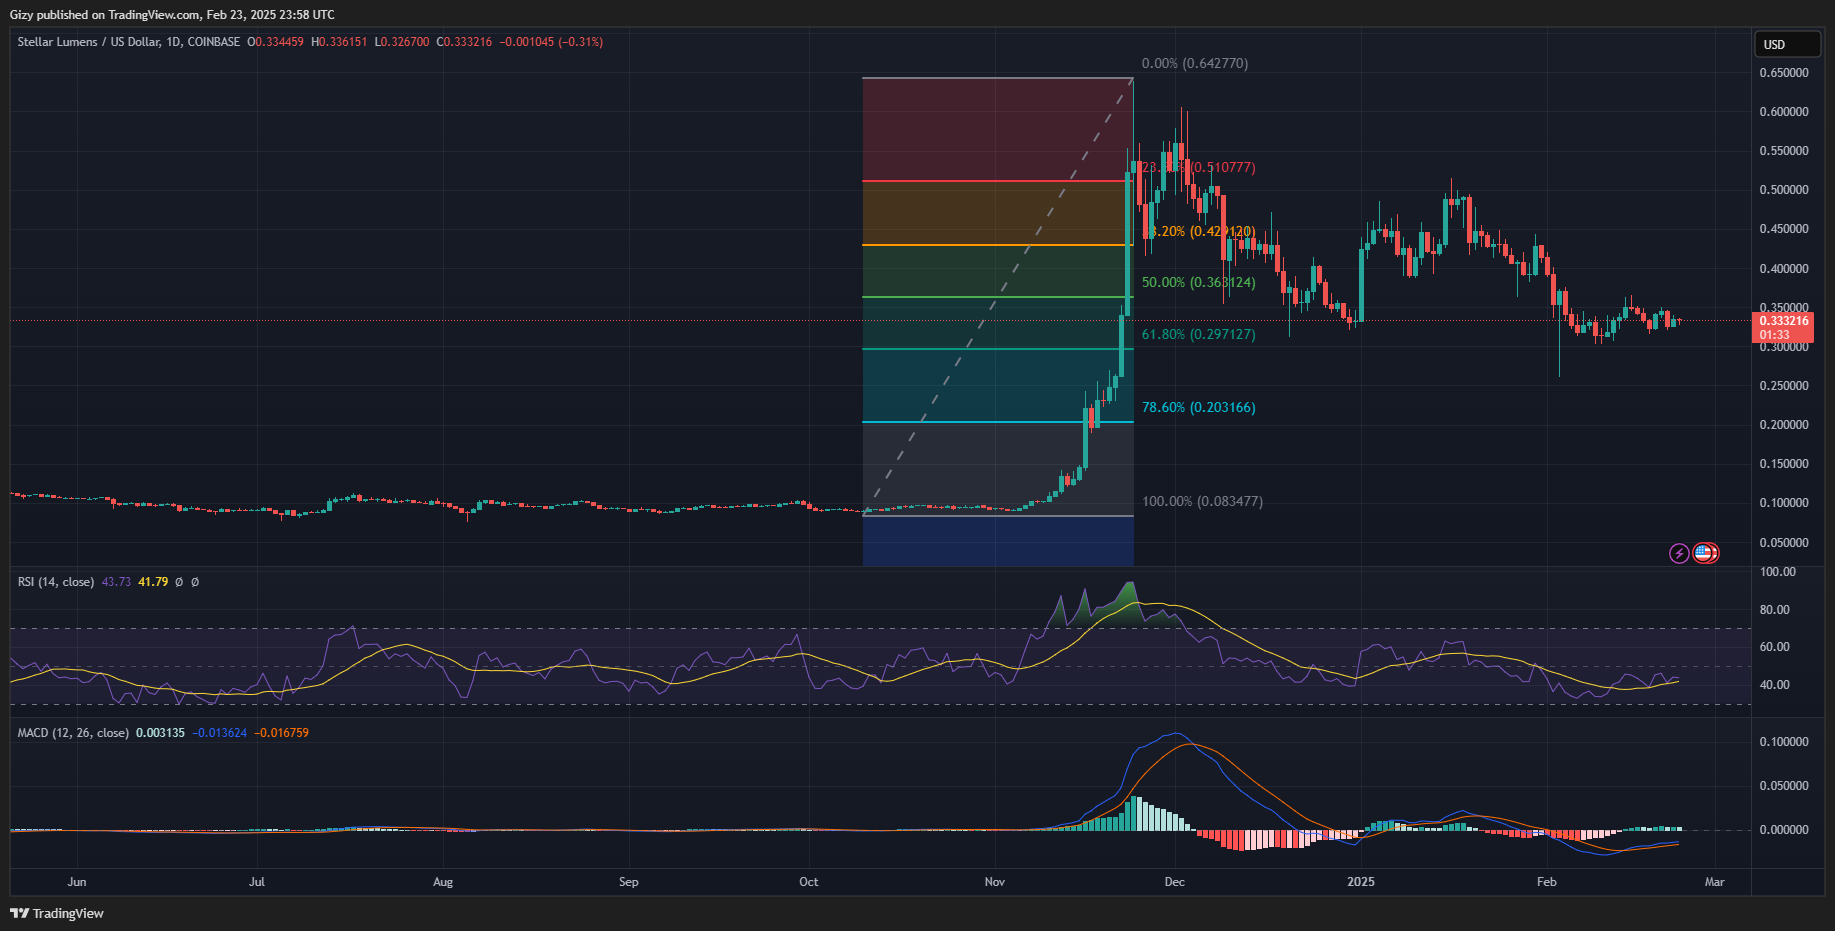
The one-week chart shows that the asset is printing red candle lost more than 3% over the last seven days. It dipped to a low of $0.31 a few days ago and met buyback but grapples with notable selling pressure, resulting in its failure to reclaim lost levels.
MACD is unaffected by the notable decline in the last 24 hours. The 12-day chart continues its uphill movement, with the 26-day chart following behind.
