
SOL registered a new high a few days ago but failed to sustain the uptrend, as selloffs took place afterwards.
The altcoin is currently consolidating as it navigates the weekend trend of low volatility. Nonetheless, SOL is not the only cryptocurrency experiencing the trend. The entire market saw a slight increase in trading volume over the last 24 hours.
There is steady selling underway as the global cryptocurrency market slightly retraced. A close at the current price will see the sector register its first week of losses after four weeks of consistent uptrend.
A closer look at the 1-week chart suggests that the uptrend may be coming to an end as the capitalization broke above its bollinger bands.
Dwindling interest in the market, old wallets taking profit, and reports of wars. These were the events that rocked the crypto market over the last six days.
Bitcoin remains rangebound, failing to register any significant increases. The calls for altseason are at their lowest in the last three days as altcoins have plummeted. The global cryptocurrency market cap, excluding BTC, is retracing and heading for its first red candle after four weeks of consecutive green candles.
Most assets in the top 10 experienced notable volatility over the last six days. Let’s see how they performed.
BTC/USD
Bitcoin continues trading sideways for most of the week. Tuesday was the most bullish day for the asset, as it gained over 2% after breaking the $120k mark.
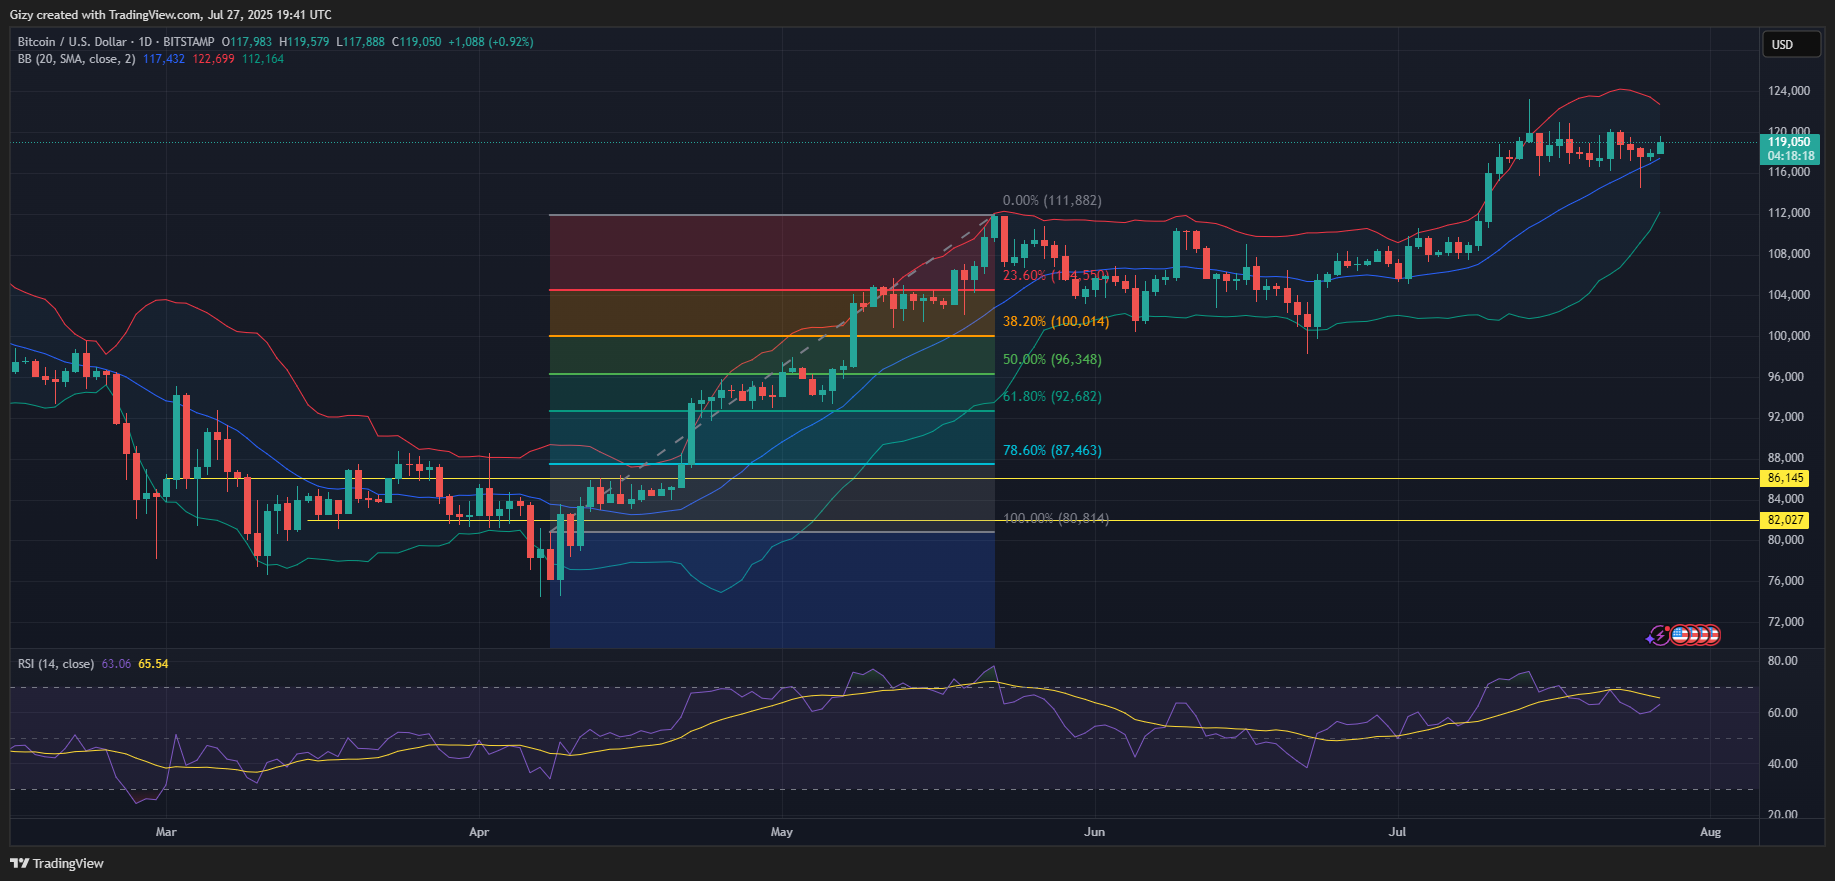
The apex coin has since grappled with notable selling and retraced to levels not seen in the last fourteen days. Its biggest decline occurred on Friday, when it retraced from $118,509 to $114,518.
Although it recovered, the asset ended the session with slight losses. Nonetheless, BTC is on the move again and approaches $120k. The 1-week timeframe shows no significant change over the last seven days.
Nonetheless, indicators are showing signs of an ongoing buyback attempt. The relative strength index is gradually rising, trending at 63 at the time of writing.
It is worth noting that the apex coin broke below bollinger’s middle band on Friday. Many expect a breakout after several days of range-bound movement. Trading action on Saturday saw the asset bounce off the mark and is currently trading above it.
It is worth noting that the bollinger bands are closing in. The metric is responding to the lack of massive volatility.
ETH/USD
Ethereum is on the verge of another bullish close. It opened trading at $3,743 but surged to a high of $3,853. It is currently up by over 2% and edges closer to breaking above its previous high.
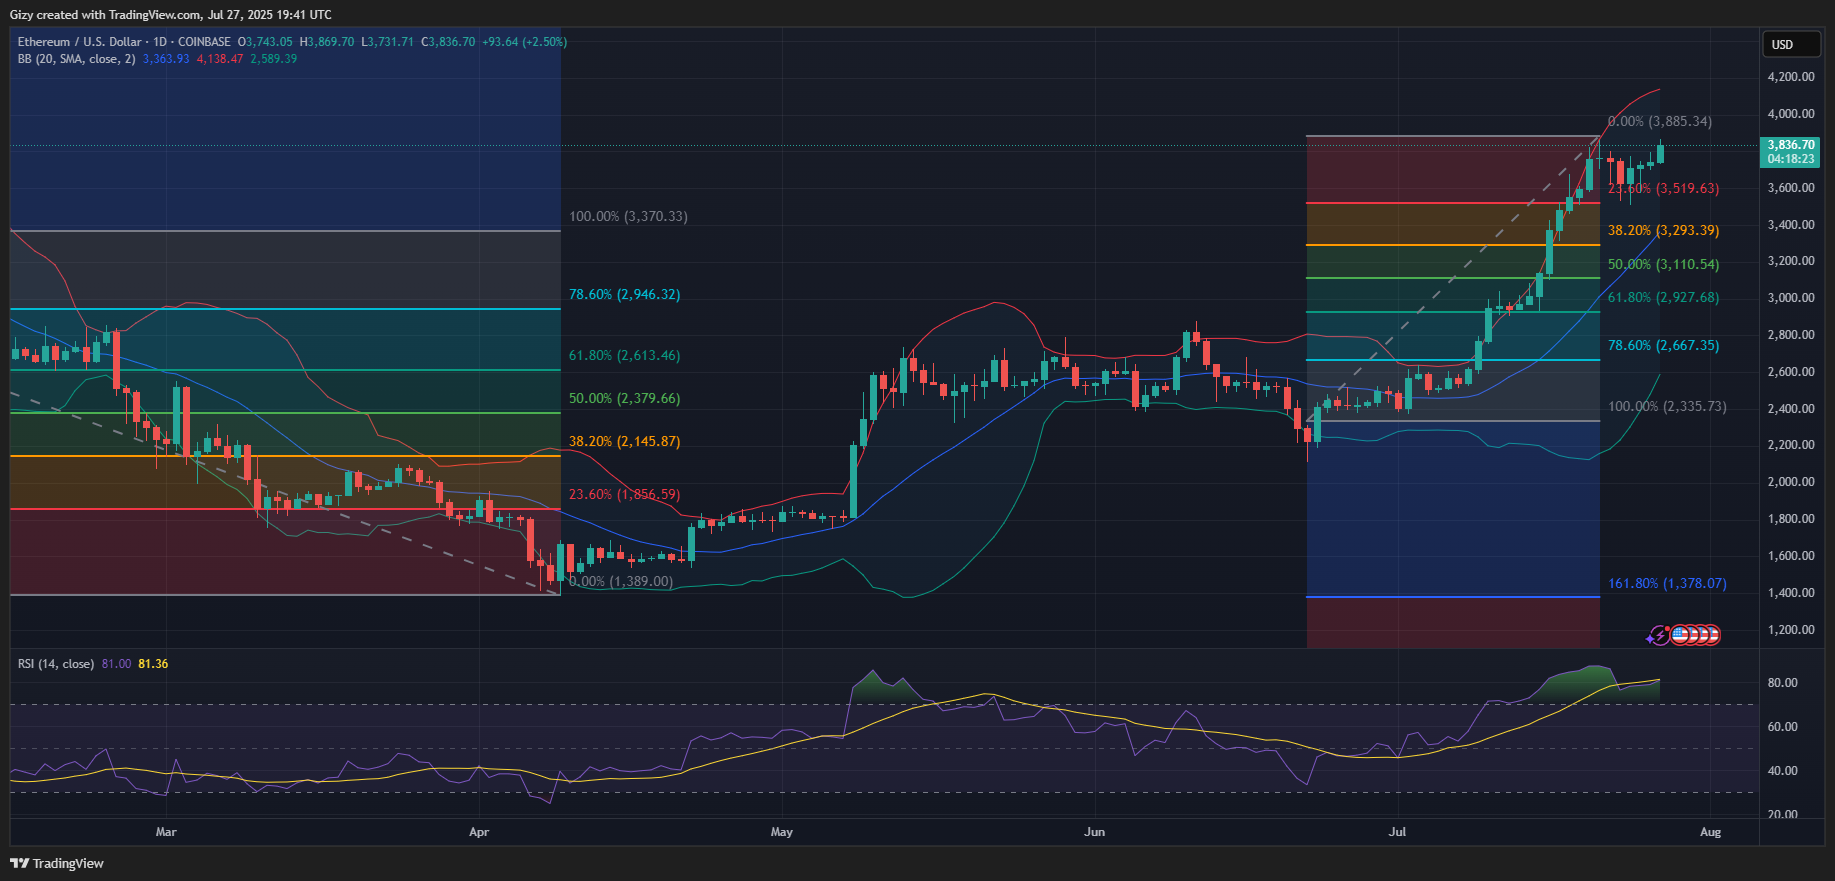
The latest price increase follows two consecutive days of doji patterns. ETH is heading for another green close on a weekly scale. Nonetheless, it is worth noting that the altcoin dropped to below $3,600 on Thursday.
The 1-week candle prints a hammer following the coin’s recovery from its low. It may be a source of concern, as it typically appears at the end of an uptrend.
Nonetheless, indicators remain negative. ETH is yet to retrace and is trading close to bollinger’s upper band. RSI blares warnings as it trends at 81. It means that the asset is overbought.
A closer look at the 1-day chart reveals that the altcoin has been consolidating for most of the last six days. Its current candle indicates a breakout attempt.
XRP/USD
XRP prints its second green candle. However, these candles carry no significant improvements in price.
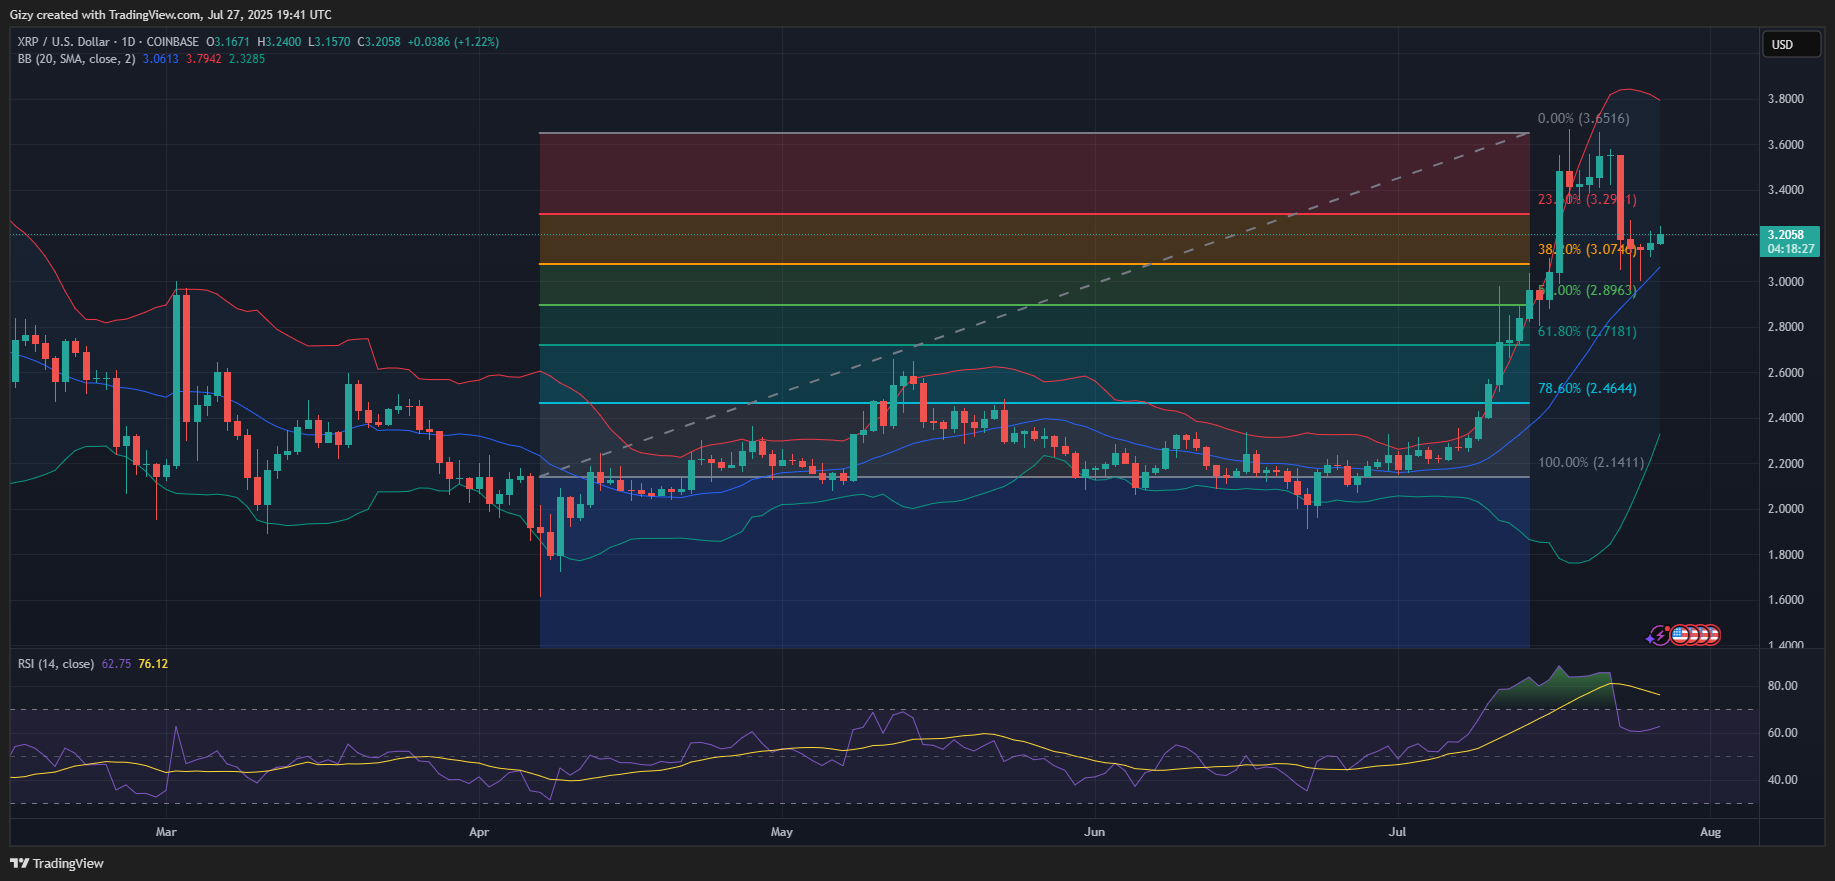
Nonetheless, the 1-day chart shows that the altcoin saw notable volatility over the last six days. It grappled with reduced interest from investors as selloffs near new highs. News of Ripple‘s co-founder selling a large amount of the asset rocked the market, inciting other investors to take profits.
The selloff resulted in the altcoin dipping on Wednesday. It retraced from $3.55 to a low of $3.05, losing over 10% during that session. XRP retraced further the next day, dropping below $3 for the first time in seven days.
Nonetheless, Wednesday offered the needed correction as the relative strength index retraced from 85 to 60. The metric is on the rise due to a slight increase in buying pressure.
It is worth noting that the altcoin bounced off bollinger’s SMA on Wednesday. It has since used the metric as its launchpad to reclaim lost levels.
BNB/USD
BNB is rising again. It opened trading at $793 and surged, reaching a peak of $828. The altcoin has registered a new all-time high in the past few minutes and shows signs of continuing to surge higher.
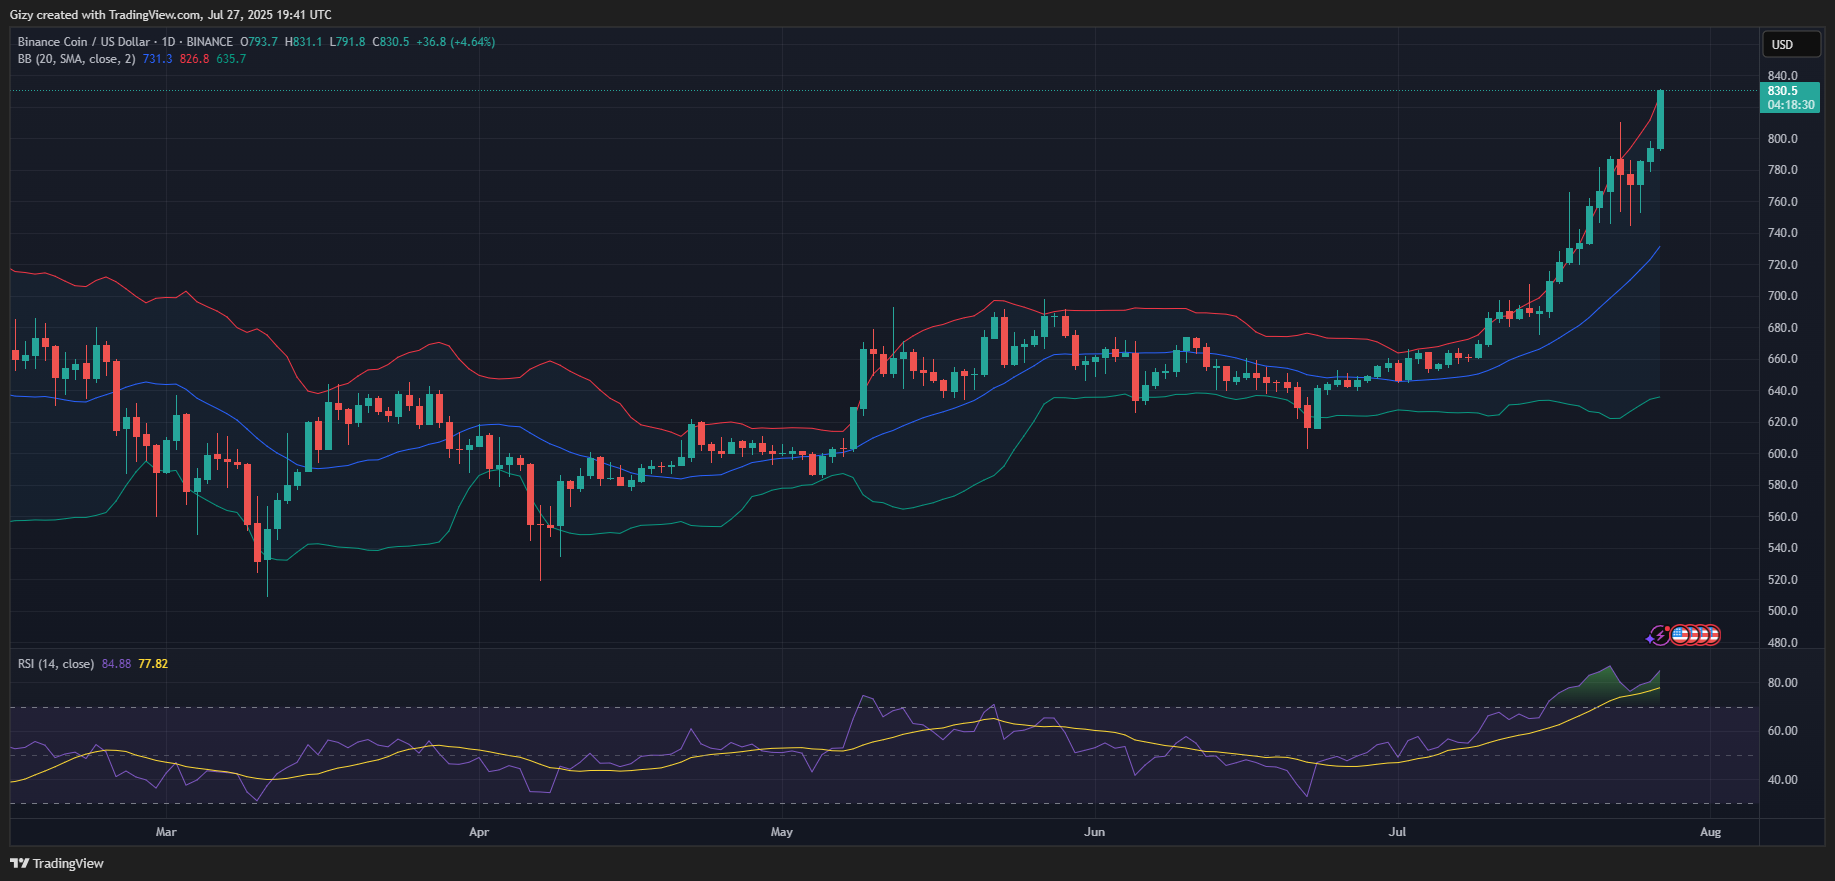
However, like SOL, it had notable declines during the week. One such was on Wednesday, when it retraced from $810 to $753. It retraced lower on Thursday but rebounded on Friday.
The asset is on the verge of registering its third day of consecutive gains. Similarly, it’s edging closer to ending the current seven-day session with gains exceeding the previous week.
Binance coin broke out of the bollinger bands a few minutes ago. It trades above the metric, raising speculations of an impending trend reversal. It is worth noting that the asset is overbought. RSI is at 84 amid the rise in buying pressure.
Data from CoinMarketCap shows that the altcoin is experiencing a notable influx of liquidity. This is what is fueling the latest surge.
SOL/USD
The bulls are attempting recovery after the massive decline of SOL on Wednesday. It retraced from $205 to $180. It plummeted lower on Thursday, reaching a low of $179 before rebounding.
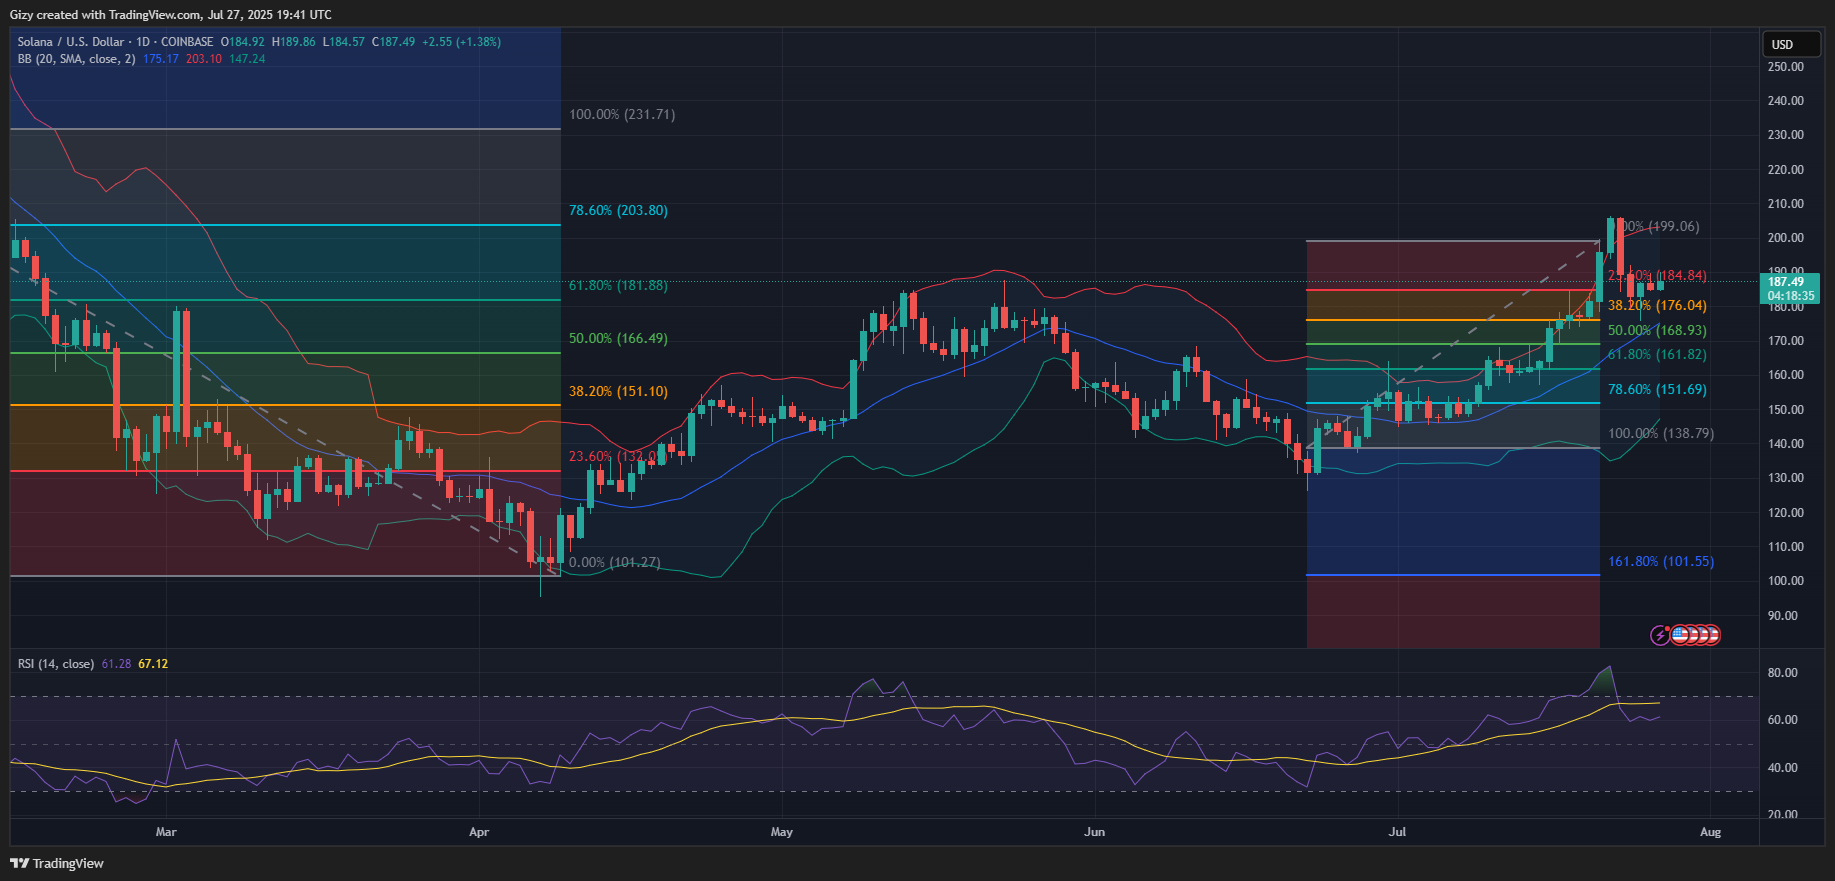
SOL is seeing slight price increases at the time of writing. The coin is up by almost 2% after failing to break above $190.
Nonetheless, the asset is on the verge of registering its third week of consistent increases. The candle representing the current session is a doji, raising concerns about how prices may perform in the coming days.
However, indicators are positive. SOL trades closer to bollinger’s middle band. A closer look at the 1-day chart indicates mild consolidation over the last three days.
The relative strength index is at 61. Its current reading is significantly lower than that of the previous day. It retraced from 82 to 59 between Wednesday and Thursday.
Get Trending Crypto News as It Happens. Follow CoinTab News on X (Twitter) Now


