Ethereum traded close to $1,900 for most of the previous seven days. The largest altcoin has traded almost in a straight line, failing to break out.
It is worth noting that since the massive dip below $1,800, ETH has failed to break above $2k. It peaked at $1,952 a few days ago and has since ranged between $1800 and $1900.
The crypto market has yet to fully recover from its bearish state. Fundamentals remain largely flat as investors become increasingly uninterested in the market. Liquidity is low, stifling recovery bids.
Ethereum shows less bullish signs at the time of writing. It has yet to experience a massive swing from news, as there is none. Fears of further declines hit new highs as CryptoQuant CEO announced the start of the bear market.
In a post on X, he acknowledges the end of the bull cycle. He said, “#Bitcoin bull cycle is over, expecting 6–12 months of bearish or sideways price action.”
The latest announcement follows a gradual decline in selling volume. Metrics from the platform pointed to the drop in selling pressure, which may mean the bulls are gearing up for a buyback. The CEO’s comment dampens the hopes of further increases.
Ethereum Remains Bearish
The largest altcoin continues to face significant selling pressure amid a slight decline in selling volume. Data from Cryptoquant suggests that it may be gearing up for another price plummet.
Exchange reserves are increasing as the selling remained consistent over the last seven days. The small increase contrasts sharply with the outflows from these trading platforms. Investors moved more assets into cold storage over the last 24 hours.
However, the whales may be the most active, as the metric shows minimal small address involvement. Network activity significantly reduced during this period. Transfer volume dropped by 32%, and active addresses reduced by 4%.
The readings attest to the vote of low confidence in the largest altcoin. The bearish states of traders from several regions show that ETH may not break out soon. Traders in the US are negative about the next price actions, as indicated by the red Coinbase premium. The Asian market is the same, as the Korea Premium remains negative.
However, investors are locking their assets. They are shifting from the short-term strategy of buying low and selling high to a long-term plan of HODLing. The latest shift explains the reason for the stability in price over the last seven days.
On-chart Indicators are Silent
The indicators on the one-day chart are fairly silent about the next price actions. The moving average convergence divergence trend is parallel following its previous bearish divergence. While this may be a sign of improving buying pressure, there is no sign of an impending bullish interception.
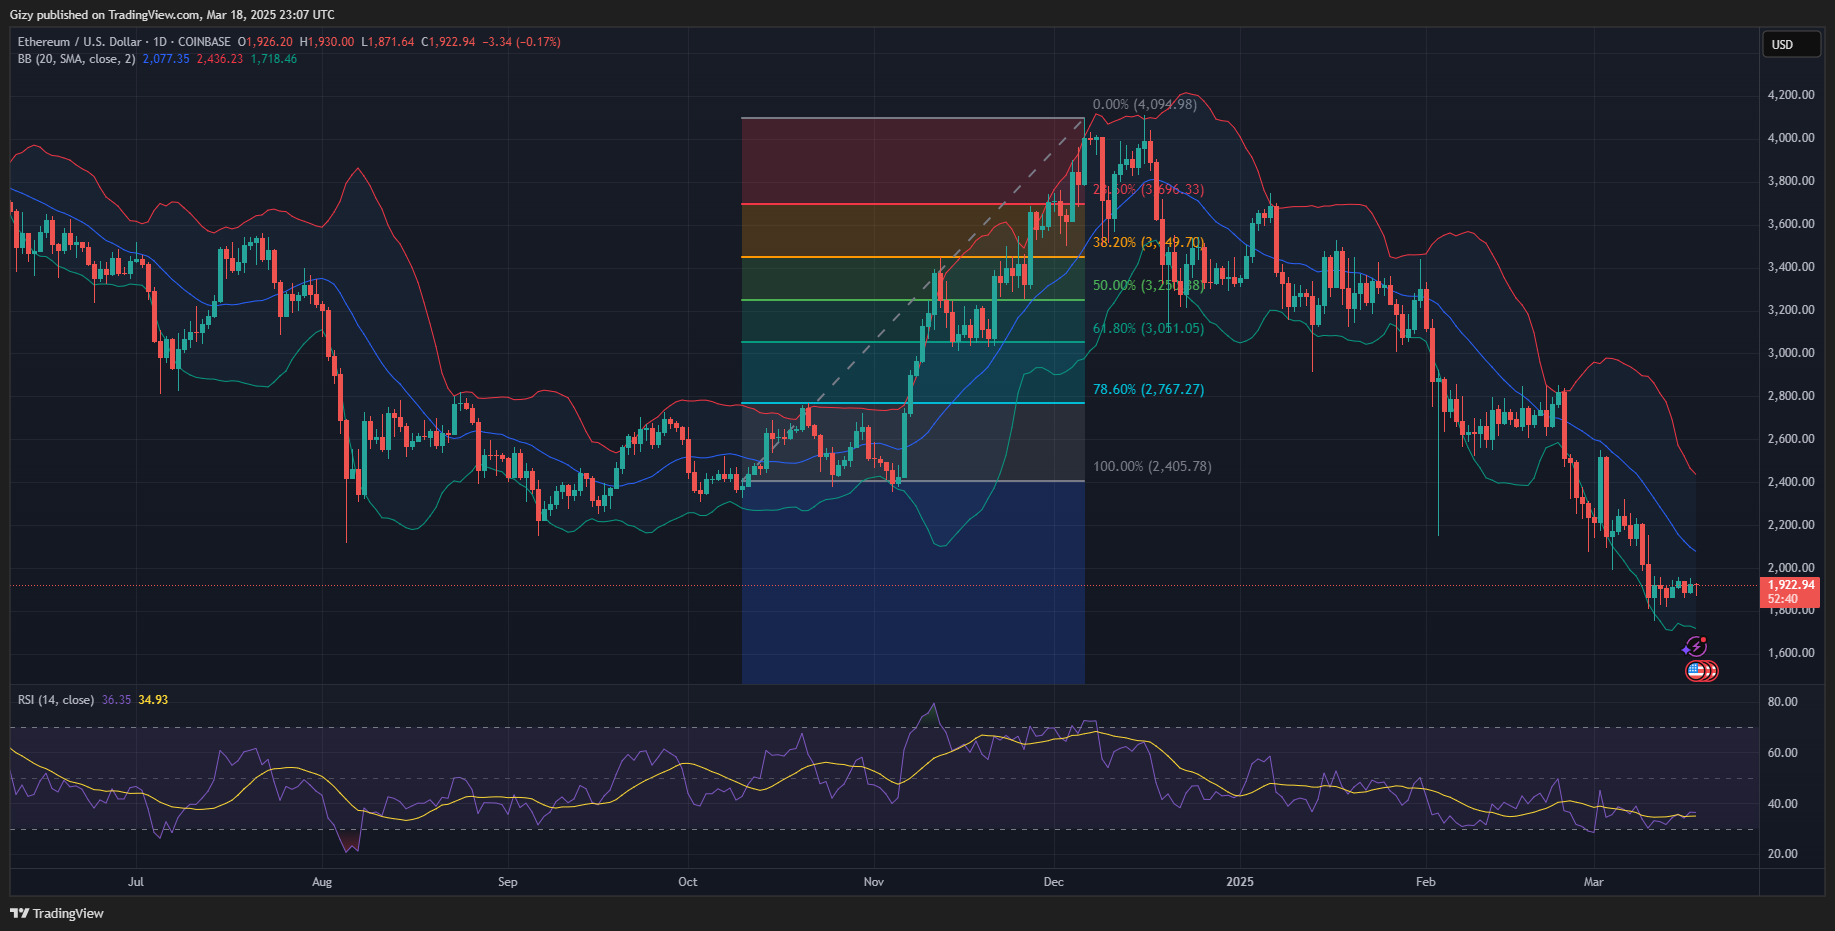
Since slipping below the Bollinger band on Mar. 10, the apex altcoin has failed to surge. Its rangebound movement has seen it remain below the middle band and lower SMA.
The relative strength index shows a healthy amount of buying pressure. The metric remained close to 30 since slipping below it a few days ago. However, the ongoing buying pressure has not significantly improved over the last seven days.
