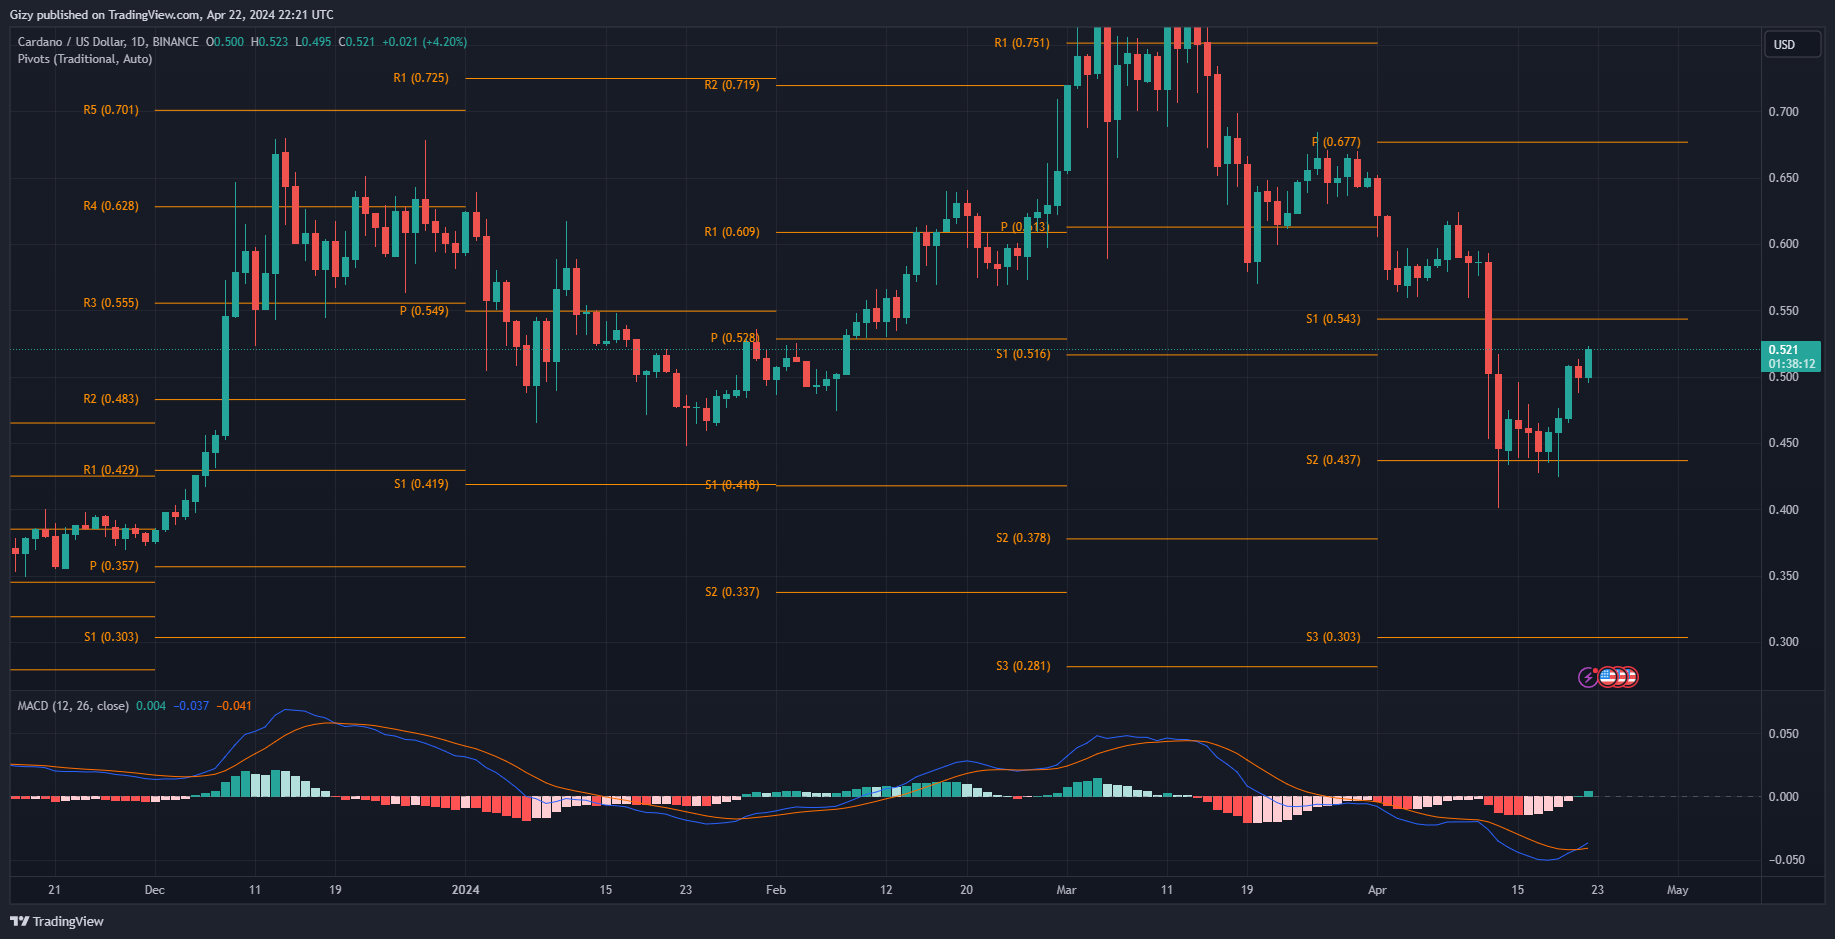
Over the last five days, Cardano mirrored Bitcoin price movement and responded to every bullish sentiment in the market. As a result, it gained over 16% and is seeing an uptick after an almost 2% decline during the previous intraday session.
This is not the first time the asset is reacting to market trends. However, in recent times it lags and consolidates while other cryptocurrencies surge. Many wonder if the same will play out this time. Nonetheless, there are telling signs to watch.
One such are fundamentals. Over the last seven days, the coin has seen significant increases in activity within its ecosystem. Per reports, in April developers deployed over 1000 smart contracts on the cardano network. The number of Plutus scripts in V1 also increased by 10 and over a thousand in v2.
The recent developments place the network as a top player in the crypto space as for the first time, the number of smart contracts exceeds that of Ethereum.
A few days ago, traders also applauded the low transaction on the Cardano network. The fees were down to the lowest this year. The founder, Hoskinson marvelled at his creation as it performed 8 transactions to 1,600 recipients for a fee of $2.38. With the improvement in the project’s posture, the deployments on it will increase which will affect the native token’s price.
With all of the previous woes behind it, the altcoin is set for more price increases.
Cardano Will Reclaim $0.54
Indicators are printing bullish signals in the short term. The Pivot Point Standard places ADA’s next price stop at S1 ($0.55). Over the last seven days, the coin traded at the S2 as the bulls built up momentum for the next uptrend which is taking place at this time.

The moving average convergence divergence suggests that the current uptrend will see the altcoin ascend to S1. The indicator displayed a bullish divergence which points to a continuation of the most recent climb. MACD’s histogram also suggests that the asset is seeing a massive amount of buying volume at this time. This comes as no surprise as it is seeing a more than 7% increase in trading volume.
RSI is trending at 46. Although still below 50, the current reading indicates recovery from a low of 29. It also attests to the current bullish action the asset is experiencing at this time.
On the other hand, the Pivot Point Standard points to a possible decline to $0.43 in the event of a correction.
ADA is Still Bearish on the Weekly Scale
The readings on the 1-day chart are for the short term. However, the asset is still bearish on the long term as indicators are yet to flip bullish on this scale.
MACD is displaying a bearish divergence following an interception by the 12-week EMA from above. There no sign of the metric reverting as the previous week’s 6% surge failed to have any impact on it. The moving average convergence divergence histogram depicts massive increases in selling pressure which will mean further price declines.
In reaction to the increase in bearish actions, the relative strength index is also on a downtrend. Per this indicator, the coin is seeing twice the level of selling as the one it experienced between July and September 2023. ADA lost over 20% during that period.
The metric is also hinting at room for more declines. Based on previous movements, it drops to 35 before a rebound. This means the asset may drop to retest its first pivot support at $0.31.
Nonetheless, the moving averages are showing signs of improvement. Following the death cross cardano had in January 2023, the 50-week MA halted its downtrend and is on an uptrend at the time of writing.
