
Ethereum dropped below $3k on Friday as news of Genesis Trading’s major asset move made the rounds. The apex altcoin dropped from $3,200 to a low of $2,985. It failed to recover and closed with losses of over 6%.
The August 2 event marked the fourth day of consecutive losses for the asset, which struggled to surge. Nonetheless, it traded above its pivot point before the most recent price decline. The drop has since resulted in further dips as traders lost faith in the asset.
ETH lost over 2% during the previous intraday session. It sank deeper, dropping from $2,901 to $2,626 before rebounding. The day ended with the altcoin registering losses of over 7%.
Current price action shows that the cryptocurrency’s worst is not over. It started trading at $2,688 but retraced to a low of $2,116 before rebounding. Trading at $2,265, the coin is down by over 15% in the last five hours. It appears to be one of the worst-hit assets by the dip.
What Caused the Dip?
On-chain data point to the coin seeing more declines in the coming days as investors from key regions are bearish at the time of writing. One such group is the ones from the US, who are in fear of an economic recession and dumping stocks and crypto as well. The Coinbase premium is negative in response to this trend.
Traders in Korea also share a similar sentiment as Korea premium is negative, indicative of the massive decline in interest from this region.
Attesting to the massive bearish sentiment affecting ETH, the exchange netflow is also negative, indicating more deposits from off-exchange sources. The trend indicates that there may be a massive selloff in the coming days. It remains to be seen if the most recent decline is the large selloff or if there is more.
Exchange reserves are also increasing, indicating a massive sell-off from traders. The bearish sentiment spread across other facets of the market, as seen in derivatives. The section sees reduced funding rates as well as a drop in open interest.
The on-chain RSI data is the only positive indicator at the time of writing. The metric tells us that the asset under review is oversold and soon to recover. The charts also show the same reading.
Ethereum is Oversold
Since the downtrend started, the relative strength index has shown considerable volatility. The metric has since been on the decline in response to growing selling pressure on the asset.
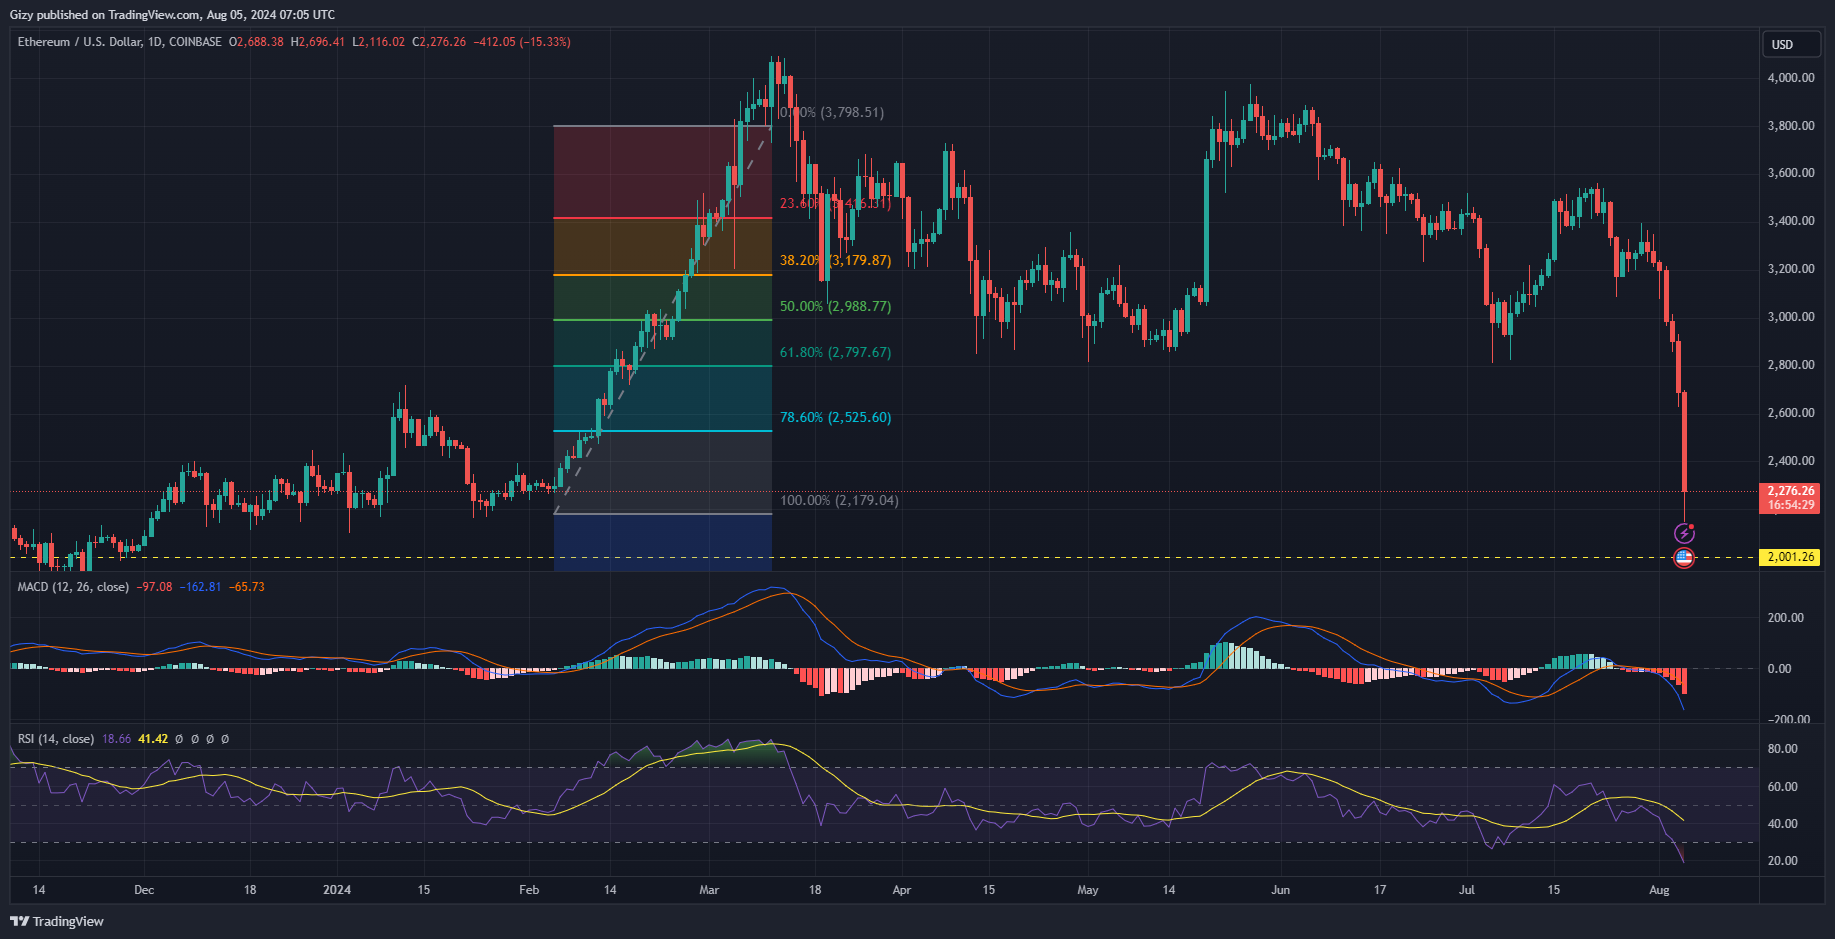
July 30 closed with the metric at 47 but dropped to 31 on August 3. The downtrend heightened in the last 48 hours. RSI has since dropped below 30. The most recent price dip saw it drop to 19, which is the lowest since September 2023.
The most recent reading points to an impending trend reversal in the coming hours. The September event saw the coin resurge during the next trading session. The chances that a recurrence of such an event may play out in the coming days.
The Fibonacci retracement level also points to an impending rebound. ETH is trading at the 100% Fib level at $2,179. This level was the starting point of the previous climb above $3k. A repeat of this trend may take place.
Aside from RSI, the moving average convergence divergence points at the ongoing massive decline. The 12-day EMA sank to its lowest in almost a year. The 26-day EMA is closing in and is heading below -100.
In other news, the global cryptocurrency market cap is down by over 10% in response to the ongoing bearish market sentiment. Valuations declined from over $2 trillion to $1.8 trillion at the time of writing. The fear and greed index is also plummeting due to the same reason. The metric retraced to a low of 40
